3340 Del Sol Blvd #217 · San Diego, CA
Flood risk 1/10 · Minimal
- FEMA flood zone
- X (unshaded)
- Chance of flooding over 30 yrs
- 0.0%
- Est. flood insurance / yr
- $507 – $1,088
Fire risk 2/10 · Minimal
- Est. fire insurance / yr
- $659 – $1,223
Heat risk 4/10 · Minor
- Hot days now (above 86°F)
- 5 days/yr
- Hot days in 30 yrs
- 14 days/yr
Wind risk 1/10 · Minimal
- Chance of severe wind over 30 yrs
- —
Air-quality risk 1/10 · Minimal
- Unhealthy air days now
- 0 days/yr
- Unhealthy air days in 30 yrs
- 0 days/yr
Risk factors via First Street. Map © Google.
Why this score? — see what drove the B+ grade
The composite is a weighted blend of 9 inputs, each scored 0–100. Each bar is that input's sub-score; the figure is the points it added to the 100-point composite (weight × sub-score).
- Cash flow +30.0/30.0
- ARV discount +15.0/15.0
- 1% rule +10.0/10.0
- DSCR +10.0/10.0
- Schools +3.9/10.0
- Livability +3.8/5.0
- Condition / age +2.5/5.0
- Rent growth +2.4/5.0
- Appreciation +0.0/10.0
$130,000
🖨 Deal sheet (PDF) 📄 Offer letter ✓ Due diligence
Listing remarks MLS
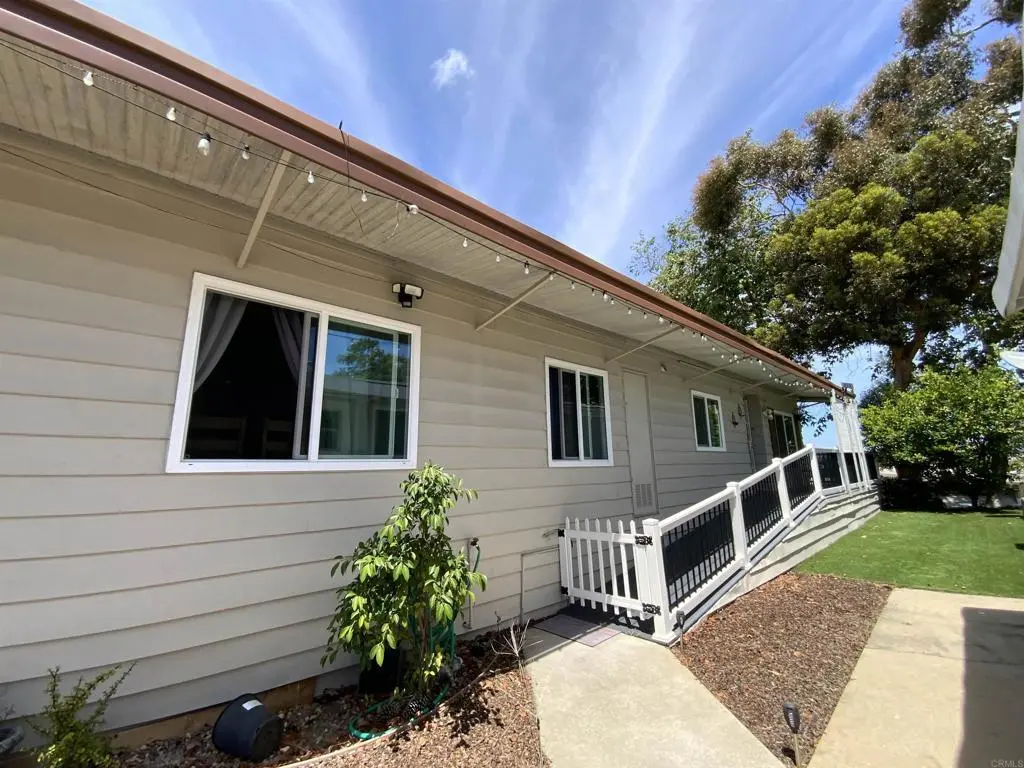
Beautiful mobile home at Ocean Bluffs Estates. Spacious 2 bedroom, 2 bathroom with panoramic wide porch looking over trees and park. An oasis of tranquility in the heart of Otay. Has 2 space carport, community pool, community jacuzzi, laundry room, clubhouse and guest parking. Buyer must be approved by mobile home park.
Key facts
- Huge back deck
- Natural light
- Curb appeal
Tags
Property features AI
Finance
- Other: Park name: Ocean Bluffs Mobile Home Estates; Directions: Take the first immediate left after entering community gate, then the first right; property is at the end of the street
- Financial info: Land lease amount: $1,818 (buyer to verify assessments)
- HOA & community: Senior community; Community features include a park; Land lease present
Exterior
- Parking: 2 parking spaces; 2-car garage spaces
- Utilities: Septic (type unknown)
- Home design: Single-story property; Mobile home (12' x 54') — mobile home remains; Located in a senior community (Ocean Bluffs Mobile Home Estates)
- Construction: Mobile home construction
- Exterior features: Community pool; Patio home; Located on a cul-de-sac; Level/flat lot; Close to clubhouse; Garden; Has a view
Interior
- Bathrooms: 2 full bathrooms
- Heating & cooling: Cooling: see remarks
- Interior features: One-level home with entry on the side; Entry room
- Laundry & utility: Laundry inside in a dedicated room; Laundry notes: see remarks
Neighborhood map
What this means for you Summary
Snapshot
- This is a 2-bed/2.0-bath manufactured listed at $130k.
Deal economics
- At list price, monthly cash flow is $2k ($23k/yr) — positive.
- The deal already cash-flows at list — no discount required.
- Meets the 1% rule at list price ($3k rent vs $130k).
- Recommended offer: $126k (3.0% below list) — sets the bar for market timing.
- Cap rate 23.7% vs local median 2.0% in San Diego — top-decile yield for the area; either an underpriced asset or a hidden risk that comps aren't pricing in. Stress-test before assuming the spread holds.
Location & tenants
- Location reads 75/100 on livability (#123 in CA, #4,206 nationally) — a middle-class / working-renter tenant base. Strengths: amenities A+, commute A+, employment A+; Watch: health & safety C-, crime D+, cost of living F.
- Sweetwater Union High (suburban): math 36% / reading 52% proficiency, ranked #187 of 517 in CA (top 36%) — families likely to look elsewhere, expect single-tenant / working-renter base with shorter leases.
- Zoned schools: Howard Pence Elementary (math 11% / reading 17%, grade F, #1,452 of 1,571 statewide, top 93%, 495 students, 74% FRL); Montgomery Middle (math 23% / reading 38%, grade F, #215 of 498 statewide, top 43%, 730 students, 82% FRL); Montgomery Senior High (math 28% / reading 53%, grade F, #508 of 1,170 statewide, top 44%, 1,745 students, 80% FRL) — zoned schools average 79% FRL vs 53% district-wide (25 pts higher); higher-poverty schools than district average — tighter screening recommended.
- Zoned-school proficiency averages 28% at this address vs 44% district-wide (-16 pts) — the specific schools serving this property underperform the Sweetwater Union High average; the district grade overstates school quality for this exact location.
- Market conditions: Rents soft (-0.5%/yr); 208 active listings in the ZIP; 17 comparable units currently listed for rent nearby; rentals leasing fast (median 3d on market — plan ~1-2 weeks tenant-placement turnaround); solid renter incomes; 11,759 units permitted in San Diego County in 2024 (7,244 in 5+ unit buildings).
- This rent runs 43% of the median local income ($95k/yr) — at the standard rent-burdened threshold; future hikes will face affordability resistance.
Forward outlook
- Local home prices are declining (-3.0%/yr); year-one equity from $899 of loan paydown is wiped out by about $4k of value loss. Plan a longer hold.
- San Diego County population projected at +20% by 2050 — long-run rental-demand tailwind backs the buy-and-hold thesis.
- At projected returns (-3.0% appreciation + 0.0% rent growth), your $36k cash investment doubles in ~2 years — after that, you're playing with house money.
Negotiation context
- It's been on market 46 days — a 3% lower offer ($126k) is reasonable based on typical stale-listing flexibility.
- 15 sale attempts since 9y ago; this cycle's ask has dropped $20k (13%) from the opening price — seller is motivated, your offer sets the floor, not the list.
- Current owner paid $46k; list at $130k implies a 183% gain — meaningful room to come down on a strong offer.
Questions for the listing agent
- It's been on market 46 days. Have you received any prior offers? Is the seller open to a 3% concession, seller financing, or rate buy-down credit?
- Built in 1979 — when were the roof, HVAC, electrical panel, plumbing, and water heater last replaced?
- Is there a deadline driving the sale (1031 exchange, divorce, estate, relocation)? That informs how much negotiation room exists.
- Schools are B-rated — typically a magnet for longer-tenancy family renters. What's the average tenant stay here, and is there a school-zone premium baked into asking?
- Crime grade is D in this area — have there been break-ins, vandalism, or insurance claims at this property in the last 3 years? What carrier currently insures it and at what premium?
- What's the average days-on-market for RENTAL listings here right now (not sales)? A rising rental-DOM trend means longer vacancies and softer asking-rent achievability than the comps imply.
- What's the recent tenant-quality profile in this submarket — average credit score on applications, eviction rate, late-payment / NSF rate, and stable-employment percentage? A property-management company in the area should have these aggregated.
- How much new for-sale + rental construction is in the pipeline within 1–3 miles? Heavy new supply typically softens prices + rents 12–24 months out; constrained supply supports both.
Investment metrics
- 1% rule
- 2.59% ✓
- Cap rate
- 23.67%
- Cash-on-cash
- 62.08%
- DSCR
- 3.76
- GRM
- 3.2
CMA / ARV
- ARV (on-the-fly)
- $171,072
- Comps found
- 12
Show comp detail 12 sales within ~0.75 mi
| Address | Dist | Beds/Ba | Sqft | Sold | Price | $/sf | Match |
|---|---|---|---|---|---|---|---|
| 3340 Del Sol Blvd #144 | 0.09mi | 2/2.0 | 1,344 (+4%) | 2mo | $195,000 | $145 | 88 |
| 3340 Del Sol Blvd #196 | 0.00mi | 2/2.0 | 1,344 (+4%) | 8mo | $170,000 | $126 | 87 |
| 3340 Del Sol Blvd #161 | 0.00mi | 2/2.0 | 1,200 (-7%) | 2mo | $85,000 | $71 | 86 |
| 3340 Del Sol #215 | 0.00mi | 2/2.0 | 1,440 (+11%) | 6mo | $190,000 | $132 | 76 |
| 3340 Del Sol Blvd, Unit 158 | 0.09mi | 2/2.0 | 1,440 (+11%) | 2mo | $125,000 | $87 | 76 |
| 3340 Del Sol Blvd Spc 126 | 0.00mi | 2/2.0 | 1,440 (+11%) | 7mo | $150,000 | $104 | 76 |
| 3340 Del Sol Blvd #180 | 0.09mi | 2/2.0 | 1,440 (+11%) | 2mo | $85,000 | $59 | 75 |
| 3340 Del Sol Blvd #21 | 0.00mi | 2/2.0 | 1,440 (+11%) | 8mo | $177,000 | $123 | 74 |
| 3340 Del Sol Blvd #237 | 0.00mi | 3/2.0 (+1) | 1,440 (+11%) | 5mo | $198,000 | $138 | 72 |
| 3340 Del Sol Blvd #102 | 0.09mi | 3/2.0 (+1) | 1,440 (+11%) | 1mo | $217,000 | $151 | 71 |
| 3340 Del Sol Blvd #249 | 0.00mi | 2/2.0 | 1,152 (-11%) | 13mo | $163,000 | $141 | 71 |
| 3340 Del Sol Blvd #209 | 0.00mi | 3/2.0 (+1) | 1,431 (+10%) | 15mo | $275,000 | $192 | 65 |
Match score weights: distance 35% · size 25% · config 20% · recency 20%. Top-matched comps best support the ARV.
Projected returns pro-forma
-3.0% appreciation · 0.0% rent growth · sell at horizon
- IRR
- 57.7%
- Equity multiple
- 3.44×
- Total profit
- $88,967
- Equity at exit
- $19,383
- IRR
- 61.5%
- Equity multiple
- 6.32×
- Total profit
- $193,642
- Equity at exit
- $11,240
Cash invested: $36,400 (down + closing). Projections, not guarantees.
Landlord ↔ Tenant lean methodology
- Overall (STATE)
- 18 Strongly Tenant-Friendly
- State California
- 18 Strongly Tenant-Friendly · D+13
- County
- — inherits STATE
- City
- — inherits STATE
ZIP-level market 92154
- Rents YoY
- -0.5%
- Active inventory
- 208
- Price-to-rent
- 3.2×
Monthly cashflow live
- Estimated rent
- $3,370 high interval (Pro) →
- Mortgage (P&I)
- −$682
- Tax from tax record
- −$44 /mo · $522/yr
- Insurance
- −$54
- HOA
- −$0
- Vacancy / Maint / Mgmt
- −$708
- Net cashflow
- $1,883
Break-even live
Sensitivity live
| Price | -10% $1,957 | -5% $1,920 | +0% $1,883 | +5% $1,846 | +10% $1,809 |
|---|---|---|---|---|---|
| Rent | -10% $1,617 | -5% $1,750 | +0% $1,883 | +5% $2,016 | +10% $2,149 |
| Rate | -1.0pp $1,949 | -0.5pp $1,916 | base $1,883 | +0.5pp $1,849 | +1.0pp $1,815 |
UW: 25.0% down · 7.5% · 30yr · 1.5% tax · 5.0% vac · 8.0% maint · 8.0% mgmt
Financing live
Cash to close
- Down payment
- $32,500
- Closing costs
- $3,900
- Reserves months
- —
- Total cash needed
- —
Loan-product check · same deal, 3 products live
Conventional
25% down · 7.5% · 30yr
- Down + closing
- —
- Monthly P&I
- —
- Monthly cashflow
- —
- DSCR
- —
- Eligible?
- —
Personal DTI + credit; lowest rate.
DSCR
20% down · 8.5% · 30yr
- Down + closing
- —
- Monthly P&I
- —
- Monthly cashflow
- —
- DSCR
- —
- Eligible?
- —
No personal income docs; deal must DSCR.
Hard money
10% down · 12.0% · 12mo
- Down + closing
- —
- Monthly P&I
- —
- Monthly cashflow
- —
- DSCR
- —
- Eligible?
- —
Short-term bridge; refi at stabilization.
Rent comps 17 comps
| Address | Beds | Baths | Sqft | Rent | $/sqft | DOM | Units | Dist |
|---|---|---|---|---|---|---|---|---|
| 3580 Marzo St San Diego, CA | 3.0 | 2.0 | 1700 | $3,500 | $2.06 | 18d | 1 | 0.32mi |
| 3624 Marzo St San Diego, CA | 3.0 | 2.0 | 1330 | $3,295 | $2.48 | 20d | 1 | 0.34mi |
| 3590 Arey Dr San Diego, CA | 3.0 | 2.0 | 1061 | $3,995 | $3.77 | 0d | 1 | 0.36mi |
| 813 Beyer Way San Diego, CA | 3.0 | 2.5 | 1495 | $3,500 | $2.34 | 4d | 1 | 0.38mi |
| 3822 Enero Ct San Diego, CA | 3.0 | 2.0 | 1012 | $3,850 | $3.80 | 11d | 1 | 0.50mi |
| 1515 Kenalan Dr San Diego, CA | 3.0 | 2.0 | 1140 | $3,500 | $3.07 | 0d | 1 | 0.74mi |
| 3763 Via del Bardo San Ysidro, CA | 3.0 | 2.5 | 1472 | $4,200 | $2.85 | 4d | 1 | 0.76mi |
| 2709 Elm Ave Unit B San Diego, CA | 3.0 | 3.0 | 1560 | $3,449 | $2.21 | 0d | 1 | 0.94mi |
| 2683 Caulfield Dr San Diego, CA | 3.0 | 2.0 | 1445 | $3,995 | $2.76 | 0d | 1 | 0.97mi |
| 1587 Oro Vista Rd San Diego, CA | 1.0–2.0 | 1.0–2.0 | 805 | $2,495 | $3.10 | 0d | 3 | 1.12mi |
| 1394 Oro Vista Rd San Diego, CA | 2.0 | 2.0 | 1027 | $2,772 | $2.70 | 0d | 3 | 1.19mi |
| 4483 Corona Borealis San Diego, CA | 2.0 | 2.5 | 1400 | $3,800 | $2.71 | 16d | 1 | 1.32mi |
| 2367 Grove Ave San Diego, CA | 1.0–2.0 | 1.0 | 741 | $2,495 | $3.36 | 3d | 4 | 1.34mi |
| 3875 Main St Chula Vista, CA | 1.0–2.0 | 1.0–2.0 | 813 | $2,950 | $3.63 | 0d | 9 | 1.38mi |
| 1001 Outer Rd San Diego, CA | 2.0 | 2.0 | 1000 | $2,538 | $2.54 | 3d | 5 | 1.40mi |
| 217 Date St Unit B Chula Vista, CA | 3.0 | 2.5 | 1228 | $3,500 | $2.85 | 4d | 1 | 1.41mi |
| 1100 Dennery Rd San Diego, CA | 1.0–3.0 | 1.0–2.0 | 975 | $3,052 | $3.13 | 0d | 27 | 1.41mi |
Listing history 50 events
-
2026-06-21pricedays on market $130,000 Active 46 DOM
-
2026-06-18days on market $150,000 Active 43 DOM
-
2026-06-17days on market $150,000 Active 42 DOM
-
2026-06-16days on market $150,000 Active 41 DOM
-
2026-06-15days on market $150,000 Active 40 DOM
-
2026-06-13days on market $150,000 Active 38 DOM
-
2026-06-13days on market $150,000 Active 37 DOM
-
2026-06-09days on market $150,000 Active 34 DOM
-
2026-06-08days on market $150,000 Active 33 DOM
-
2026-06-07days on market $150,000 Active 32 DOM
-
2026-06-04days on market $150,000 Active 29 DOM
-
2026-06-03days on market $150,000 Active 28 DOM
-
2026-06-02days on market $150,000 Active 27 DOM
-
2026-06-01days on market $150,000 Active 26 DOM
-
2026-05-31days on market $150,000 Active 25 DOM
-
2026-05-04$150,000 Active
-
2021-07-22soldstatus $46,000 Closed Sale 321-char remark
Show marketing remark (321 chars)
Beautiful mobile home at Ocean Bluffs Estates. Spacious 2 bedroom, 2 bathroom with panoramic wide porch looking over trees and park. An oasis of tranquility in the heart of Otay. Has 2 space carport, community pool, community jacuzzi, laundry room, clubhouse and guest parking. Buyer must be approved by mobile home park.
-
2021-05-18historical Active Under Contract 321-char remark
Show marketing remark (321 chars)
Beautiful mobile home at Ocean Bluffs Estates. Spacious 2 bedroom, 2 bathroom with panoramic wide porch looking over trees and park. An oasis of tranquility in the heart of Otay. Has 2 space carport, community pool, community jacuzzi, laundry room, clubhouse and guest parking. Buyer must be approved by mobile home park.
-
2021-05-02price $44,900 321-char remark
Show marketing remark (321 chars)
Beautiful mobile home at Ocean Bluffs Estates. Spacious 2 bedroom, 2 bathroom with panoramic wide porch looking over trees and park. An oasis of tranquility in the heart of Otay. Has 2 space carport, community pool, community jacuzzi, laundry room, clubhouse and guest parking. Buyer must be approved by mobile home park.
-
2021-04-02price $49,900 321-char remark
Show marketing remark (321 chars)
Beautiful mobile home at Ocean Bluffs Estates. Spacious 2 bedroom, 2 bathroom with panoramic wide porch looking over trees and park. An oasis of tranquility in the heart of Otay. Has 2 space carport, community pool, community jacuzzi, laundry room, clubhouse and guest parking. Buyer must be approved by mobile home park.
-
2021-02-12$59,900 Active 321-char remark
Show marketing remark (321 chars)
Beautiful mobile home at Ocean Bluffs Estates. Spacious 2 bedroom, 2 bathroom with panoramic wide porch looking over trees and park. An oasis of tranquility in the heart of Otay. Has 2 space carport, community pool, community jacuzzi, laundry room, clubhouse and guest parking. Buyer must be approved by mobile home park.
-
2020-09-30historical
-
2020-08-07price $49,000
-
2020-08-07price $49,000
-
2020-03-02$55,000 Active
-
2020-02-20historical
-
2020-02-20historical
-
2020-02-19price $65,000
-
2020-02-19price $65,000
-
2020-02-18status Active
-
2020-02-18status Active
-
2020-01-25Active Under Contract
-
2020-01-24Contingent
-
2019-12-19$90,000
-
2019-12-19$90,000
-
2019-12-18historical
-
2019-12-17historical
-
2019-09-18status Active
-
2019-09-16historical
-
2019-09-06price $68,000
-
2019-05-31price $79,999
-
2019-03-30$112,000 Active
-
2019-03-30$68,000
-
2018-02-15soldstatus $38,000
-
2018-02-15soldstatus $38,000 Sold
-
2018-02-06status Pending
-
2018-02-01historical
-
2018-01-18price $33,000
-
2018-01-04price $38,000
-
2018-01-04status Active
ⓘ Source: listings_history table (triggers on properties + properties_extension) + one-shot
backfill from property_details.listing_events for pre-trigger history.
Tax reassessment forecast CA · Resets to sale price
- Current annual tax
- $522 · $44/mo
- Projected year-2 tax
- $988 · $82/mo
- Expected delta
- +$466/yr (+$39/mo · 89.3%)
ⓘ Screening estimate from a state-policy table — verify with the county assessor before closing.
Climate risk First Street
- Flood 1/10 Low FEMA zone X (unshaded) · 0% chance over 30 yrs
- Wildfire 2/10 Low
- Heat 4/10 Moderate 5 d/yr ≥86°F today · 14 d/yr by 30 yrs out
- Wind 1/10 Low
- Air quality 1/10 Low 0 unhealthy d/yr today · 0 by 30 yrs out
Nearby sold comps map
Loading sold comps map…
Walkable amenities ~0.75 mi
Loading nearby amenities…
Taxation est. · year 1
- Rental income
- $40,442
- − Mortgage interest
- −$7,282
- − Property taxes
- −$522
- − Insurance
- −$650
- − Repairs & maintenance
- −$3,235
- − Management
- −$3,235
- − Depreciation
- −$3,782
- Taxable income
- $21,735
- Est. tax owed @ 24.0%
- −$5,217
- After-tax cash flow
- $17,380/yr
For passive investors: Depreciation is non-cash, so a rental often shows a tax loss while cash-flowing — sheltering income. Rental losses are passive: they offset passive income freely, and up to $25,000/yr can offset ordinary (W-2) income if you actively participate and your MAGI is under $100k (phasing out to $0 by $150k); unused losses carry forward. On sale, claimed depreciation is recaptured at up to 25%, and gains may owe capital-gains tax (a 1031 exchange can defer both). Figures are a year-1 estimate at your 24.0% rate — not tax advice; consult a CPA.
Schools (NCES district)
- District
- Sweetwater Union High
- NCES district ID
- 0638640
- Math proficiency
- 36% ▲ 3.00%
- Reading proficiency
- 52% ▼ -2.00%
- Median HH income
- $59,051
- Composite
- 38.61/100
- National rank
- #4158
- State rank
- #187 of 517 in CA
Livability — San Diego
- Score
- 75/100
- State rank
- #123
- US rank
- #4206
Category grades
Schools grade is shown separately in the Schools card above.
Census & demographics
- Census place
- San Diego, CA
- County
- San Diego County · 3,178,799 people
- City population
- 1,397,612
- Metro
- San Diego-Chula Vista-Carlsbad, CA
- Population (ZIP)
- 80,445
- Household income
- $94,901
- Rent vs Own
- Severe rent burden
- 2959.0
Population outlook (San Diego County) Hauer SSP2
- Today (2025)
- 3,678,185 people
- By 2030
- 3,856,546 · +4.8%
- By 2040
- 4,171,407 · +13.4%
- By 2050
- 4,421,607 · +20.2%
- By 2075
- 4,831,599 · +31.4%
- By 2100
- 4,832,502 · +31.4%
Race, ethnicity, and origin ACS 2023
- Neighborhood character
- Predominantly Hispanic (68%)
- Race & ethnicity
- Hispanic / Latino 68% Two or more races 30% White 12% Asian 12% Black 5% Native American 1%
- Hispanic origin (detail)
- Mexican 65%
- Foreign-born
- 32% · Canada, China
- Languages at home
- 35% English-only · Spanish 56% Tagalog/Filipino 7% Chinese 1%
Political lean MEDSL · San Diego
- 2024 margin
- D (+16.8) · D 56.9% · R 40.1% · Other 2.9%
- 2008→2024 swing
- +6.6pp toward D · 2008: 10.2pp · 2024: 16.8pp
- All cycles
- 2024: D+16.8 2020: D+22.8 2016: D+17.8 2012: D+5.1 2008: D+10.2
Not yet ingested
- Civics
- —
Market trends
- HPI YoY
- ▼ -568.62%
- Current HPI
- 393.1836
- Rent YoY
- ▼ -0.52%
- Metro
- San Diego-Chula Vista-Carlsbad, CA
- State GDP YoY
- ▲ 3.21%
- F500 in state
- 116
Industry mix (Fortune 500 HQ in CA)
| Industry | F500 HQs | Revenue |
|---|---|---|
| Technology | 27 | $1,492B |
|
||
| Financial Services | 3 | $174B |
|
||
| Retail | 3 | $44B |
|
||
| Insurance | 3 | $26B |
|
||
| Media / Entertainment | 2 | $115B |
|
||
| Pharmaceuticals / Biotech | 2 | $62B |
|
||
Price history
+354.5% since first listed40 events — show timeline
- 2026-05-04 Listed $150,000 CRMLS
- 2021-07-22 Sold (MLS) $46,000 CRMLS
- 2021-05-18 Contingent — CRMLS
- 2021-05-02 Price Changed $44,900 CRMLS
- 2021-04-02 Price Changed $49,900 CRMLS
- 2021-02-12 Listed $59,900 CRMLS
- 2020-09-30 Listing Removed — CRMLS
- 2020-08-07 Price Changed $49,000 SDMLS
- 2020-08-07 Price Changed $49,000 CRMLS
- 2020-03-02 Listed $55,000 CRMLS
- 2020-02-20 Listing Removed — CRMLS
- 2020-02-20 Listing Removed — SDMLS
- 2020-02-19 Price Changed $65,000 SDMLS
- 2020-02-19 Price Changed $65,000 CRMLS
- 2020-02-18 Relisted — CRMLS
- 2020-02-18 Relisted — SDMLS
- 2020-01-25 Listed — CRMLS
- 2020-01-24 Listed — SDMLS
- 2019-12-19 Listed $90,000 CRMLS
- 2019-12-19 Listed $90,000 SDMLS
- 2019-12-18 Listing Removed — SDMLS
- 2019-12-17 Listing Removed — CRMLS
- 2019-09-18 Relisted — SDMLS
- 2019-09-16 Listing Removed — SDMLS
- 2019-09-06 Price Changed $68,000 SDMLS
- 2019-05-31 Price Changed $79,999 SDMLS
- 2019-03-30 Listed $68,000 CRMLS
- 2019-03-30 Listed $112,000 SDMLS
- 2018-02-15 Sold (MLS) $38,000 SDMLS
- 2018-02-15 Sold (MLS) $38,000 CRMLS
- 2018-02-06 Pending — SDMLS
- 2018-02-01 Listing Removed — CRMLS
- 2018-01-18 Price Changed $33,000 SDMLS
- 2018-01-04 Price Changed $38,000 SDMLS
- 2018-01-04 Relisted — SDMLS
- 2017-12-29 Pending — SDMLS
- 2017-11-15 Price Changed $43,000 SDMLS
- 2017-11-03 Price Changed $49,000 SDMLS
- 2017-11-01 Listed $49,900 SDMLS
- 2017-10-30 Listed $33,000 CRMLS
Property tax history
+3.2%/yrLatest (2013): $522 · +4.7% YoY. Source: county tax records.
Cash-flow waterfall
monthlySold comps — $/sqft
last 12 mo · ≤1 miLoading sold comps…