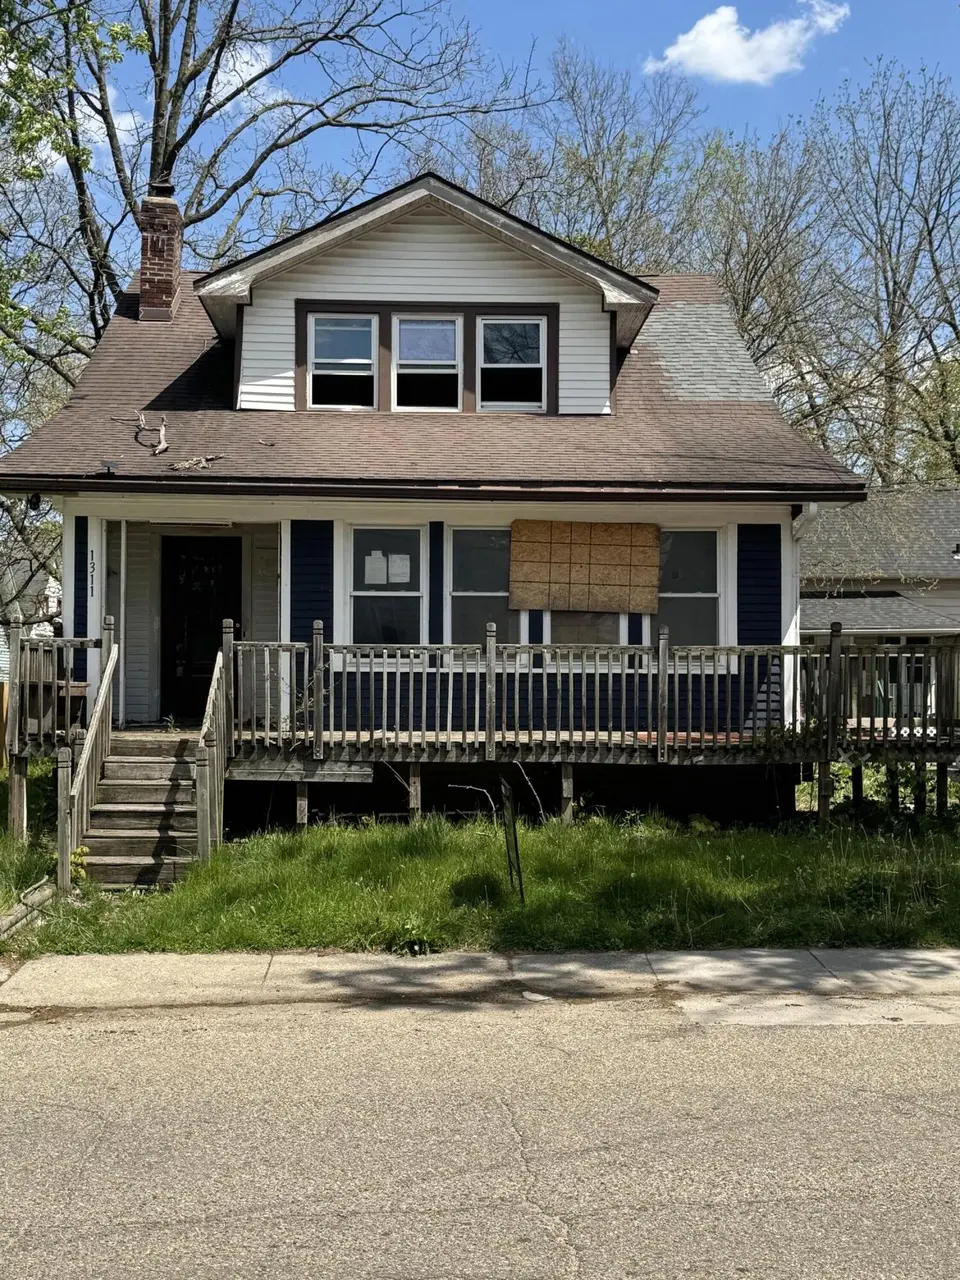
1311 James St · Kalamazoo, MI
Flood risk 1/10 · Minimal
- FEMA flood zone
- X (unshaded)
- Chance of flooding over 30 yrs
- 0.0%
- Est. flood insurance / yr
- $507 – $1,088
Fire risk 1/10 · Minimal
- Est. fire insurance / yr
- $784 – $1,456
Heat risk 2/10 · Minimal
- Hot days now (above 100°F)
- 7 days/yr
- Hot days in 30 yrs
- 16 days/yr
Wind risk 2/10 · Minimal
- Chance of severe wind over 30 yrs
- —
Air-quality risk 2/10 · Minimal
- Unhealthy air days now
- 1 days/yr
- Unhealthy air days in 30 yrs
- 2 days/yr
Risk factors via First Street. Map © Google.
Why this score? — see what drove the B grade
The composite is a weighted blend of 9 inputs, each scored 0–100. Each bar is that input's sub-score; the figure is the points it added to the 100-point composite (weight × sub-score).
- Cash flow +30.0/30.0
- 1% rule +10.0/10.0
- DSCR +10.0/10.0
- ARV discount +7.5/15.0
- Schools +4.7/10.0
- Rent growth +4.1/5.0
- Livability +3.8/5.0
- Condition / age +2.5/5.0
- Appreciation +0.0/10.0
$64,900
🖨 Deal sheet (PDF) 📄 Offer letter ✓ Due diligence
Listing remarks MLS
Investor special in Kalamazoo! This 4-bedroom, 1.5-bath Cape Cod offers over 1,300 sq ft with a full basement and detached garage. Property is in need of repairs and updates, but features solid bones and strong potential for value-add. Ideal for investors, flippers, or buyers looking to build equity. Suitable for cash or renovation financing only (FHA 203K, conventional rehab, or DSCR). Located in the Edison neighborhood with convenient access to local amenities. Property is being sold as-is.
Key facts
- Strong potential
- Solid bones
- Convenient access
Tags
Property features AI
Exterior
- Parking: Detached garage (1 car)
- Home design: Cape Cod style; Single-family residence; Residential property
- Construction: Wood siding; Built in 1925
- Exterior features: Public water; Lot size about 0.05 acres
Interior
- Bathrooms: 1 full bathroom; 1 half bathroom
- Heating & cooling: Forced air heating
- Interior features: 10 total rooms; Partial basement
Neighborhood map
What this means for you Summary
Snapshot
- This is a 3-bed/1.5-bath single-family listed at $65k.
Deal economics
- At list price, monthly cash flow is $868 ($10k/yr) — positive.
- The deal already cash-flows at list — no discount required.
- Meets the 1% rule at list price ($2k rent vs $65k).
- Recommended offer: $64k (1.5% below list) — sets the bar for market timing.
- Cap rate 22.3% vs local median 4.1% in Kalamazoo — top-decile yield for the area; either an underpriced asset or a hidden risk that comps aren't pricing in. Stress-test before assuming the spread holds.
Location & tenants
- Location reads 76/100 on livability (#141 in MI, #3,492 nationally) — a middle-class / working-renter tenant base. Strengths: commute A+, cost of living A+, housing A+; Watch: crime F, employment D-.
- Kalamazoo Public Schools (urban): math 43% / reading 72% proficiency, ranked #71 of 540 in MI (top 13%) — acceptable for families but not a draw, mixed tenant base, ~2y average lease; 66% free/reduced lunch — lower-income household profile, screen leases tightly.
- Zoned schools: El Sol Elementary (351 students, 71% FRL); Maple Street Magnet School For The Arts (math 75% / reading 75%, grade A, #8 of 493 statewide, top 3%, 860 students, 59% FRL); Loy Norrix High School (math 47% / reading 82%, grade B-, #46 of 713 statewide, top 7%, 1,771 students, 68% FRL) — zoned schools at 66% FRL track the district average.
- Zoned-school proficiency averages 70% at this address vs 58% district-wide (+12 pts) — the actual schools serving this property are materially stronger than the Kalamazoo Public Schools average implies; a family-tenant draw the district grade alone would hide.
- Market conditions: Rents rising fast (+6.4%/yr); 109 active listings in the ZIP; 11 comparable units currently listed for rent nearby; rentals at typical pace (median 23d on market — plan ~3-4 weeks tenant-placement turnaround); 339 units permitted in Kalamazoo County in 2024 (22 in 5+ unit buildings).
Forward outlook
- Local home prices are declining (-3.0%/yr); year-one equity from $449 of loan paydown is wiped out by about $2k of value loss. Plan a longer hold.
- Kalamazoo County population projected at +18% by 2050 — long-run rental-demand tailwind backs the buy-and-hold thesis.
- At projected returns (-3.0% appreciation + 6.4% rent growth), your $18k cash investment doubles in ~2 years — after that, you're playing with house money.
Negotiation context
- It's been on market 23 days — a 2% lower offer ($64k) is reasonable based on typical stale-listing flexibility.
- 13 sale attempts since 32y ago with the ask held roughly flat each time — persistent listings suggest the price (not the market) is what's stuck; bring a comps-based counter.
- Current owner paid $20k; list at $65k implies a 217% gain — meaningful room to come down on a strong offer.
Risks & watch-outs
- Watch-outs: built in 1925 — expect roof / HVAC / electrical / plumbing capex.
Questions for the listing agent
- Built in 1925 — when were the roof, HVAC, electrical panel, plumbing, and water heater last replaced?
- Is there a deadline driving the sale (1031 exchange, divorce, estate, relocation)? That informs how much negotiation room exists.
- Crime grade is F in this area — have there been break-ins, vandalism, or insurance claims at this property in the last 3 years? What carrier currently insures it and at what premium?
- What's the average days-on-market for RENTAL listings here right now (not sales)? A rising rental-DOM trend means longer vacancies and softer asking-rent achievability than the comps imply.
- What's the recent tenant-quality profile in this submarket — average credit score on applications, eviction rate, late-payment / NSF rate, and stable-employment percentage? A property-management company in the area should have these aggregated.
- How much new for-sale + rental construction is in the pipeline within 1–3 miles? Heavy new supply typically softens prices + rents 12–24 months out; constrained supply supports both.
Investment metrics
- 1% rule
- 2.57% ✓
- Cap rate
- 22.35%
- Cash-on-cash
- 57.33%
- DSCR
- 3.55
- GRM
- 3.2
CMA / ARV
- ARV (on-the-fly)
- $145,856
- Comps found
- 12
Show comp detail 12 sales within ~0.75 mi
| Address | Dist | Beds/Ba | Sqft | Sold | Price | $/sf | Match |
|---|---|---|---|---|---|---|---|
| 1116 March St | 0.17mi | 3/2.0 | 1,396 (+2%) | 4mo | $69,900 | $50 | 84 |
| 923 Stockbridge Ave | 0.15mi | 3/2.0 | 1,461 (+6%) | 3mo | $148,000 | $101 | 78 |
| 1612 E Stockbridge Ave | 0.28mi | 3/1.5 | 1,301 (-6%) | 4mo | $156,500 | $120 | 74 |
| 1313 Reed Ave | 0.29mi | 4/2.0 (+1) | 1,350 (-2%) | 5mo | $70,000 | $52 | 72 |
| 1012 Mills St | 0.23mi | 2/1.5 (-1) | 1,485 (+8%) | 2mo | $162,900 | $110 | 69 |
| 734 E Stockbridge Ave | 0.32mi | 4/1.0 (+1) | 1,294 (-6%) | 1mo | $45,000 | $35 | 68 |
| 901 Clarence St | 0.35mi | 3/1.5 | 1,494 (+9%) | 3mo | $174,900 | $117 | 67 |
| 1114 Lane Blvd | 0.44mi | 3/2.0 | 1,319 (-4%) | 4mo | $135,500 | $103 | 67 |
| 855 Lay Blvd | 0.40mi | 3/1.5 | 1,510 (+10%) | 6mo | $160,000 | $106 | 60 |
| 1510 Egleston Ave | 0.25mi | 4/2.0 (+1) | 1,566 (+14%) | 1mo | $200,000 | $128 | 58 |
| 1721 Egleston Ave | 0.37mi | 3/1.5 | 1,186 (-14%) | 2mo | $115,000 | $97 | 58 |
| 719 Millard Ct | 0.61mi | 4/1.0 (+1) | 1,522 (+11%) | 2mo | $165,000 | $108 | 45 |
Match score weights: distance 35% · size 25% · config 20% · recency 20%. Top-matched comps best support the ARV.
Projected returns pro-forma
-3.0% appreciation · 6.41% rent growth · sell at horizon
- IRR
- 59.7%
- Equity multiple
- 3.79×
- Total profit
- $50,718
- Equity at exit
- $9,677
- IRR
- 65.6%
- Equity multiple
- 8.79×
- Total profit
- $141,500
- Equity at exit
- $5,611
Cash invested: $18,172 (down + closing). Projections, not guarantees.
Landlord ↔ Tenant lean methodology
- Overall (STATE)
- 62 Landlord-Friendly
- State Michigan
- 62 Landlord-Friendly · EVEN
- County
- — inherits STATE
- City
- — inherits STATE
ZIP-level market 49001
- Rents YoY
- 6.4%
- Active inventory
- 109
- Price-to-rent
- 3.2×
Monthly cashflow live
- Estimated rent
- $1,667 high interval (Pro) →
- Mortgage (P&I)
- −$340
- Tax est. 1.5%
- −$81 /mo · $974/yr
- Insurance
- −$27
- HOA
- −$0
- Vacancy / Maint / Mgmt
- −$350
- Net cashflow
- $868
Break-even live
Sensitivity live
| Price | -10% $913 | -5% $891 | +0% $868 | +5% $846 | +10% $823 |
|---|---|---|---|---|---|
| Rent | -10% $737 | -5% $802 | +0% $868 | +5% $934 | +10% $1,000 |
| Rate | -1.0pp $901 | -0.5pp $885 | base $868 | +0.5pp $851 | +1.0pp $834 |
UW: 25.0% down · 7.5% · 30yr · 1.5% tax · 5.0% vac · 8.0% maint · 8.0% mgmt
Financing live
Cash to close
- Down payment
- $16,225
- Closing costs
- $1,947
- Reserves months
- —
- Total cash needed
- —
Loan-product check · same deal, 3 products live
Conventional
25% down · 7.5% · 30yr
- Down + closing
- —
- Monthly P&I
- —
- Monthly cashflow
- —
- DSCR
- —
- Eligible?
- —
Personal DTI + credit; lowest rate.
DSCR
20% down · 8.5% · 30yr
- Down + closing
- —
- Monthly P&I
- —
- Monthly cashflow
- —
- DSCR
- —
- Eligible?
- —
No personal income docs; deal must DSCR.
Hard money
10% down · 12.0% · 12mo
- Down + closing
- —
- Monthly P&I
- —
- Monthly cashflow
- —
- DSCR
- —
- Eligible?
- —
Short-term bridge; refi at stabilization.
Rent comps 11 comps
| Address | Beds | Baths | Sqft | Rent | $/sqft | DOM | Units | Dist |
|---|---|---|---|---|---|---|---|---|
| 1512 S Burdick St Kalamazoo, MI | 3.0 | 1.0 | 887 | $1,250 | $1.41 | 15d | 1 | 0.94mi |
| 525 S Burdick St Kalamazoo, MI | 2.0 | 2.0 | 1555 | $2,928 | $1.88 | 15d | 2 | 1.08mi |
| 211 Rose Pl Kalamazoo, MI | 2.0 | 2.0 | 1695 | $1,200 | $0.71 | 22d | 1 | 1.09mi |
| 310 E Michigan Ave Kalamazoo, MI | 2.0 | 2.0 | 1100 | $1,385 | $1.26 | 22d | 1 | 1.25mi |
| 2725 S Burdick St Kalamazoo, MI | 2.0 | 1.0 | 1000 | $1,250 | $1.25 | 15d | 1 | 1.26mi |
| 125 S Kalamazoo Mall Kalamazoo, MI | 2.0 | 2.0 | 1833 | $3,088 | $1.68 | 15d | 1 | 1.29mi |
| 23 Ridgewood St Kalamazoo, MI | 2.0 | 1.0 | 1100 | $1,295 | $1.18 | 22d | 1 | 1.34mi |
| 1403 Sherwood Ave Unit 2 Kalamazoo, MI | 2.0 | 1.0 | 900 | $1,000 | $1.11 | 22d | 1 | 1.35mi |
| 807 Central Park Cir Kalamazoo, MI | 1.0–3.0 | 1.0–2.0 | 1089 | $2,345 | $2.15 | 15d | 12 | 1.38mi |
| 2002 S Westnedge Ave Kalamazoo, MI | 2.0 | 1.0 | 900 | $1,250 | $1.39 | 22d | 2 | 1.38mi |
| 525 E Ransom St Kalamazoo, MI | 1.0–2.0 | 1.0–2.0 | 807 | $1,625 | $2.01 | 22d | 1 | 1.44mi |
Listing history 24 events
-
2026-05-04$64,900 Active 497-char remark
Show marketing remark (497 chars)
Investor special in Kalamazoo! This 4-bedroom, 1.5-bath Cape Cod offers over 1,300 sq ft with a full basement and detached garage. Property is in need of repairs and updates, but features solid bones and strong potential for value-add. Ideal for investors, flippers, or buyers looking to build equity. Suitable for cash or renovation financing only (FHA 203K, conventional rehab, or DSCR). Located in the Edison neighborhood with convenient access to local amenities. Property is being sold as-is.
-
2026-05-04$64,900 Active
Show marketing remark (497 chars)
Investor special in Kalamazoo! This 4-bedroom, 1.5-bath Cape Cod offers over 1,300 sq ft with a full basement and detached garage. Property is in need of repairs and updates, but features solid bones and strong potential for value-add. Ideal for investors, flippers, or buyers looking to build equity. Suitable for cash or renovation financing only (FHA 203K, conventional rehab, or DSCR). Located in the Edison neighborhood with convenient access to local amenities. Property is being sold as-is.
-
2016-01-15soldstatus $20,500
-
2016-01-15soldstatus $20,500 Sold
-
2015-12-22status Pending
-
2015-11-17$20,600 Active
-
2015-11-17$20,600
-
2014-09-15historical
-
2000-03-15soldstatus $58,700
-
2000-03-15soldstatus $58,700
-
2000-01-01$59,900
-
2000-01-01$59,900
-
1999-11-30historical
-
1999-08-10$59,900
-
1999-08-10$59,900
-
1997-03-14soldstatus $43,000
-
1997-03-14soldstatus $43,000
-
1997-02-06$43,000
-
1997-02-06$43,000
-
1995-04-07soldstatus $31,500
-
1995-04-07soldstatus $31,500
-
1994-06-20$35,000
-
1994-06-20$35,000
ⓘ Source: listings_history table (triggers on properties + properties_extension) + one-shot
backfill from property_details.listing_events for pre-trigger history.
Climate risk First Street
- Flood 1/10 Low FEMA zone X (unshaded) · 0% chance over 30 yrs
- Wildfire 1/10 Low
- Heat 2/10 Low 7 d/yr ≥100°F today · 16 d/yr by 30 yrs out
- Wind 2/10 Low
- Air quality 2/10 Low 1 unhealthy d/yr today · 2 by 30 yrs out
Nearby sold comps map
Loading sold comps map…
Walkable amenities ~0.75 mi
Loading nearby amenities…
Taxation est. · year 1
- Rental income
- $20,001
- − Mortgage interest
- −$3,635
- − Property taxes
- −$974
- − Insurance
- −$324
- − Repairs & maintenance
- −$1,600
- − Management
- −$1,600
- − Depreciation
- −$1,888
- Taxable income
- $9,979
- Est. tax owed @ 24.0%
- −$2,395
- After-tax cash flow
- $8,023/yr
For passive investors: Depreciation is non-cash, so a rental often shows a tax loss while cash-flowing — sheltering income. Rental losses are passive: they offset passive income freely, and up to $25,000/yr can offset ordinary (W-2) income if you actively participate and your MAGI is under $100k (phasing out to $0 by $150k); unused losses carry forward. On sale, claimed depreciation is recaptured at up to 25%, and gains may owe capital-gains tax (a 1031 exchange can defer both). Figures are a year-1 estimate at your 24.0% rate — not tax advice; consult a CPA.
Schools (NCES district)
- District
- Kalamazoo Public Schools
- NCES district ID
- 2619950
- Math proficiency
- 43% ▲ 13.00%
- Reading proficiency
- 72% ▲ 33.00%
- Median HH income
- $35,291
- Composite
- 47.48/100
- National rank
- #2275
- State rank
- #71 of 540 in MI
Livability — Kalamazoo
- Score
- 76/100
- State rank
- #141
- US rank
- #3492
Category grades
Schools grade is shown separately in the Schools card above.
Census & demographics
- Census place
- Kalamazoo, MI
- County
- Kalamazoo County · 224,317 people
- City population
- 121,397
- Metro
- Kalamazoo-Portage, MI
- Population (ZIP)
- 20,946
- Household income
- $56,432
- Rent vs Own
- Severe rent burden
- 1184.0
Population outlook (Kalamazoo County) Hauer SSP2
- Today (2025)
- 280,982 people
- By 2030
- 292,068 · +3.9%
- By 2040
- 312,191 · +11.1%
- By 2050
- 331,196 · +17.9%
- By 2075
- 379,021 · +34.9%
- By 2100
- 396,579 · +41.1%
Race, ethnicity, and origin ACS 2023
- Neighborhood character
- Diverse neighborhood (Simpson 0.59)
- Race & ethnicity
- White 58% Black 22% Hispanic / Latino 15% Two or more races 5% Asian 2% Native American 1%
- Hispanic origin (detail)
- Mexican 13%
- Common ancestry
- Romanian 6% Iranian 4% Slovak 3%
- Foreign-born
- 9% · Canada
- Languages at home
- 84% English-only · Spanish 11% Arabic 2% Other Indo-European 1%
Political lean MEDSL · Kalamazoo
- 2024 margin
- D (+17.7) · D 58.0% · R 40.3% · Other 1.7%
- 2008→2024 swing
- -1.8pp toward R · 2008: 19.5pp · 2024: 17.7pp
- All cycles
- 2024: D+17.7 2020: D+18.7 2016: D+12.8 2012: D+13.3 2008: D+19.5
Not yet ingested
- Civics
- —
Market trends
- HPI YoY
- ▼ -264.90%
- Current HPI
- 206.9355
- Rent YoY
- ▲ 6.41%
- Metro
- Kalamazoo-Portage, MI
- State GDP YoY
- ▲ 1.37%
- F500 in state
- 28
Industry mix (Fortune 500 HQ in MI)
| Industry | F500 HQs | Revenue |
|---|---|---|
| Automotive Parts | 3 | $48B |
|
||
| Automotive | 2 | $372B |
|
||
| Chemicals | 1 | $45B |
|
||
| Automotive Retail | 1 | $29B |
|
||
| Healthcare / Medical Devices | 1 | $23B |
|
||
| Automotive Technology | 1 | $20B |
|
||
Price history
+85.4% since first listed24 events — show timeline
- 2026-05-04 Listed $64,900 SW Michigan MLS
- 2026-05-04 Listed $64,900 REALCOMP
- 2026-05-04 Listed $64,900 MiRealSource-MiMLS
- 2016-01-15 Sold (MLS) $20,500 SW Michigan MLS
- 2016-01-15 Sold (MLS) $20,500 REALCOMP
- 2015-12-22 Pending — SW Michigan MLS
- 2015-11-17 Listed $20,600 SW Michigan MLS
- 2015-11-17 Listed $20,600 REALCOMP
- 2014-09-15 Listing Removed — SW Michigan MLS
- 2000-03-15 Sold (MLS) $58,700 REALCOMP
- 2000-03-15 Sold (MLS) $58,700 SW Michigan MLS
- 2000-01-01 Listed $59,900 REALCOMP
- 2000-01-01 Listed $59,900 SW Michigan MLS
- 1999-11-30 Listing Removed — REALCOMP
- 1999-08-10 Listed $59,900 REALCOMP
- 1999-08-10 Listed $59,900 SW Michigan MLS
- 1997-03-14 Sold (MLS) $43,000 REALCOMP
- 1997-03-14 Sold (MLS) $43,000 SW Michigan MLS
- 1997-02-06 Listed $43,000 REALCOMP
- 1997-02-06 Listed $43,000 SW Michigan MLS
- 1995-04-07 Sold (MLS) $31,500 REALCOMP
- 1995-04-07 Sold (MLS) $31,500 SW Michigan MLS
- 1994-06-20 Listed $35,000 REALCOMP
- 1994-06-20 Listed $35,000 SW Michigan MLS
Property tax history
+9.9%/yrLatest (2025): $3,262 · +5.4% YoY. Source: county tax records.
Cash-flow waterfall
monthlySold comps — $/sqft
last 12 mo · ≤1 miLoading sold comps…