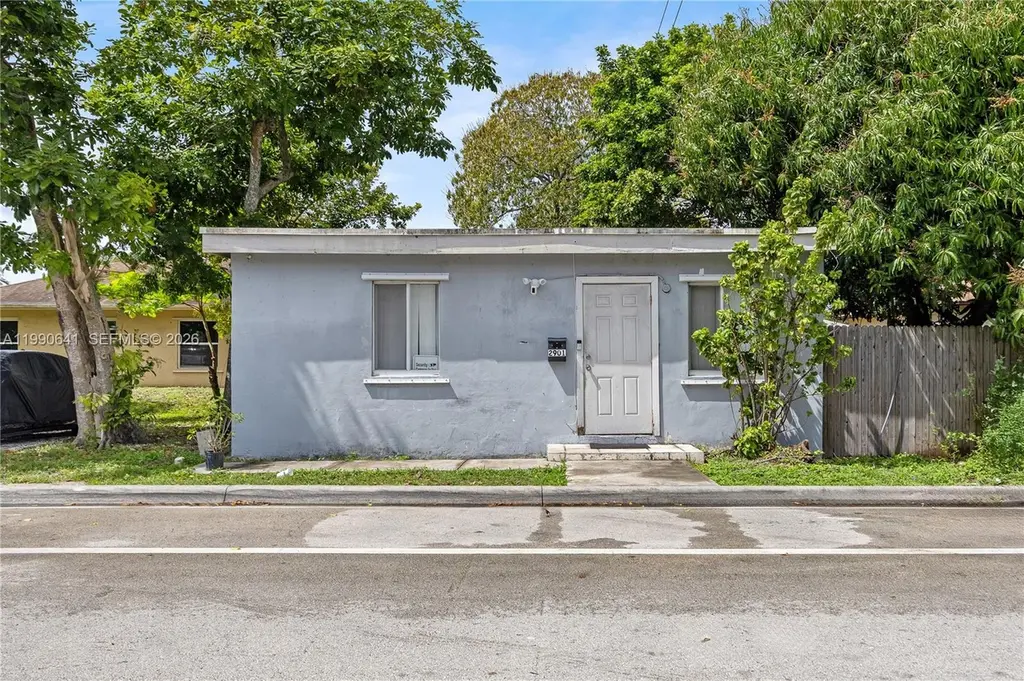
2901 NW 9th Ct · Washington Park, FL
Flood risk 3/10 · Minor
- FEMA flood zone
- X (shaded)
- Chance of flooding over 30 yrs
- 0.2%
- Est. flood insurance / yr
- $507 – $1,088
Fire risk 1/10 · Minimal
- Est. fire insurance / yr
- $947 – $1,759
Heat risk 10/10 · Severe
- Hot days now (above 105°F)
- 7 days/yr
- Hot days in 30 yrs
- 27 days/yr
Wind risk 10/10 · Severe
- Chance of severe wind over 30 yrs
- 99.0%
Air-quality risk 2/10 · Minimal
- Unhealthy air days now
- 2 days/yr
- Unhealthy air days in 30 yrs
- 2 days/yr
Risk factors via First Street. Map © Google.
Why this score? — see what drove the D+ grade
The composite is a weighted blend of 9 inputs, each scored 0–100. Each bar is that input's sub-score; the figure is the points it added to the 100-point composite (weight × sub-score).
- ARV discount +15.0/15.0
- Cash flow +12.5/30.0
- Schools +4.1/10.0
- Livability +3.9/5.0
- DSCR +3.7/10.0
- 1% rule +3.3/10.0
- Rent growth +3.2/5.0
- Condition / age +2.5/5.0
- Appreciation +0.0/10.0
$269,999
🖨 Deal sheet (PDF) 📄 Offer letter ✓ Due diligence
Listing remarks
Welcome to this quaint and sweet home! Property has 2 bedrooms and 1 bathroom - perfect for a first time home buyer, investor, or someone who would like to own their own property at an affordable price! property has been well maintained by the current tenants and is in great condition. Property also offers a large backyard and if fenced in it can be used as additional space to host friends and family and make it your own oasis. Roof is from 2016. Electrical from 2017. Full 3D walk-through video available upon request. PLEASE NOTE - I am not available on the Sabbath/saturdays PLEASE CONTACT 2ND AGENT ON THE LISTING (NICOLE)
Key facts
- Electrical from 2017
- Fenced in
- Large backyard
Tags
Property features AI
Exterior
- Parking: On-street parking; Unpaved parking
- Utilities: Public water; Public sewer
- Home design: Single-story; Faces east
- Construction: Block construction; Flat roof; Effective year built
- Exterior features: No notable exterior features listed; Less than quarter acre lot
Interior
- Kitchen: Electric range; Microwave; Refrigerator
- Flooring: Hardwood; Tile; Wood
- Bathrooms: 1 full bathroom
- Heating & cooling: Central heating; Central air conditioning
- Interior features: Bedroom on main level; First-floor entry
- Laundry & utility: Washer hookup; Dryer hookup
Neighborhood map
What this means for you Summary
Snapshot
- This is a 2-bed/1.0-bath single-family listed at $270k.
Deal economics
- At list price, monthly cash flow is $-37 ($-450/yr) — negative.
- To cash-flow at today's rent, offer at most $263k (2.5% below list).
- To meet the 1% rule (rent ≥ 1% of price), the offer needs to be $223k (17.3% below list).
- Recommended offer: $223k (17.3% below list) — sets the bar for 1% rule.
Location & tenants
- Location reads 78/100 on livability (#164 in FL, #2,458 nationally) — a middle-class / working-renter tenant base. Strengths: crime A+, health & safety A+, commute A-; Watch: amenities F, employment F.
- Broward (suburban): math 42% / reading 53% proficiency, ranked #46 of 73 in FL (top 63%) — families likely to look elsewhere, expect single-tenant / working-renter base with shorter leases.
- Zoned schools: Nova Blanche Forman Elementary (math 35% / reading 55%, grade D-, #1,271 of 2,144 statewide, top 60%, 769 students, 72% FRL); Nova Middle School (math 44% / reading 53%, grade C-, #274 of 571 statewide, top 50%, 1,284 students, 68% FRL); Nova High School (math 22% / reading 56%, grade F, #312 of 667 statewide, top 48%, 2,227 students, 59% FRL) — zoned schools average 66% FRL vs 51% district-wide (15 pts higher); higher-poverty schools than district average — tighter screening recommended.
- Market conditions: Rents rising (+2.8%/yr); 590 active listings in the ZIP; 40 comparable units currently listed for rent nearby; rentals at typical pace (median 23d on market — plan ~3-4 weeks tenant-placement turnaround); 2,111 units permitted in Broward County in 2024 (1,265 in 5+ unit buildings).
- At $2,232/mo this rent would consume 50% of the median local household income ($54k/yr) (locally 5068% of renters already pay >50% of income on rent) — very limited rent-growth headroom before tenants either downsize or default.
Forward outlook
- Local home prices are declining (-3.0%/yr); year-one equity from $2k of loan paydown is wiped out by about $8k of value loss. Plan a longer hold.
- Broward County population projected at +34% by 2050 — long-run rental-demand tailwind backs the buy-and-hold thesis.
Negotiation context
- It's been on market 81 days — a 6% lower offer ($254k) is reasonable based on typical stale-listing flexibility.
- 5 sale attempts since 10y ago with the ask held roughly flat each time — persistent listings suggest the price (not the market) is what's stuck; bring a comps-based counter.
Risks & watch-outs
- Watch-outs: built in 1954 — expect roof / HVAC / electrical / plumbing capex.
- Climate carrying-cost: severe wind risk, 99% chance of damaging wind over 30y; extreme-heat days projected 7→27/yr by 2055 (HVAC capex compounding) — expect insurance premiums to compound above CPI over the hold.
Questions for the listing agent
- What do current leases actually rent for vs. the listed asking? Can we see a recent rent roll and the last 12 months of T-12 income?
- It's been on market 81 days. Have you received any prior offers? Is the seller open to a 17% concession, seller financing, or rate buy-down credit?
- Built in 1954 — when were the roof, HVAC, electrical panel, plumbing, and water heater last replaced?
- Why hasn't it sold? Are there any deal-killer items the seller is aware of (foundation, flood, title, zoning, code violations)?
- Is there a deadline driving the sale (1031 exchange, divorce, estate, relocation)? That informs how much negotiation room exists.
- Schools are B-rated — typically a magnet for longer-tenancy family renters. What's the average tenant stay here, and is there a school-zone premium baked into asking?
- The area grade is low — what's the realistic commute time and amenity access for the typical tenant pool here? Any planned neighborhood developments (good or bad) we should know about?
- What's the average days-on-market for RENTAL listings here right now (not sales)? A rising rental-DOM trend means longer vacancies and softer asking-rent achievability than the comps imply.
- What's the recent tenant-quality profile in this submarket — average credit score on applications, eviction rate, late-payment / NSF rate, and stable-employment percentage? A property-management company in the area should have these aggregated.
- How much new for-sale + rental construction is in the pipeline within 1–3 miles? Heavy new supply typically softens prices + rents 12–24 months out; constrained supply supports both.
Investment metrics
- 1% rule
- 0.83% ✗
- Cap rate
- 6.13%
- Cash-on-cash
- -0.60%
- DSCR
- 0.97
- GRM
- 10.1
CMA / ARV
- ARV (on-the-fly)
- $341,952
- Comps found
- 3
Show comp detail 3 sales within ~0.75 mi
| Address | Dist | Beds/Ba | Sqft | Sold | Price | $/sf | Match |
|---|---|---|---|---|---|---|---|
| 2720 NW 9th Pl | 0.28mi | 2/1.0 | 728 (-12%) | 12mo | $331,000 | $455 | 56 |
| 841 NW 33 Ter | 0.43mi | 2/1.0 | 752 (-10%) | 9mo | $309,000 | $411 | 56 |
| 2537 NW 9th Ct | 0.51mi | 3/1.0 (+1) | 922 (+11%) | 17mo | $294,000 | $319 | 39 |
Match score weights: distance 35% · size 25% · config 20% · recency 20%. Top-matched comps best support the ARV.
Projected returns pro-forma
-3.0% appreciation · 2.78% rent growth · sell at horizon
- IRR
- -17.5%
- Equity multiple
- 0.38×
- Total profit
- $-46,639
- Equity at exit
- $40,258
- IRR
- -10.0%
- Equity multiple
- 0.40×
- Total profit
- $-45,728
- Equity at exit
- $23,345
Cash invested: $75,600 (down + closing). Projections, not guarantees.
Landlord ↔ Tenant lean methodology
- Overall (STATE)
- 87 Strongly Landlord-Friendly
- State Florida
- 87 Strongly Landlord-Friendly · R+3
- County
- — inherits STATE
- City
- — inherits STATE
ZIP-level market 33311
- Rents YoY
- 2.8%
- Active inventory
- 590
- Price-to-rent
- 10.1×
Monthly cashflow live
- Estimated rent
- $2,232 high interval (Pro) →
- Mortgage (P&I)
- −$1,416
- Tax from tax record
- −$272 /mo · $3,265/yr
- Insurance
- −$112
- HOA
- −$0
- Vacancy / Maint / Mgmt
- −$469
- Net cashflow
- $-37
Break-even live
Sensitivity live
| Price | -10% $115 | -5% $39 | +0% $-37 | +5% $-114 | +10% $-190 |
|---|---|---|---|---|---|
| Rent | -10% $-214 | -5% $-126 | +0% $-37 | +5% $51 | +10% $139 |
| Rate | -1.0pp $98 | -0.5pp $31 | base $-37 | +0.5pp $-107 | +1.0pp $-179 |
UW: 25.0% down · 7.5% · 30yr · 1.5% tax · 5.0% vac · 8.0% maint · 8.0% mgmt
Financing live
Cash to close
- Down payment
- $67,500
- Closing costs
- $8,100
- Reserves months
- —
- Total cash needed
- —
Loan-product check · same deal, 3 products live
Conventional
25% down · 7.5% · 30yr
- Down + closing
- —
- Monthly P&I
- —
- Monthly cashflow
- —
- DSCR
- —
- Eligible?
- —
Personal DTI + credit; lowest rate.
DSCR
20% down · 8.5% · 30yr
- Down + closing
- —
- Monthly P&I
- —
- Monthly cashflow
- —
- DSCR
- —
- Eligible?
- —
No personal income docs; deal must DSCR.
Hard money
10% down · 12.0% · 12mo
- Down + closing
- —
- Monthly P&I
- —
- Monthly cashflow
- —
- DSCR
- —
- Eligible?
- —
Short-term bridge; refi at stabilization.
Rent comps 40 comps
| Address | Beds | Baths | Sqft | Rent | $/sqft | DOM | Units | Dist |
|---|---|---|---|---|---|---|---|---|
| 3025 NW 8th Rd Fort Lauderdale, FL | 3.0 | 1.0 | 947 | $2,520 | $2.66 | 26d | 1 | 0.17mi |
| 2941 NW 11th Ct Fort Lauderdale, FL | 3.0 | 1.0 | 968 | $2,200 | $2.27 | 26d | 1 | 0.26mi |
| 721 NW 33rd Ave Lauderhill, FL | 3.0 | 2.0 | 874 | $2,750 | $3.15 | 6d | 1 | 0.43mi |
| 2724 NW 6th Ct Unit 4 Fort Lauderdale, FL | 1.0 | 1.0 | 550 | $1,349 | $2.45 | 15d | 1 | 0.50mi |
| 2724 NW 6th Ct Unit 1 Fort Lauderdale, FL | 1.0 | 1.0 | 550 | $1,299 | $2.36 | 4d | 1 | 0.50mi |
| 2500 NW 9th Ct Fort Lauderdale, FL | 3.0 | 2.0 | 780 | $2,375 | $3.04 | 22d | 1 | 0.57mi |
| 2231 NW 9th Pl Unit H Fort Lauderdale, FL | 3.0 | 2.0 | 864 | $2,700 | $3.12 | 12d | 1 | 0.67mi |
| 2571 NW 13th Ct Unit 3 Fort Lauderdale, FL | 2.0 | 1.0 | 700 | $1,600 | $2.29 | 26d | 1 | 0.69mi |
| 2571 NW 13th Ct Unit C Fort Lauderdale, FL | 2.0 | 1.0 | 700 | $1,600 | $2.29 | 22d | 1 | 0.69mi |
| 2708 NW 15th St Fort Lauderdale, FL | 2.0 | 1.0 | 750 | $1,700 | $2.27 | 26d | 1 | 0.70mi |
| 2620 NW 14th Ct Unit 2620 Fort Lauderdale, FL | 3.0 | 2.0 | 1080 | $2,900 | $2.69 | 4d | 1 | 0.72mi |
| 2791 NW 15th Ct Unit B Fort Lauderdale, FL | 3.0 | 2.0 | 1020 | $2,450 | $2.40 | 26d | 1 | 0.74mi |
| 2451 NW 13th Ct Fort Lauderdale, FL | 2.0 | 1.0 | 600 | $1,650 | $2.75 | 26d | 1 | 0.76mi |
| 280 NW 31st Ave Fort Lauderdale, FL | 3.0 | 2.0 | 884 | $2,700 | $3.05 | 19d | 1 | 0.77mi |
| 1040 NW 23rd Ter Fort Lauderdale, FL | 3.0 | 1.0 | 900 | $2,550 | $2.83 | 26d | 1 | 0.77mi |
| 2330 NW 13th St Fort Lauderdale, FL | 2.0 | 1.0 | 750 | $2,700 | $3.60 | 26d | 1 | 0.81mi |
| 3429 NW 13th St Fort Lauderdale, FL | 3.0 | 2.5 | 1120 | $2,595 | $2.32 | 26d | 1 | 0.82mi |
| 500 NW 24th Ave Apt 27 Fort Lauderdale, FL | 2.0 | 1.0 | 660 | $1,850 | $2.80 | 26d | 1 | 0.82mi |
| 661 NW 21st Ter Unit 2 Fort Lauderdale, FL | 2.0 | 1.0 | 670 | $1,800 | $2.69 | 19d | 1 | 0.83mi |
| 2349 NW 13th Ct Unit 2349 Fort Lauderdale, FL | 2.0 | 1.0 | 572 | $1,750 | $3.06 | 26d | 1 | 0.83mi |
| 1436 NW 24th Ter Fort Lauderdale, FL | 3.0 | 1.0 | 992 | $2,500 | $2.52 | 26d | 1 | 0.85mi |
| 3484 NW 13th St Fort Lauderdale, FL | 2.0 | 2.5 | 1120 | $2,100 | $1.88 | 26d | 1 | 0.85mi |
| 101 NW 29th Ave #4 Fort Lauderdale, FL | 1.0 | 1.0 | 600 | $1,350 | $2.25 | 26d | 1 | 0.89mi |
| 3507 NW 13th St Unit 3507 Lauderhill, FL | 2.0 | 2.5 | 1120 | $2,450 | $2.19 | 7d | 1 | 0.90mi |
| 3021 NW 17th St Fort Lauderdale, FL | 2.0 | 1.0 | 910 | $1,375 | $1.51 | 0d | 1 | 0.94mi |
| 2530 NW 17th St Fort Lauderdale, FL | 1.0 | 1.0 | 1071 | $985 | $0.92 | 26d | 1 | 0.99mi |
| 2850 SW 1st St Unit 4 Fort Lauderdale, FL | 1.0 | 1.0 | 650 | $1,550 | $2.38 | 6d | 1 | 1.02mi |
| 2781 SW 2nd St Unit 1 Fort Lauderdale, FL | 1.0 | 1.0 | 700 | $1,595 | $2.28 | 16d | 1 | 1.05mi |
| 1770 NW 25th Ter Fort Lauderdale, FL | 2.0 | 1.0 | 720 | $2,000 | $2.78 | 0d | 1 | 1.09mi |
| 1816 NW 25th Ter Unit 1 Fort Lauderdale, FL | 2.0 | 1.0 | 1100 | $2,500 | $2.27 | 22d | 1 | 1.12mi |
| 3048 NW 20th St Unit n/a Fort Lauderdale, FL | 3.0 | 2.0 | 1107 | $2,800 | $2.53 | 26d | 1 | 1.14mi |
| 600 NW 18th Ave Unit E Fort Lauderdale, FL | 2.0 | 2.0 | 1100 | $2,400 | $2.18 | 26d | 1 | 1.18mi |
| 2040 NW 29th Ter Unit 2040 Fort Lauderdale, FL | 2.0 | 1.0 | 916 | $2,400 | $2.62 | 9d | 1 | 1.21mi |
| 2040 NW 29th Ter Unit 2040 Fort Lauderdale, FL | 2.0 | 1.0 | 916 | $2,600 | $2.84 | 16d | 1 | 1.21mi |
| 439-441 NW 18th Ave Fort Lauderdale, FL | 3.0 | 1.0 | 900 | $2,200 | $2.44 | 17d | 1 | 1.25mi |
| 101 SW 22nd Ave Fort Lauderdale, FL | 3.0 | 2.0 | 1010 | $7,500 | $7.43 | 18d | 1 | 1.25mi |
| 2740 NW 21st St Unit 1261589P Fort Lauderdale, FL | 3.0 | 2.0 | 1097 | $3,396 | $3.10 | 26d | 1 | 1.27mi |
| 420 SW 27th Ave Fort Lauderdale, FL | 3.0 | 1.0–2.0 | 1024 | $3,146 | $3.07 | 26d | 1 | 1.32mi |
| 1196 NW 40th Ave Lauderhill, FL | 1.0–2.0 | 1.0 | 825 | $1,879 | $2.28 | 3d | 10 | 1.32mi |
| 2611 NW 21st St Fort Lauderdale, FL | 3.0 | 1.0 | 880 | $2,590 | $2.94 | 3d | 1 | 1.32mi |
Listing history 31 events
-
2026-06-21remarks 630-char remark
-
2026-06-21days on market $269,999 Active 81 DOM
-
2026-06-18days on market $269,999 Active 78 DOM
-
2026-06-17days on market $269,999 Active 77 DOM
-
2026-06-16days on market $269,999 Active 76 DOM
-
2026-06-15days on market $269,999 Active 75 DOM
-
2026-06-13days on market $269,999 Active 73 DOM
-
2026-06-09days on market $269,999 Active 69 DOM
-
2026-06-08days on market $269,999 Active 68 DOM
-
2026-06-07days on market $269,999 Active 67 DOM
-
2026-06-04days on market $269,999 Active 64 DOM
-
2026-06-03days on market $269,999 Active 63 DOM
-
2026-06-02days on market $269,999 Active 62 DOM
-
2026-06-01days on market $269,999 Active 61 DOM
-
2026-05-31days on market $269,999 Active 60 DOM
-
2026-05-19price $269,999
-
2026-04-28price $276,999
-
2026-04-08status Active
-
2026-04-03status Pending
-
2026-03-27$279,999 Active
-
2017-09-01status Pending
-
2017-09-01historical
-
2017-08-14status Active
-
2017-07-30status Backup Contract
-
2017-07-12$145,000 Active
-
2016-06-03historical
-
2016-05-16price $47,500
-
2016-04-25price $48,995
-
2016-04-14price $49,000
-
2016-03-17price $53,000
-
2016-02-25$58,770 Active
ⓘ Source: listings_history table (triggers on properties + properties_extension) + one-shot
backfill from property_details.listing_events for pre-trigger history.
Tax reassessment forecast FL · Resets to sale price
- Current annual tax
- $3,265 · $272/mo
- Projected year-2 tax
- $3,265 · $272/mo
- Expected delta
- $0/yr ($0/mo · 0.0%)
ⓘ Screening estimate from a state-policy table — verify with the county assessor before closing.
Climate risk First Street
- Flood 3/10 Moderate FEMA zone X (shaded) · 20% chance over 30 yrs
- Wildfire 1/10 Low
- Heat 10/10 Extreme 7 d/yr ≥105°F today · 27 d/yr by 30 yrs out
- Wind 10/10 Extreme 99% chance of damaging wind over 30 yrs
- Air quality 2/10 Low 2 unhealthy d/yr today · 2 by 30 yrs out
Nearby sold comps map
Loading sold comps map…
Walkable amenities ~0.75 mi
Loading nearby amenities…
Taxation est. · year 1
- Rental income
- $26,780
- − Mortgage interest
- −$15,124
- − Property taxes
- −$3,265
- − Insurance
- −$1,350
- − Repairs & maintenance
- −$2,142
- − Management
- −$2,142
- − Depreciation
- −$7,855
- Taxable loss
- −$5,099
- Est. tax savings @ 24.0%
- +$1,224
- After-tax cash flow
- $774/yr
For passive investors: Depreciation is non-cash, so a rental often shows a tax loss while cash-flowing — sheltering income. Rental losses are passive: they offset passive income freely, and up to $25,000/yr can offset ordinary (W-2) income if you actively participate and your MAGI is under $100k (phasing out to $0 by $150k); unused losses carry forward. On sale, claimed depreciation is recaptured at up to 25%, and gains may owe capital-gains tax (a 1031 exchange can defer both). Figures are a year-1 estimate at your 24.0% rate — not tax advice; consult a CPA.
Schools (NCES district)
- District
- Broward
- NCES district ID
- 1200180
- Math proficiency
- 42% ▼ -18.00%
- Reading proficiency
- 53% ▼ -5.00%
- Median HH income
- $52,139
- Composite
- 40.88/100
- National rank
- #3621
- State rank
- #46 of 73 in FL
Livability — Washington Park
- Score
- 78/100
- State rank
- #164
- US rank
- #2458
Category grades
Schools grade is shown separately in the Schools card above.
Census & demographics
- Census place
- Washington Park, FL
- County
- Broward County · 1,963,430 people
- Metro
- Miami-Fort Lauderdale-Pompano Beach, FL
- Population (ZIP)
- 74,898
- Household income
- $53,973
- Rent vs Own
- Severe rent burden
- 5068.0
Population outlook (Broward County) Hauer SSP2
- Today (2025)
- 2,207,033 people
- By 2030
- 2,360,704 · +7.0%
- By 2040
- 2,661,208 · +20.6%
- By 2050
- 2,946,698 · +33.5%
- By 2075
- 3,602,273 · +63.2%
- By 2100
- 3,970,984 · +79.9%
Race, ethnicity, and origin ACS 2023
- Neighborhood character
- Predominantly Black (77%)
- Race & ethnicity
- Black 77% Two or more races 9% White 9% Hispanic / Latino 9%
- Hispanic origin (detail)
- Mexican 1% Puerto Rican 2% Cuban 1%
- Common ancestry
- Hispanic 15% Lithuanian 1% Romanian 0%
- Foreign-born
- 24% · Canada, Jamaica
- Languages at home
- 78% English-only · French/Haitian/Cajun 14% Spanish 6% Other Indo-European 1%
Political lean MEDSL · Broward
- 2024 margin
- D (+17.0) · D 58.0% · R 41.0%
- 2008→2024 swing
- -17.8pp toward R · 2008: 34.7pp · 2024: 17.0pp
- All cycles
- 2024: D+17.0 2020: D+29.8 2016: D+35.0 2012: D+34.9 2008: D+34.7
Not yet ingested
- Civics
- —
Market trends
- HPI YoY
- ▼ -300.68%
- Current HPI
- 535.2504
- Rent YoY
- ▲ 2.78%
- Metro
- Miami-Fort Lauderdale-Pompano Beach, FL
- State GDP YoY
- ▲ 3.28%
- F500 in state
- 36
Industry mix (Fortune 500 HQ in FL)
| Industry | F500 HQs | Revenue |
|---|---|---|
| Industrial Technology | 2 | $29B |
|
||
| Insurance | 2 | $17B |
|
||
| Retail | 1 | $60B |
|
||
| Technology Distribution | 1 | $58B |
|
||
| Homebuilding | 1 | $35B |
|
||
| Technology Manufacturing | 1 | $35B |
|
||
Price history
+359.4% since first listed16 events — show timeline
- 2026-05-19 Price Changed $269,999 MARMLS
- 2026-04-28 Price Changed $276,999 MARMLS
- 2026-04-08 Relisted — MARMLS
- 2026-04-03 Pending — MARMLS
- 2026-03-27 Listed $279,999 MARMLS
- 2017-09-01 Pending — MARMLS
- 2017-09-01 Listing Removed — MARMLS
- 2017-08-14 Relisted — MARMLS
- 2017-07-30 Pending — MARMLS
- 2017-07-12 Listed $145,000 MARMLS
- 2016-06-03 Listing Removed — MARMLS
- 2016-05-16 Price Changed $47,500 MARMLS
- 2016-04-25 Price Changed $48,995 MARMLS
- 2016-04-14 Price Changed $49,000 MARMLS
- 2016-03-17 Price Changed $53,000 MARMLS
- 2016-02-25 Listed $58,770 MARMLS
Property tax history
+7.3%/yrLatest (2025): $3,265 · +11.6% YoY. Source: county tax records.
Cash-flow waterfall
monthlySold comps — $/sqft
last 12 mo · ≤1 miLoading sold comps…