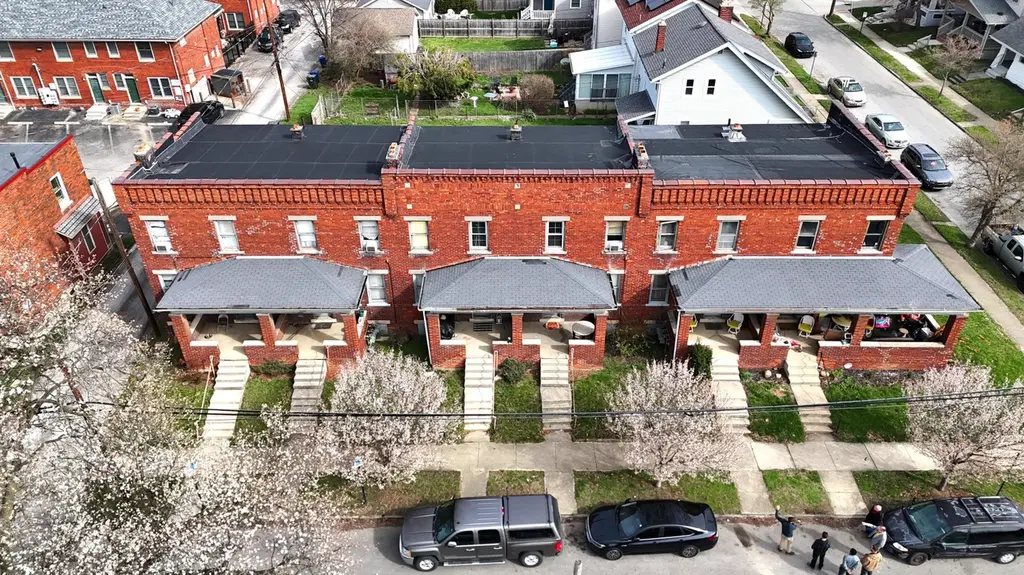
300-310 E 9th Ave · Columbus, OH
Flood risk 1/10 · Minimal
- FEMA flood zone
- X (unshaded)
- Chance of flooding over 30 yrs
- 0.0%
- Est. flood insurance / yr
- $473 – $860
Fire risk 1/10 · Minimal
- Est. fire insurance / yr
- $713 – $1,323
Heat risk 4/10 · Minor
- Hot days now (above 100°F)
- 7 days/yr
- Hot days in 30 yrs
- 18 days/yr
Wind risk 2/10 · Minimal
- Chance of severe wind over 30 yrs
- 1.0%
Air-quality risk 3/10 · Minor
- Unhealthy air days now
- 2 days/yr
- Unhealthy air days in 30 yrs
- 4 days/yr
Risk factors via First Street. Map © Google.
Why this score? — see what drove the F grade
The composite is a weighted blend of 9 inputs, each scored 0–100. Each bar is that input's sub-score; the figure is the points it added to the 100-point composite (weight × sub-score).
- Livability +4.0/5.0
- Rent growth +3.0/5.0
- Condition / age +2.5/5.0
- Schools +1.7/10.0
- Cash flow +0.3/30.0
- 1% rule +0.0/10.0
- DSCR +0.0/10.0
- ARV discount +0.0/15.0
- Appreciation +0.0/10.0
$699,000
🖨 Deal sheet 📄 Offer letter ✓ Due diligence
Listing remarks MLS
• Six-Unit Townhome Apartment Building • Two-Bedrooms Each Fully Leased • ±6,452 Square Feet Total Across Entire The Building • Do Not Disturb Tenants • Close Proximity, and Within Walkable Distance, Not Only to The Ohio State University or The Historic Crew Stadium, but also The Ohio State Fairgrounds • ± 0.8 Miles From Interstate-71 Northbound and Southbound, Connecting to Downtown Columbus, I-270, and the Surrounding Area * Curb Offers Only
Key facts
- Fully leased
- Built 1920
- Listed 90 days
Tags
Neighborhood map
What this means for you Summary
Snapshot
- This is a townhouse listed at $699k.
Deal economics
- At list price, monthly cash flow is $-3k ($-37k/yr) — negative.
- To cash-flow at today's rent, offer at most $153k (78.2% below list).
- To meet the 1% rule (rent ≥ 1% of price), the offer needs to be $155k (77.9% below list).
- Recommended offer: $153k (78.2% below list) — sets the bar for cash-flow.
- Cap rate 1.0% vs local median 3.8% in Columbus — below-typical yield; the buyer is paying a premium for something (appreciation thesis, condition, location) that the cap rate doesn't capture.
Location & tenants
- Location reads 81/100 on livability (#97 in OH, #1,491 nationally) — a professional / high-income tenant draw. Strengths: commute A+, cost of living A+, housing A+; Watch: employment C-, crime F.
- Columbus City School District (urban): math 15% / reading 26% proficiency, ranked #626 of 656 in OH (top 95%) — low school quality limits family demand, transient renter base, plan for 1-2y turnover; 72% free/reduced lunch — lower-income household profile, screen leases tightly.
- Market conditions: Rents rising (+2.1%/yr); 136 active listings in the ZIP; lower-income renter base — watch delinquency; 8,139 units permitted in Franklin County in 2024 (5,940 in 5+ unit buildings).
- This rent runs 42% of the median local income ($44k/yr) — at the standard rent-burdened threshold; future hikes will face affordability resistance.
Forward outlook
- Local home prices are declining (-3.0%/yr); year-one equity from $5k of loan paydown is wiped out by about $21k of value loss. Plan a longer hold.
- Franklin County population projected at +34% by 2050 — long-run rental-demand tailwind backs the buy-and-hold thesis.
Negotiation context
- It's been on market 90 days — a 6% lower offer ($657k) is reasonable based on typical stale-listing flexibility.
- 3 sale attempts since 25y ago with the ask held roughly flat each time — persistent listings suggest the price (not the market) is what's stuck; bring a comps-based counter.
- Current owner paid $125k; list at $699k implies a 459% gain — meaningful room to come down on a strong offer.
Risks & watch-outs
- Watch-outs: built in 1920 — expect roof / HVAC / electrical / plumbing capex.
Questions for the listing agent
- What do current leases actually rent for vs. the listed asking? Can we see a recent rent roll and the last 12 months of T-12 income?
- It's been on market 90 days. Have you received any prior offers? Is the seller open to a 78% concession, seller financing, or rate buy-down credit?
- Built in 1920 — when were the roof, HVAC, electrical panel, plumbing, and water heater last replaced?
- Why hasn't it sold? Are there any deal-killer items the seller is aware of (foundation, flood, title, zoning, code violations)?
- Is there a deadline driving the sale (1031 exchange, divorce, estate, relocation)? That informs how much negotiation room exists.
- Crime grade is F in this area — have there been break-ins, vandalism, or insurance claims at this property in the last 3 years? What carrier currently insures it and at what premium?
- The area grade is low — what's the realistic commute time and amenity access for the typical tenant pool here? Any planned neighborhood developments (good or bad) we should know about?
- What's the average days-on-market for RENTAL listings here right now (not sales)? A rising rental-DOM trend means longer vacancies and softer asking-rent achievability than the comps imply.
- What's the recent tenant-quality profile in this submarket — average credit score on applications, eviction rate, late-payment / NSF rate, and stable-employment percentage? A property-management company in the area should have these aggregated.
- How much new for-sale + rental construction is in the pipeline within 1–3 miles? Heavy new supply typically softens prices + rents 12–24 months out; constrained supply supports both.
Investment metrics
- 1% rule
- 0.22% ✗
- Cap rate
- 0.98%
- Cash-on-cash
- -18.97%
- DSCR
- 0.16
- GRM
- 37.7
CMA / ARV
- ARV (median comp)
- $550,564
- List price
- $699,000
- Delta
- 26.96%
- Verdict
- OVERPRICED
- Comps
- 20 within 1.0 mi
Projected returns pro-forma
-3.0% appreciation · 2.14% rent growth · sell at horizon
- IRR
- -55.7%
- Equity multiple
- -0.59×
- Total profit
- $-311,911
- Equity at exit
- $104,223
- IRR
- —
- Equity multiple
- -1.72×
- Total profit
- $-531,848
- Equity at exit
- $60,437
Cash invested: $195,720 (down + closing). Projections, not guarantees.
Landlord ↔ Tenant lean methodology
- Overall (STATE)
- 73 Landlord-Friendly
- State Ohio
- 73 Landlord-Friendly · R+6
- County
- — inherits STATE
- City
- — inherits STATE
ZIP-level market 43201
- Rents YoY
- 2.1%
- Active inventory
- 136
- Price-to-rent
- 37.7×
Monthly cashflow live
- Estimated rent
- $1,546 medium interval (Pro) →
- Mortgage (P&I)
- −$3,666
- Tax from tax record
- −$358 /mo · $4,292/yr
- Insurance
- −$291
- HOA
- −$0
- Vacancy / Maint / Mgmt
- −$325
- Net cashflow
- $-3,093
Break-even live
UW: 25.0% down · 7.5% · 30yr · 1.5% tax · 5.0% vac · 8.0% maint · 8.0% mgmt
Financing live
Cash to close
- Down payment
- $174,750
- Closing costs
- $20,970
- Reserves months
- —
- Total cash needed
- —
Loan-product check · same deal, 3 products live
Conventional
25% down · 7.5% · 30yr
- Down + closing
- —
- Monthly P&I
- —
- Monthly cashflow
- —
- DSCR
- —
- Eligible?
- —
Personal DTI + credit; lowest rate.
DSCR
20% down · 8.5% · 30yr
- Down + closing
- —
- Monthly P&I
- —
- Monthly cashflow
- —
- DSCR
- —
- Eligible?
- —
No personal income docs; deal must DSCR.
Hard money
10% down · 12.0% · 12mo
- Down + closing
- —
- Monthly P&I
- —
- Monthly cashflow
- —
- DSCR
- —
- Eligible?
- —
Short-term bridge; refi at stabilization.
Listing history 20 events
-
2026-06-18days on market $699,000 Active 90 DOM
-
2026-06-17days on market $699,000 Active 89 DOM
-
2026-06-16days on market $699,000 Active 88 DOM
-
2026-06-15days on market $699,000 Active 87 DOM
-
2026-06-13days on market $699,000 Active 85 DOM
-
2026-06-13days on market $699,000 Active 84 DOM
-
2026-06-09days on market $699,000 Active 81 DOM
-
2026-06-08days on market $699,000 Active 80 DOM
-
2026-06-07days on market $699,000 Active 79 DOM
-
2026-06-05days on market $699,000 Active 76 DOM
-
2026-06-03days on market $699,000 Active 75 DOM
-
2026-06-02days on market $699,000 Active 74 DOM
-
2026-06-01days on market $699,000 Active 73 DOM
-
2026-05-31days on market $699,000 Active 72 DOM
-
2026-03-27status Active 501-char remark
Show marketing remark (501 chars)
• Six-Unit Townhome Apartment Building • Two-Bedrooms Each Fully Leased • ±6,452 Square Feet Total Across Entire The Building • Do Not Disturb Tenants • Close Proximity, and Within Walkable Distance, Not Only to The Ohio State University or The Historic Crew Stadium, but also The Ohio State Fairgrounds • ± 0.8 Miles From Interstate-71 Northbound and Southbound, Connecting to Downtown Columbus, I-270, and the Surrounding Area * Curb Offers Only
-
2026-03-19status Pending 501-char remark
Show marketing remark (501 chars)
• Six-Unit Townhome Apartment Building • Two-Bedrooms Each Fully Leased • ±6,452 Square Feet Total Across Entire The Building • Do Not Disturb Tenants • Close Proximity, and Within Walkable Distance, Not Only to The Ohio State University or The Historic Crew Stadium, but also The Ohio State Fairgrounds • ± 0.8 Miles From Interstate-71 Northbound and Southbound, Connecting to Downtown Columbus, I-270, and the Surrounding Area * Curb Offers Only
-
2026-03-12$699,000 Active 501-char remark
Show marketing remark (501 chars)
• Six-Unit Townhome Apartment Building • Two-Bedrooms Each Fully Leased • ±6,452 Square Feet Total Across Entire The Building • Do Not Disturb Tenants • Close Proximity, and Within Walkable Distance, Not Only to The Ohio State University or The Historic Crew Stadium, but also The Ohio State Fairgrounds • ± 0.8 Miles From Interstate-71 Northbound and Southbound, Connecting to Downtown Columbus, I-270, and the Surrounding Area * Curb Offers Only
-
2004-08-16soldstatus $125,000
-
2002-08-31historical
-
2001-05-07$165,000
ⓘ Source: listings_history table (triggers on properties + properties_extension) + one-shot
backfill from property_details.listing_events for pre-trigger history.
Tax reassessment forecast OH · Partial reset (capped growth)
- Current annual tax
- $4,292 · $358/mo
- Projected year-2 tax
- $7,598 · $633/mo
- Expected delta
- +$3,306/yr (+$276/mo · 77.0%)
ⓘ Screening estimate from a state-policy table — verify with the county assessor before closing.
Climate risk First Street
- Flood 1/10 Low FEMA zone X (unshaded) · 0% chance over 30 yrs
- Wildfire 1/10 Low
- Heat 4/10 Moderate 7 d/yr ≥100°F today · 18 d/yr by 30 yrs out
- Wind 2/10 Low 100% chance of damaging wind over 30 yrs
- Air quality 3/10 Moderate 2 unhealthy d/yr today · 4 by 30 yrs out
Nearby sold comps map
Loading sold comps map…
Walkable amenities ~0.75 mi
Loading nearby amenities…
Taxation est. · year 1
- Rental income
- $18,548
- − Mortgage interest
- −$39,155
- − Property taxes
- −$4,292
- − Insurance
- −$3,495
- − Repairs & maintenance
- −$1,484
- − Management
- −$1,484
- − Depreciation
- −$20,335
- Taxable loss
- −$51,696
- Est. tax savings @ 24.0%
- +$12,407
- After-tax cash flow
- $-24,714/yr
For passive investors: Depreciation is non-cash, so a rental often shows a tax loss while cash-flowing — sheltering income. Rental losses are passive: they offset passive income freely, and up to $25,000/yr can offset ordinary (W-2) income if you actively participate and your MAGI is under $100k (phasing out to $0 by $150k); unused losses carry forward. On sale, claimed depreciation is recaptured at up to 25%, and gains may owe capital-gains tax (a 1031 exchange can defer both). Figures are a year-1 estimate at your 24.0% rate — not tax advice; consult a CPA.
Schools (NCES district)
- District
- Columbus City School District
- NCES district ID
- 3904380
- Math proficiency
- 15% ▼ -17.00%
- Reading proficiency
- 26% ▼ -12.00%
- Median HH income
- $38,483
- Composite
- 17.19/100
- National rank
- #9105
- State rank
- #626 of 656 in OH
Livability — Columbus
- Score
- 81/100
- State rank
- #97
- US rank
- #1491
Category grades
Schools grade is shown separately in the Schools card above.
Census & demographics
- Census place
- Columbus, OH
- County
- Franklin County · 1,351,780 people
- City population
- 612,189
- Metro
- Columbus, OH
- Population (ZIP)
- 34,322
- Household income
- $43,731
- Rent vs Own
- Severe rent burden
- 4913.0
Population outlook (Franklin County) Hauer SSP2
- Today (2025)
- 1,456,139 people
- By 2030
- 1,556,890 · +6.9%
- By 2040
- 1,757,349 · +20.7%
- By 2050
- 1,950,539 · +34.0%
- By 2075
- 2,376,171 · +63.2%
- By 2100
- 2,636,796 · +81.1%
Race, ethnicity, and origin ACS 2023
- Neighborhood character
- Predominantly White (68%)
- Race & ethnicity
- White 68% Black 14% Two or more races 8% Asian 7% Hispanic / Latino 5%
- Hispanic origin (detail)
- Mexican 1% Puerto Rican 1%
- Common ancestry
- Romanian 4% Lithuanian 2% Italian 2%
- Foreign-born
- 8% · Canada, China, Jamaica
- Languages at home
- 90% English-only · Chinese 3% Spanish 2% Other Indo-European 2%
Political lean MEDSL · Franklin
- 2024 margin
- Strong D (+28.4) · D 63.7% · R 35.3% · Other 1.0%
- 2008→2024 swing
- +7.7pp toward D · 2008: 20.7pp · 2024: 28.4pp
- All cycles
- 2024: D+28.4 2020: D+31.4 2016: D+25.9 2012: D+21.7 2008: D+20.7
Not yet ingested
- Civics
- —
Market trends
- HPI YoY
- ▼ -207.90%
- Current HPI
- 321.7282
- Rent YoY
- ▲ 2.14%
- Metro
- Columbus, OH
- State GDP YoY
- ▲ 1.98%
- F500 in state
- 48
Industry mix (Fortune 500 HQ in OH)
| Industry | F500 HQs | Revenue |
|---|---|---|
| Insurance | 3 | $145B |
|
||
| Industrial Machinery | 3 | $49B |
|
||
| Financial Services | 3 | $24B |
|
||
| Consumer Goods | 2 | $93B |
|
||
| Aerospace / Defense | 2 | $47B |
|
||
| Utilities | 2 | $33B |
|
||
Price history
+323.6% since first listed6 events — show timeline
- 2026-03-27 Relisted — CBRMLS
- 2026-03-19 Pending — CBRMLS
- 2026-03-12 Listed $699,000 CBRMLS
- 2004-08-16 Sold (Public Records) $125,000 Public Records
- 2002-08-31 Listing Removed — CBRMLS
- 2001-05-07 Listed $165,000 CBRMLS
Property tax history
-10.7%/yrLatest (2024): $4,292 · +1.6% YoY. Source: county tax records.
Cash-flow waterfall
monthlySold comps — $/sqft
last 12 mo · ≤1 miLoading sold comps…