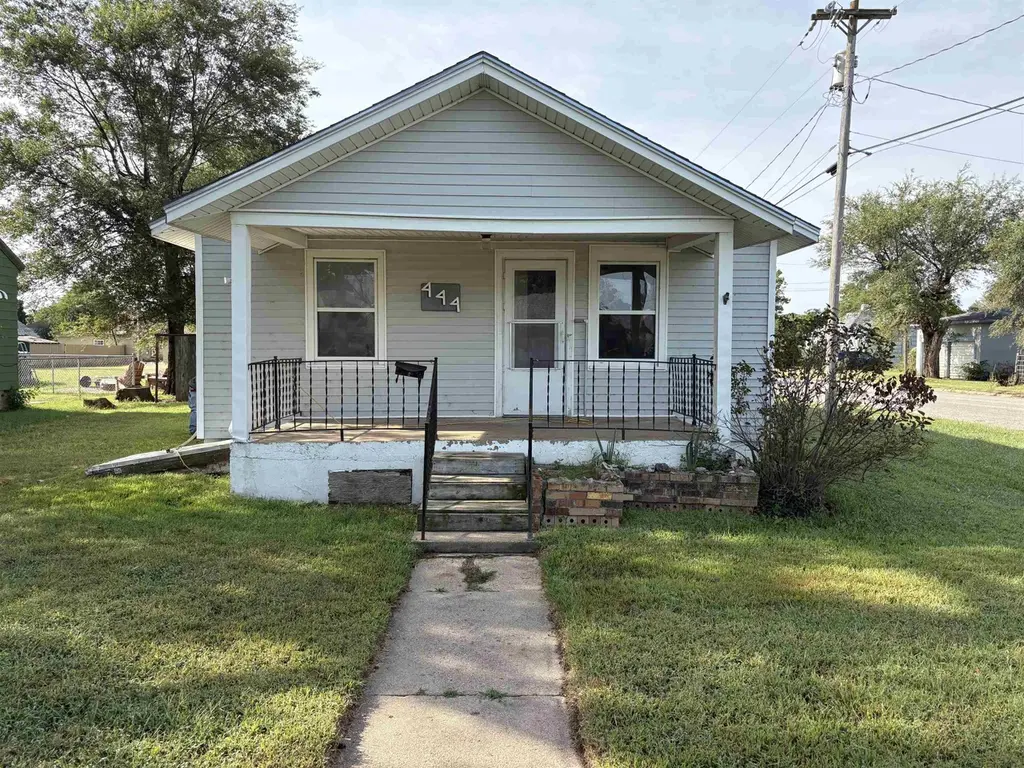
444 W 5th Ave · St. John, KS
Flood risk 1/10 · Minimal
- FEMA flood zone
- —
- Chance of flooding over 30 yrs
- 0.0%
- Est. flood insurance / yr
- —
Fire risk 4/10 · Minor
- Est. fire insurance / yr
- $1,154 – $2,142
Heat risk 5/10 · Moderate
- Hot days now (above 105°F)
- 7 days/yr
- Hot days in 30 yrs
- 17 days/yr
Wind risk 2/10 · Minimal
- Chance of severe wind over 30 yrs
- —
Air-quality risk 1/10 · Minimal
- Unhealthy air days now
- 0 days/yr
- Unhealthy air days in 30 yrs
- 0 days/yr
Risk factors via First Street. Map © Google.
Why this score? — see what drove the B grade
The composite is a weighted blend of 9 inputs, each scored 0–100. Each bar is that input's sub-score; the figure is the points it added to the 100-point composite (weight × sub-score).
- Cash flow +30.0/30.0
- 1% rule +10.0/10.0
- DSCR +10.0/10.0
- ARV discount +7.5/15.0
- Appreciation +5.0/10.0
- Schools +2.9/10.0
- Rent growth +2.5/5.0
- Livability +2.5/5.0
- Condition / age +2.5/5.0
$49,000
🖨 Deal sheet (PDF) 📄 Offer letter ✓ Due diligence
Listing remarks MLS
Are you looking for an investment property or considering downsizing? This house could be a great option for you!! It features new flooring, fresh paint, and a new hot water heater. Located on the west side of St. John, KS, in a quiet neighborhood, this home includes two bedrooms, one bathroom, and an eat-in kitchen. The large enclosed back porch serves as a utility room and offers ample storage space. Outside, you'll find a spacious backyard with a privacy fence and a detached garage. I encourage you to check it out today!!!!
Key facts
- Ample storage space
- Fresh paint
- New flooring
Tags
Property features AI
Finance
- Other: Lot dimensions approximately 134 x 50 (0.15 acres); Zoning: NC.1 / R-1
Exterior
- Parking: Attached garage with 1 garage space
- Utilities: Public water; Public sewer
- Home design: Residential property
- Construction: Composition roof
- Exterior features: Fenced yard
Interior
- Kitchen: Range; Oven; Refrigerator
- Bedrooms: 2 main-level bedrooms
- Heating & cooling: Central heating; Natural gas heating; Hot water heating; Central air conditioning
- Interior features: Window coverings; Total of 3 rooms
Neighborhood map
What this means for you Summary
Snapshot
- This is a 2-bed/1.0-bath single-family listed at $49k.
Deal economics
- At list price, monthly cash flow is $356 ($4k/yr) — positive.
- The deal already cash-flows at list — no discount required.
- Meets the 1% rule at list price ($879 rent vs $49k).
- Recommended offer: $48k (1.5% below list) — sets the bar for market timing.
Location & tenants
- Location reads: area grade B — affects rentability + tenant quality, not the cash-flow math above.
- St John-Hudson (rural): math 30% / reading 30% proficiency, ranked #165 of 280 in KS (top 59%) — families likely to look elsewhere, expect single-tenant / working-renter base with shorter leases.
- Market conditions: 10 active listings in the ZIP; 8 units permitted in Stafford County in 2024 (0 in 5+ unit buildings).
Forward outlook
- In year one you build about $2k of equity ($339 loan paydown + $1k appreciation (3.0% local appreciation)).
- Stafford County population projected at -12% by 2050 — secular population decline; favor cash flow + early exit over multi-decade hold.
- At projected returns (3.0% appreciation + 3.0% rent growth), your $14k cash investment doubles in ~3 years — after that, you're playing with house money.
Negotiation context
- It's been on market 17 days — a 2% lower offer ($48k) is reasonable based on typical stale-listing flexibility.
- 7 sale attempts since 3y ago with the ask held roughly flat each time — persistent listings suggest the price (not the market) is what's stuck; bring a comps-based counter.
- Current owner paid $15k; list at $49k implies a 227% gain — meaningful room to come down on a strong offer.
Risks & watch-outs
- Watch-outs: built in 1924 — expect roof / HVAC / electrical / plumbing capex.
- Climate carrying-cost: extreme-heat days projected 7→17/yr by 2055 (HVAC capex compounding) — expect insurance premiums to compound above CPI over the hold.
Questions for the listing agent
- Built in 1924 — when were the roof, HVAC, electrical panel, plumbing, and water heater last replaced?
- Is there a deadline driving the sale (1031 exchange, divorce, estate, relocation)? That informs how much negotiation room exists.
- What's the average days-on-market for RENTAL listings here right now (not sales)? A rising rental-DOM trend means longer vacancies and softer asking-rent achievability than the comps imply.
- What's the recent tenant-quality profile in this submarket — average credit score on applications, eviction rate, late-payment / NSF rate, and stable-employment percentage? A property-management company in the area should have these aggregated.
- How much new for-sale + rental construction is in the pipeline within 1–3 miles? Heavy new supply typically softens prices + rents 12–24 months out; constrained supply supports both.
Investment metrics
- 1% rule
- 1.79% ✓
- Cap rate
- 15.00%
- Cash-on-cash
- 31.11%
- DSCR
- 2.38
- GRM
- 4.6
CMA / ARV
No comps found within radius.
Projected returns pro-forma
3.0% appreciation · 3.0% rent growth · sell at horizon
- IRR
- 36.9%
- Equity multiple
- 3.08×
- Total profit
- $28,567
- Equity at exit
- $22,033
- IRR
- 37.0%
- Equity multiple
- 6.10×
- Total profit
- $69,978
- Equity at exit
- $33,955
Cash invested: $13,720 (down + closing). Projections, not guarantees.
Landlord ↔ Tenant lean methodology
- Overall (STATE)
- 83 Strongly Landlord-Friendly
- State Kansas
- 83 Strongly Landlord-Friendly · R+10
- County
- — inherits STATE
- City
- — inherits STATE
ZIP-level market 67576
- Active inventory
- 10
- Price-to-rent
- 4.6×
Monthly cashflow live
- Estimated rent
- $879 medium interval (Pro) →
- Mortgage (P&I)
- −$257
- Tax est. 1.5%
- −$61 /mo · $735/yr
- Insurance
- −$20
- HOA
- −$0
- Vacancy / Maint / Mgmt
- −$185
- Net cashflow
- $356
Break-even live
Sensitivity live
| Price | -10% $390 | -5% $373 | +0% $356 | +5% $339 | +10% $322 |
|---|---|---|---|---|---|
| Rent | -10% $286 | -5% $321 | +0% $356 | +5% $390 | +10% $425 |
| Rate | -1.0pp $380 | -0.5pp $368 | base $356 | +0.5pp $343 | +1.0pp $330 |
UW: 25.0% down · 7.5% · 30yr · 1.5% tax · 5.0% vac · 8.0% maint · 8.0% mgmt
Financing live
Cash to close
- Down payment
- $12,250
- Closing costs
- $1,470
- Reserves months
- —
- Total cash needed
- —
Loan-product check · same deal, 3 products live
Conventional
25% down · 7.5% · 30yr
- Down + closing
- —
- Monthly P&I
- —
- Monthly cashflow
- —
- DSCR
- —
- Eligible?
- —
Personal DTI + credit; lowest rate.
DSCR
20% down · 8.5% · 30yr
- Down + closing
- —
- Monthly P&I
- —
- Monthly cashflow
- —
- DSCR
- —
- Eligible?
- —
No personal income docs; deal must DSCR.
Hard money
10% down · 12.0% · 12mo
- Down + closing
- —
- Monthly P&I
- —
- Monthly cashflow
- —
- DSCR
- —
- Eligible?
- —
Short-term bridge; refi at stabilization.
Listing history 12 events
-
2026-06-18days on market $49,000 Active 17 DOM
-
2026-06-17days on market $49,000 Active 16 DOM
-
2026-06-16days on market $49,000 Active 15 DOM
-
2026-06-15days on market $49,000 Active 14 DOM
-
2026-06-13days on market $49,000 Active 12 DOM
-
2026-06-12days on market $49,000 Active 11 DOM
-
2026-06-09days on market $49,000 Active 8 DOM
-
2026-06-08days on market $49,000 Active 7 DOM
-
2026-06-07pricedays on market $49,000 Active 6 DOM
-
2026-06-05days on market $50,000 Active 4 DOM
-
2026-06-04days on market $50,000 Active 2 DOM
-
2026-06-02$50,000 Active 1 DOM
ⓘ Source: listings_history table (triggers on properties + properties_extension) + one-shot
backfill from property_details.listing_events for pre-trigger history.
Climate risk First Street
- Flood 1/10 Low 0% chance over 30 yrs
- Wildfire 4/10 Moderate
- Heat 5/10 Major 7 d/yr ≥105°F today · 17 d/yr by 30 yrs out
- Wind 2/10 Low
- Air quality 1/10 Low 0 unhealthy d/yr today · 0 by 30 yrs out
Nearby sold comps map
Loading sold comps map…
Walkable amenities ~0.75 mi
Loading nearby amenities…
Taxation est. · year 1
- Rental income
- $10,546
- − Mortgage interest
- −$2,745
- − Property taxes
- −$735
- − Insurance
- −$245
- − Repairs & maintenance
- −$844
- − Management
- −$844
- − Depreciation
- −$1,425
- Taxable income
- $3,708
- Est. tax owed @ 24.0%
- −$890
- After-tax cash flow
- $3,378/yr
For passive investors: Depreciation is non-cash, so a rental often shows a tax loss while cash-flowing — sheltering income. Rental losses are passive: they offset passive income freely, and up to $25,000/yr can offset ordinary (W-2) income if you actively participate and your MAGI is under $100k (phasing out to $0 by $150k); unused losses carry forward. On sale, claimed depreciation is recaptured at up to 25%, and gains may owe capital-gains tax (a 1031 exchange can defer both). Figures are a year-1 estimate at your 24.0% rate — not tax advice; consult a CPA.
Schools (NCES district)
- District
- St John-Hudson
- NCES district ID
- 2011910
- Math proficiency
- 30% ▬ 0.00%
- Reading proficiency
- 30% ▬ 0.00%
- Median HH income
- $46,676
- Composite
- 28.72/100
- National rank
- #12004
- State rank
- #165 of 280 in KS
Livability — St. John
No livability data for this city. (Only ~50 U.S. cities are tracked.)
Census & demographics
- Census place
- St. John, KS
- Population (ZIP)
- 2,010
Population outlook (Stafford County) Hauer SSP2
- Today (2025)
- 3,953 people
- By 2030
- 3,818 · -3.4%
- By 2040
- 3,609 · -8.7%
- By 2050
- 3,473 · -12.1%
- By 2075
- 3,300 · -16.5%
- By 2100
- 2,957 · -25.2%
Race, ethnicity, and origin ACS 2023
- Neighborhood character
- Predominantly White (84%)
- Race & ethnicity
- White 84% Hispanic / Latino 12% Two or more races 5% Native American 1%
- Hispanic origin (detail)
- Mexican 12%
- Common ancestry
- Lithuanian 4% Norwegian 3% Slovak 1%
- Foreign-born
- 5% · Canada
- Languages at home
- 93% English-only · Spanish 7%
Political lean MEDSL · Stafford
- 2024 margin
- Solid R (+64.0) · D 17.1% · R 81.1% · Other 1.8%
- 2008→2024 swing
- -18.1pp toward R · 2008: -46.0pp · 2024: -64.0pp
- All cycles
- 2024: R+64.0 2020: R+63.3 2016: R+62.7 2012: R+53.4 2008: R+46.0
Not yet ingested
- Civics
- —
Market trends
- HPI YoY
- —
- Current HPI
- —
- Rent YoY
- —
- Metro
- —
- State GDP YoY
- —
- F500 in state
- 0
Price history
+233.3% since first listed16 events — show timeline
- 2026-06-01 Listed $50,000 Hays MLS
- 2026-02-27 Sold (MLS) — Hays MLS
- 2026-02-24 Pending — Hays MLS
- 2025-10-23 Relisted — Hays MLS
- 2025-09-09 Pending — Hays MLS
- 2025-08-26 Listed $50,000 Hays MLS
- 2025-03-21 Listing Removed — SCKMLS as Distributed by MLS Grid
- 2024-03-06 Listing Removed — SCKMLS as Distributed by MLS Grid
- 2024-02-27 Sold (MLS) — Hays MLS
- 2024-02-14 Pending — Hays MLS
- 2024-02-07 Relisted — Hays MLS
- 2024-01-19 Pending — Hays MLS
- 2023-10-02 Listed $39,900 Hays MLS
- 2023-10-02 Listed $39,900 SCKMLS as Distributed by MLS Grid
- 2023-07-20 Listed $35,000 SCKMLS as Distributed by MLS Grid
- 2002-03-01 Sold (Public Records) $15,000 Public Records
Cash-flow waterfall
monthlySold comps — $/sqft
last 12 mo · ≤1 miLoading sold comps…