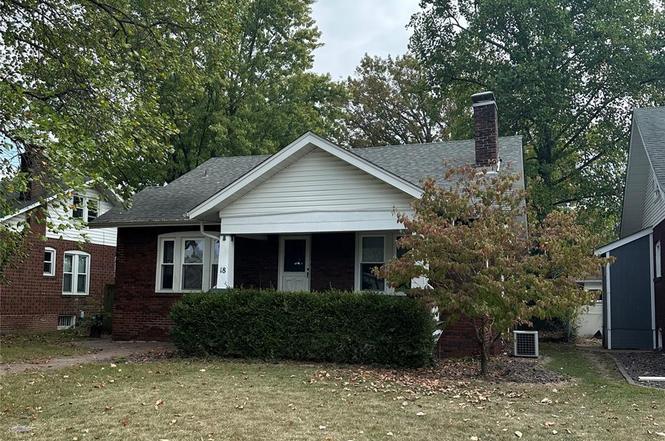
18 S 21st St · Belleville, IL
Flood risk 1/10 · Minimal
- FEMA flood zone
- X
- Chance of flooding over 30 yrs
- 0.0%
- Est. flood insurance / yr
- $473 – $860
Fire risk 1/10 · Minimal
- Est. fire insurance / yr
- $804 – $1,492
Heat risk 5/10 · Moderate
- Hot days now (above 107°F)
- 7 days/yr
- Hot days in 30 yrs
- 21 days/yr
Wind risk 2/10 · Minimal
- Chance of severe wind over 30 yrs
- 1.0%
Air-quality risk 4/10 · Minor
- Unhealthy air days now
- 3 days/yr
- Unhealthy air days in 30 yrs
- 6 days/yr
Risk factors via First Street. Map © Google.
Why this score? — see what drove the D grade
The composite is a weighted blend of 9 inputs, each scored 0–100. Each bar is that input's sub-score; the figure is the points it added to the 100-point composite (weight × sub-score).
- Cash flow +13.7/30.0
- ARV discount +8.8/15.0
- 1% rule +4.7/10.0
- DSCR +4.1/10.0
- Livability +3.9/5.0
- Rent growth +3.6/5.0
- Condition / age +2.5/5.0
- Schools +2.2/10.0
- Appreciation +0.0/10.0
$157,500
🖨 Deal sheet 📄 Offer letter ✓ Due diligence
Listing remarks MLS
THIS PROPERTY IS VERY NEAR LINDENWOOD UNIVERSITY AND IS BEING SOLD IN IT'S AS-IS, WHERE-IS CONDITION. SELLER WILL CHOOSE THE CLOSING ENTITY FOR PROPERTY. HOME HAS AN UNFINISHED BASEMENT WITH POTENTIAL FOR A 2ND BATHROOM AND A DETACHED GARAGE, FENCED BACKYARD.
Key facts
- Brick bungalow
- Window seat
- Convenient location
Tags
Neighborhood map
What this means for you Summary
Snapshot
- This is a 4-bed/3.0-bath single-family listed at $158k.
Deal economics
- At list price, monthly cash flow is $12 ($145/yr) — positive.
- The deal already cash-flows at list — no discount required.
- To meet the 1% rule (rent ≥ 1% of price), the offer needs to be $153k (2.6% below list).
- Recommended offer: $139k (12.0% below list) — sets the bar for market timing.
Location & tenants
- Location reads 78/100 on livability (#142 in IL, #2,604 nationally) — a middle-class / working-renter tenant base. Strengths: commute A+, cost of living A+, housing A+; Watch: crime F, amenities D-.
- Belleville Twp Hsd 201 (suburban): math 21% / reading 28% proficiency, ranked #308 of 620 in IL (top 50%) — low school quality limits family demand, transient renter base, plan for 1-2y turnover.
- Zoned schools: Belleville High School-West (math 19% / reading 26%, grade F, #317 of 693 statewide, top 46%, 2,234 students, 0% FRL).
- Market conditions: Rents rising fast (+4.6%/yr); 190 active listings in the ZIP; 3 comparable units currently listed for rent nearby; rentals at typical pace (median 18d on market — plan ~3-4 weeks tenant-placement turnaround); 783 units permitted in St. Clair County in 2024 (378 in 5+ unit buildings).
Forward outlook
- Local home prices are declining (-3.0%/yr); year-one equity from $1k of loan paydown is wiped out by about $5k of value loss. Plan a longer hold.
- St. Clair County population projected at -23% by 2050 — secular population decline; favor cash flow + early exit over multi-decade hold.
Negotiation context
- It's been on market 190 days — a 12% lower offer ($139k) is reasonable based on typical stale-listing flexibility.
- 2 sale attempts since 12y ago with the ask held roughly flat each time — persistent listings suggest the price (not the market) is what's stuck; bring a comps-based counter.
- Current owner paid $60k; list at $158k implies a 162% gain — meaningful room to come down on a strong offer.
Risks & watch-outs
- Watch-outs: built in 1923 — expect roof / HVAC / electrical / plumbing capex.
- Climate carrying-cost: extreme-heat days projected 7→21/yr by 2055 (HVAC capex compounding) — expect insurance premiums to compound above CPI over the hold.
Questions for the listing agent
- It's been on market 190 days. Have you received any prior offers? Is the seller open to a 12% concession, seller financing, or rate buy-down credit?
- Built in 1923 — when were the roof, HVAC, electrical panel, plumbing, and water heater last replaced?
- Why hasn't it sold? Are there any deal-killer items the seller is aware of (foundation, flood, title, zoning, code violations)?
- Is there a deadline driving the sale (1031 exchange, divorce, estate, relocation)? That informs how much negotiation room exists.
- Crime grade is F in this area — have there been break-ins, vandalism, or insurance claims at this property in the last 3 years? What carrier currently insures it and at what premium?
- The area grade is low — what's the realistic commute time and amenity access for the typical tenant pool here? Any planned neighborhood developments (good or bad) we should know about?
- What's the average days-on-market for RENTAL listings here right now (not sales)? A rising rental-DOM trend means longer vacancies and softer asking-rent achievability than the comps imply.
- What's the recent tenant-quality profile in this submarket — average credit score on applications, eviction rate, late-payment / NSF rate, and stable-employment percentage? A property-management company in the area should have these aggregated.
- How much new for-sale + rental construction is in the pipeline within 1–3 miles? Heavy new supply typically softens prices + rents 12–24 months out; constrained supply supports both.
Investment metrics
- 1% rule
- 0.97% ✗
- Cap rate
- 6.39%
- Cash-on-cash
- 0.33%
- DSCR
- 1.01
- GRM
- 8.6
CMA / ARV
- ARV (on-the-fly)
- $162,036
- Comps found
- 12
Show comp detail 12 sales within ~0.75 mi
| Address | Dist | Beds/Ba | Sqft | Sold | Price | $/sf | Match |
|---|---|---|---|---|---|---|---|
| 18 S 21st St | 0.00mi | 4/2.5 | 1,929 (0%) | 1mo | $157,500 | $82 | 97 |
| 604 N 17th St | 0.34mi | 3/2.0 (-1) | 1,925 (-0%) | 7mo | $146,000 | $76 | 69 |
| 207 S 17th St | 0.30mi | 3/2.0 (-1) | 1,997 (+4%) | 6mo | $10,000 | $5 | 67 |
| 6 Marian Ct | 0.33mi | 4/1.5 | 1,998 (+4%) | 10mo | $199,000 | $100 | 64 |
| 1825 W A St | 0.19mi | 3/2.0 (-1) | 1,792 (-7%) | 10mo | $149,900 | $84 | 62 |
| 209 N 14th St | 0.46mi | 3/2.0 (-1) | 2,040 (+6%) | 1mo | $40,000 | $20 | 59 |
| 120 N 28th St | 0.45mi | 4/1.5 | 2,100 (+9%) | 1mo | $85,000 | $40 | 57 |
| 1305 Raab Ave | 0.56mi | 3/2.0 (-1) | 1,775 (-8%) | 4mo | $180,000 | $101 | 49 |
| 2311 Fairview Cir | 0.38mi | 5/3.0 (+1) | 2,201 (+14%) | 8mo | $300,000 | $136 | 47 |
| 16 S 30th St | 0.64mi | 3/2.5 (-1) | 1,737 (-10%) | 4mo | $189,000 | $109 | 44 |
| 228 N 12th St | 0.56mi | 3/1.5 (-1) | 2,114 (+10%) | 9mo | $37,000 | $18 | 39 |
| 22 Kingsbury Dr | 0.67mi | 4/2.5 | 2,159 (+12%) | 10mo | $215,000 | $100 | 39 |
Match score weights: distance 35% · size 25% · config 20% · recency 20%. Top-matched comps best support the ARV.
Projected returns pro-forma
-3.0% appreciation · 4.56% rent growth · sell at horizon
- IRR
- -13.8%
- Equity multiple
- 0.50×
- Total profit
- $-22,215
- Equity at exit
- $23,484
- IRR
- -2.4%
- Equity multiple
- 0.83×
- Total profit
- $-7,621
- Equity at exit
- $13,618
Cash invested: $44,100 (down + closing). Projections, not guarantees.
Landlord ↔ Tenant lean methodology
- Overall (STATE)
- 43 Moderately Tenant-Leaning
- State Illinois
- 43 Moderately Tenant-Leaning · D+7
- County
- — inherits STATE
- City
- — inherits STATE
ZIP-level market 62226
- Rents YoY
- 4.6%
- Active inventory
- 190
- Price-to-rent
- 8.6×
Monthly cashflow live
- Estimated rent
- $1,534 medium interval (Pro) →
- Mortgage (P&I)
- −$826
- Tax from tax record
- −$308 /mo · $3,700/yr
- Insurance
- −$66
- HOA
- −$0
- Vacancy / Maint / Mgmt
- −$322
- Net cashflow
- $12
Break-even live
UW: 25.0% down · 7.5% · 30yr · 1.5% tax · 5.0% vac · 8.0% maint · 8.0% mgmt
Financing live
Cash to close
- Down payment
- $39,375
- Closing costs
- $4,725
- Reserves months
- —
- Total cash needed
- —
Loan-product check · same deal, 3 products live
Conventional
25% down · 7.5% · 30yr
- Down + closing
- —
- Monthly P&I
- —
- Monthly cashflow
- —
- DSCR
- —
- Eligible?
- —
Personal DTI + credit; lowest rate.
DSCR
20% down · 8.5% · 30yr
- Down + closing
- —
- Monthly P&I
- —
- Monthly cashflow
- —
- DSCR
- —
- Eligible?
- —
No personal income docs; deal must DSCR.
Hard money
10% down · 12.0% · 12mo
- Down + closing
- —
- Monthly P&I
- —
- Monthly cashflow
- —
- DSCR
- —
- Eligible?
- —
Short-term bridge; refi at stabilization.
Rent comps 3 comps
| Address | Beds | Baths | Sqft | Rent | $/sqft | DOM | Units | Dist |
|---|---|---|---|---|---|---|---|---|
| 109 S 13th St Belleville, IL | 3.0 | 1.5 | 1800 | $1,325 | $0.74 | 17d | 1 | 0.50mi |
| 1205 3rd Ave Belleville, IL | 4.0 | 2.0 | 1512 | $1,800 | $1.19 | 17d | 1 | 0.60mi |
| 618 W Monroe St Belleville, IL | 3.0 | 1.0 | 1500 | $1,050 | $0.70 | 23d | 1 | 0.99mi |
Listing history 8 events
-
2026-04-28status Pending
-
2025-11-05price $157,500
-
2025-10-20$165,000 Active
-
2014-12-11soldstatus 259-char remark
Show marketing remark (259 chars)
THIS PROPERTY IS VERY NEAR LINDENWOOD UNIVERSITY AND IS BEING SOLD IN IT'S AS-IS, WHERE-IS CONDITION. SELLER WILL CHOOSE THE CLOSING ENTITY FOR PROPERTY. HOME HAS AN UNFINISHED BASEMENT WITH POTENTIAL FOR A 2ND BATHROOM AND A DETACHED GARAGE, FENCED BACKYARD.
-
2014-10-30$44,900 259-char remark
Show marketing remark (259 chars)
THIS PROPERTY IS VERY NEAR LINDENWOOD UNIVERSITY AND IS BEING SOLD IN IT'S AS-IS, WHERE-IS CONDITION. SELLER WILL CHOOSE THE CLOSING ENTITY FOR PROPERTY. HOME HAS AN UNFINISHED BASEMENT WITH POTENTIAL FOR A 2ND BATHROOM AND A DETACHED GARAGE, FENCED BACKYARD.
-
1999-09-14soldstatus $60,000
-
1997-02-28soldstatus $57,000
-
1997-02-28soldstatus $57,000
ⓘ Source: listings_history table (triggers on properties + properties_extension) + one-shot
backfill from property_details.listing_events for pre-trigger history.
Tax reassessment forecast IL · Partial reset (capped growth)
- Current annual tax
- $3,700 · $308/mo
- Projected year-2 tax
- $3,700 · $308/mo
- Expected delta
- $0/yr ($0/mo · 0.0%)
ⓘ Screening estimate from a state-policy table — verify with the county assessor before closing.
Climate risk First Street
- Flood 1/10 Low FEMA zone X · 0% chance over 30 yrs
- Wildfire 1/10 Low
- Heat 5/10 Major 7 d/yr ≥107°F today · 21 d/yr by 30 yrs out
- Wind 2/10 Low 100% chance of damaging wind over 30 yrs
- Air quality 4/10 Moderate 3 unhealthy d/yr today · 6 by 30 yrs out
Nearby sold comps map
Loading sold comps map…
Walkable amenities ~0.75 mi
Loading nearby amenities…
Taxation est. · year 1
- Rental income
- $18,411
- − Mortgage interest
- −$8,822
- − Property taxes
- −$3,700
- − Insurance
- −$788
- − Repairs & maintenance
- −$1,473
- − Management
- −$1,473
- − Depreciation
- −$4,582
- Taxable loss
- −$2,427
- Est. tax savings @ 24.0%
- +$583
- After-tax cash flow
- $728/yr
For passive investors: Depreciation is non-cash, so a rental often shows a tax loss while cash-flowing — sheltering income. Rental losses are passive: they offset passive income freely, and up to $25,000/yr can offset ordinary (W-2) income if you actively participate and your MAGI is under $100k (phasing out to $0 by $150k); unused losses carry forward. On sale, claimed depreciation is recaptured at up to 25%, and gains may owe capital-gains tax (a 1031 exchange can defer both). Figures are a year-1 estimate at your 24.0% rate — not tax advice; consult a CPA.
Schools (NCES district)
- District
- Belleville Twp Hsd 201
- NCES district ID
- 1705640
- Math proficiency
- 21% ▼ -8.00%
- Reading proficiency
- 28% ▼ -3.00%
- Median HH income
- $58,064
- Composite
- 22.39/100
- National rank
- #8115
- State rank
- #308 of 620 in IL
Livability — Belleville
- Score
- 78/100
- State rank
- #142
- US rank
- #2604
Category grades
Schools grade is shown separately in the Schools card above.
Census & demographics
- Census place
- Belleville, IL
- County
- Saint Clair County · 169,691 people
- City population
- 47,407
- Metro
- St. Louis, MO-IL
- Population (ZIP)
- 28,255
- Household income
- $70,797
- Rent vs Own
- Severe rent burden
- 824.0
Population outlook (St. Clair County) Hauer SSP2
- Today (2025)
- 250,366 people
- By 2030
- 240,511 · -3.9%
- By 2040
- 217,391 · -13.2%
- By 2050
- 192,699 · -23.0%
- By 2075
- 140,637 · -43.8%
- By 2100
- 100,499 · -59.9%
Race, ethnicity, and origin ACS 2023
- Neighborhood character
- Majority White (64%)
- Race & ethnicity
- White 64% Black 24% Two or more races 7% Hispanic / Latino 3% Asian 2%
- Common ancestry
- Romanian 4% Lithuanian 2% Slovak 2%
- Foreign-born
- 4% · Canada, China
- Languages at home
- 96% English-only · Chinese 1% Spanish 1%
Political lean MEDSL · St. Clair
- 2024 margin
- Lean D (+7.9) · D 53.0% · R 45.1% · Other 1.8%
- 2008→2024 swing
- -14.6pp toward R · 2008: 22.4pp · 2024: 7.9pp
- All cycles
- 2024: D+7.9 2020: D+8.7 2016: D+5.6 2012: D+14.5 2008: D+22.4
Not yet ingested
- Civics
- —
Market trends
- HPI YoY
- ▼ -83.57%
- Current HPI
- 133.9028
- Rent YoY
- ▲ 4.56%
- Metro
- St. Louis, MO-IL
- State GDP YoY
- ▲ 1.59%
- F500 in state
- 60
Industry mix (Fortune 500 HQ in IL)
| Industry | F500 HQs | Revenue |
|---|---|---|
| Insurance | 4 | $201B |
|
||
| Consumer Goods | 4 | $87B |
|
||
| Industrial Machinery | 3 | $64B |
|
||
| Healthcare | 2 | $55B |
|
||
| Retail / Pharmacy | 1 | $148B |
|
||
| Agriculture / Food | 1 | $86B |
|
||
Price history
+176.3% since first listed8 events — show timeline
- 2026-04-28 Pending — MARIS as Distributed by MLS Grid
- 2025-11-05 Price Changed $157,500 MARIS as Distributed by MLS Grid
- 2025-10-20 Listed $165,000 MARIS as Distributed by MLS Grid
- 2014-12-11 Sold (MLS) — MARIS as Distributed by MLS Grid
- 2014-10-30 Listed $44,900 MARIS as Distributed by MLS Grid
- 1999-09-14 Sold (Public Records) $60,000 Public Records
- 1997-02-28 Sold (Public Records) $57,000 Public Records
- 1997-02-28 Sold (Public Records) $57,000 Public Records
Property tax history
+4.2%/yrLatest (2024): $3,700 · -4.0% YoY. Source: county tax records.
Cash-flow waterfall
monthlySold comps — $/sqft
last 12 mo · ≤1 miLoading sold comps…