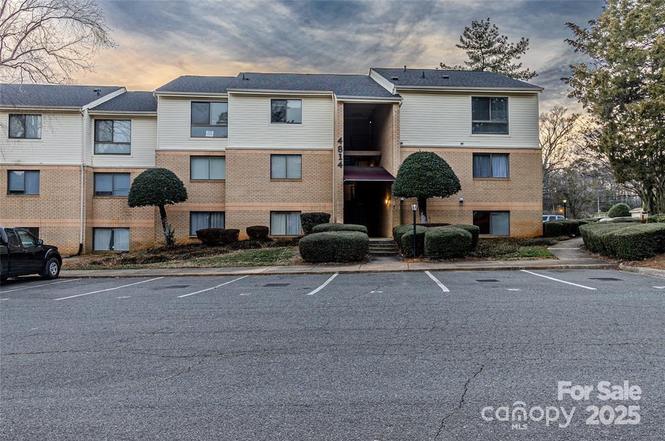
4814 Spring Lake Dr Unit E · Charlotte, NC
Flood risk 1/10 · Minimal
- FEMA flood zone
- X (unshaded)
- Chance of flooding over 30 yrs
- 0.0%
- Est. flood insurance / yr
- $507 – $1,088
Fire risk 1/10 · Minimal
- Est. fire insurance / yr
- $906 – $1,684
Heat risk 6/10 · Moderate
- Hot days now (above 104°F)
- 7 days/yr
- Hot days in 30 yrs
- 17 days/yr
Wind risk 6/10 · Moderate
- Chance of severe wind over 30 yrs
- 27.0%
Air-quality risk 3/10 · Minor
- Unhealthy air days now
- 3 days/yr
- Unhealthy air days in 30 yrs
- 4 days/yr
Risk factors via First Street. Map © Google.
Why this score? — see what drove the D grade
The composite is a weighted blend of 9 inputs, each scored 0–100. Each bar is that input's sub-score; the figure is the points it added to the 100-point composite (weight × sub-score).
- Cash flow +11.3/30.0
- ARV discount +7.5/15.0
- 1% rule +6.2/10.0
- Livability +3.9/5.0
- Schools +3.8/10.0
- DSCR +3.3/10.0
- Condition / age +2.5/5.0
- Rent growth +1.7/5.0
- Appreciation +0.0/10.0
$132,000
🖨 Deal sheet 📄 Offer letter ✓ Due diligence
Listing remarks
This condo is waiting for it's new owner! Ready for you to call it your home or you can add it to your rental portfolio! Charming 2 Bed 2 Bath condo with a spacious floor plan. You could relax in the living area by the fireplace after a long day of work! The master suite includes a soaker tub and a back patio with a beautiful view. Located on the third floor - You do not want to miss this opportunity to make it yours!
Key facts
- Beautiful view
- Soaker tub
- Fireplace
Tags
Property features AI
Finance
- HOA & community: Mandatory HOA managed by Henderson Association Management; HOA fee $300 monthly
Exterior
- Parking: Assigned parking
- Utilities: City water; Public sewer
- Home design: Condominium (residential); Site-built construction; Brick exterior; Three levels; Slab foundation
- Construction: Site built; Brick full exterior; Slab foundation
- Exterior features: Concrete road access; Private maintained road
Interior
- Kitchen: Refrigerator
- Bedrooms: 2 bedrooms (both on the main level)
- Bathrooms: 2 full bathrooms
- Heating & cooling: Central heating; Central air conditioning
- Interior features: Refrigerator included; Fireplace; Entry on level 3
- Laundry & utility: Laundry closet
Neighborhood map
What this means for you Summary
Snapshot
- This is a 2-bed/2.0-bath condo listed at $132k.
Deal economics
- At list price, monthly cash flow is $-47 ($-565/yr) — negative.
- To cash-flow at today's rent, offer at most $125k (5.2% below list).
- Meets the 1% rule at list price ($1k rent vs $132k).
- Recommended offer: $116k (12.0% below list) — sets the bar for market timing.
- Cap rate 5.9% vs local median 3.1% in Charlotte — top-decile yield for the area; either an underpriced asset or a hidden risk that comps aren't pricing in. Stress-test before assuming the spread holds.
Location & tenants
- Location reads 78/100 on livability (#26 in NC, #2,502 nationally) — a middle-class / working-renter tenant base. Strengths: amenities A+, commute A+, housing A+; Watch: schools D+, crime F.
- Charlotte-Mecklenburg Schools (urban): math 42% / reading 46% proficiency, ranked #85 of 178 in NC (top 48%) — families likely to look elsewhere, expect single-tenant / working-renter base with shorter leases.
- Market conditions: Rents falling (-3.0%/yr); 127 active listings in the ZIP; 40 comparable units currently listed for rent nearby; rentals at typical pace (median 16d on market — plan ~3-4 weeks tenant-placement turnaround); 11,969 units permitted in Mecklenburg County in 2024 (5,377 in 5+ unit buildings).
- This rent runs 34% of the median local income ($53k/yr) — at the standard rent-burdened threshold; future hikes will face affordability resistance.
Forward outlook
- Local home prices are declining (-3.0%/yr); year-one equity from $913 of loan paydown is wiped out by about $4k of value loss. Plan a longer hold.
- Mecklenburg County population projected at +53% by 2050 — long-run rental-demand tailwind backs the buy-and-hold thesis.
Negotiation context
- It's been on market 196 days — a 12% lower offer ($116k) is reasonable based on typical stale-listing flexibility.
- 10 sale attempts since 3y ago with the ask held roughly flat each time — persistent listings suggest the price (not the market) is what's stuck; bring a comps-based counter.
Risks & watch-outs
- Watch-outs: HOA is 20% of rent.
- Climate carrying-cost: major wind risk, 27% chance of damaging wind over 30y; extreme-heat days projected 7→17/yr by 2055 (HVAC capex compounding) — expect insurance premiums to compound above CPI over the hold.
Questions for the listing agent
- What do current leases actually rent for vs. the listed asking? Can we see a recent rent roll and the last 12 months of T-12 income?
- It's been on market 196 days. Have you received any prior offers? Is the seller open to a 12% concession, seller financing, or rate buy-down credit?
- What does the HOA fee cover, when was the last increase, and are there any pending special assessments or reserve-fund shortfalls?
- Any open or pending special assessments — roof, HVAC, plumbing, elevator, façade? What's the per-unit balance and payoff schedule, and is the seller paying it off at close or rolling it to the buyer?
- Why hasn't it sold? Are there any deal-killer items the seller is aware of (foundation, flood, title, zoning, code violations)?
- Is there a deadline driving the sale (1031 exchange, divorce, estate, relocation)? That informs how much negotiation room exists.
- Schools are D-rated, which usually means shorter tenancies and higher turnover. Who's the typical renter profile here, and what's been the actual vacancy rate?
- Crime grade is F in this area — have there been break-ins, vandalism, or insurance claims at this property in the last 3 years? What carrier currently insures it and at what premium?
- The area grade is low — what's the realistic commute time and amenity access for the typical tenant pool here? Any planned neighborhood developments (good or bad) we should know about?
- What's the average days-on-market for RENTAL listings here right now (not sales)? A rising rental-DOM trend means longer vacancies and softer asking-rent achievability than the comps imply.
- What's the recent tenant-quality profile in this submarket — average credit score on applications, eviction rate, late-payment / NSF rate, and stable-employment percentage? A property-management company in the area should have these aggregated.
- How much new apartment / multifamily construction is in the pipeline within 1–3 miles? Heavy new supply (>2% of stock underway) typically softens rents 12–24 months out; light construction supports rent growth.
Investment metrics
- 1% rule
- 1.12% ✓
- Cap rate
- 5.86%
- Cash-on-cash
- -1.53%
- DSCR
- 0.93
- GRM
- 7.5
CMA / ARV
No comps found within radius.
Projected returns pro-forma
-3.0% appreciation · 0.0% rent growth · sell at horizon
- IRR
- -23.3%
- Equity multiple
- 0.23×
- Total profit
- $-28,505
- Equity at exit
- $19,682
- IRR
- -35.0%
- Equity multiple
- -0.21×
- Total profit
- $-44,548
- Equity at exit
- $11,413
Cash invested: $36,960 (down + closing). Projections, not guarantees.
Landlord ↔ Tenant lean methodology
- Overall (STATE)
- 85 Strongly Landlord-Friendly
- State North Carolina
- 85 Strongly Landlord-Friendly · R+3
- County
- — inherits STATE
- City
- — inherits STATE
ZIP-level market 28212
- Rents YoY
- -3.0%
- Active inventory
- 127
- Price-to-rent
- 7.5×
Monthly cashflow live
- Estimated rent
- $1,475 high interval (Pro) →
- Mortgage (P&I)
- −$692
- Tax est. 1.5%
- −$165 /mo · $1,980/yr
- Insurance
- −$55
- HOA
- −$300
- Vacancy / Maint / Mgmt
- −$310
- Net cashflow
- $-47
Break-even live
UW: 25.0% down · 7.5% · 30yr · 1.5% tax · 5.0% vac · 8.0% maint · 8.0% mgmt
Financing live
Cash to close
- Down payment
- $33,000
- Closing costs
- $3,960
- Reserves months
- —
- Total cash needed
- —
Loan-product check · same deal, 3 products live
Conventional
25% down · 7.5% · 30yr
- Down + closing
- —
- Monthly P&I
- —
- Monthly cashflow
- —
- DSCR
- —
- Eligible?
- —
Personal DTI + credit; lowest rate.
DSCR
20% down · 8.5% · 30yr
- Down + closing
- —
- Monthly P&I
- —
- Monthly cashflow
- —
- DSCR
- —
- Eligible?
- —
No personal income docs; deal must DSCR.
Hard money
10% down · 12.0% · 12mo
- Down + closing
- —
- Monthly P&I
- —
- Monthly cashflow
- —
- DSCR
- —
- Eligible?
- —
Short-term bridge; refi at stabilization.
Rent comps 40 comps
| Address | Beds | Baths | Sqft | Rent | $/sqft | DOM | Units | Dist |
|---|---|---|---|---|---|---|---|---|
| 4811 Spring Lake Dr Unit E Charlotte, NC | 2.0 | 2.0 | 1053 | $1,500 | $1.42 | 20d | 1 | 0.02mi |
| 4900 Spring Lake Dr Charlotte, NC | 2.0 | 2.0 | 1053 | $1,499 | $1.42 | 12d | 1 | 0.05mi |
| 4700 Twisted Oaks Rd Charlotte, NC | 1.0–2.0 | 1.0–2.0 | 780 | $1,498 | $1.92 | 1d | 14 | 0.11mi |
| 5100 Little Greenleaf Way Charlotte, NC | 2.0 | 2.0 | 970 | $1,199 | $1.24 | 7d | 1 | 0.13mi |
| 4617 Sharon Chase Dr Unit H Charlotte, NC | 2.0 | 2.0 | 908 | $1,395 | $1.54 | 23d | 1 | 0.48mi |
| 4608 Sharon Chase Dr Unit C Charlotte, NC | 3.0 | 2.0 | 1062 | $1,700 | $1.60 | 16d | 1 | 0.51mi |
| 4033 Woodgreen Ter Charlotte, NC | 3.0 | 2.0 | 1456 | $2,600 | $1.79 | 16d | 1 | 0.57mi |
| 4908 Endolwood Rd Charlotte, NC | 1.0–2.0 | 1.0–2.0 | 775 | $1,405 | $1.81 | 2d | 25 | 0.60mi |
| 4408 Sharon Chase Dr Charlotte, NC | 1.0 | 1.0 | 992 | $730 | $0.74 | 16d | 1 | 0.63mi |
| 4309 Dowling Dr Charlotte, NC | 3.0 | 1.5 | 1323 | $1,995 | $1.51 | 14d | 1 | 0.65mi |
| 4417 Sharon Chase Dr Unit A Charlotte, NC | 2.0 | 2.0 | 929 | $1,299 | $1.40 | 16d | 1 | 0.68mi |
| 6103 Guildford Hill Ln Charlotte, NC | 1.0 | 1.0 | 1475 | $595 | $0.40 | 23d | 1 | 0.78mi |
| 6103 Guildford Hill Ln Charlotte, NC | 1.0 | 1.0 | 1475 | $895 | $0.61 | 16d | 1 | 0.78mi |
| 6050 Guildford Hill Ln Charlotte, NC | 3.0 | 2.5 | 1429 | $1,795 | $1.26 | 23d | 1 | 0.80mi |
| 3829 N Sharon Amity Rd Charlotte, NC | 3.0 | 1.0 | 1500 | $1,600 | $1.07 | 16d | 1 | 0.91mi |
| 7113 Village Green Dr Charlotte, NC | 1.0–2.0 | 1.0 | 710 | $1,175 | $1.65 | 1d | 8 | 0.92mi |
| 2635 Clover Hill Ln Charlotte, NC | 3.0 | 1.5 | 1281 | $2,200 | $1.72 | 23d | 1 | 0.93mi |
| 4122 Birch Leaf Ct Unit 202 Charlotte, NC | 2.0 | 2.5 | 1320 | $1,599 | $1.21 | 10d | 1 | 0.94mi |
| 3741 N Sharon Amity Rd Charlotte, NC | 3.0 | 1.5 | 1368 | $1,750 | $1.28 | 10d | 1 | 0.96mi |
| 3908 Briarhill Dr Charlotte, NC | 3.0 | 1.5 | 1229 | $1,395 | $1.14 | 23d | 1 | 0.98mi |
| 6017 Williams Rd Charlotte, NC | 3.0 | 1.0–2.0 | 877 | $1,567 | $1.79 | 23d | 1 | 1.02mi |
| 4933 Central Ave Charlotte, NC | 1.0–3.0 | 1.0–2.0 | 906 | $1,464 | $1.62 | 1d | 15 | 1.02mi |
| 1207 Kelston Pl Charlotte, NC | 1.0–3.0 | 1.0–2.0 | 1022 | $1,219 | $1.19 | 1d | 42 | 1.03mi |
| 7000 Barrington Dr Unit 2703-08 Charlotte, NC | 2.0 | 1.5 | 945 | $1,160 | $1.23 | 4d | 1 | 1.06mi |
| 7000 Barrington Dr Unit 7101-05 Charlotte, NC | 1.0 | 1.0 | 756 | $980 | $1.30 | 23d | 1 | 1.06mi |
| 7000 Barrington Dr Unit 2621-03 Charlotte, NC | 1.0 | 1.0 | 756 | $1,120 | $1.48 | 23d | 1 | 1.06mi |
| 7000 Barrington Dr Unit 2500-10 Charlotte, NC | 2.0 | 1.5 | 945 | $1,410 | $1.49 | 7d | 1 | 1.06mi |
| 7000 Barrington Dr Unit L2705-01 Charlotte, NC | 3.0 | 1.5 | 1320 | $1,600 | $1.21 | 14d | 1 | 1.06mi |
| 7000 Barrington Dr Unit L2615-05 Charlotte, NC | 1.0 | 1.0 | 756 | $980 | $1.30 | 14d | 1 | 1.06mi |
| 5507 Lawrence Orr Rd Charlotte, NC | 3.0 | 2.0 | 1148 | $1,820 | $1.59 | 7d | 1 | 1.06mi |
| 4306 Tantilla Cir Charlotte, NC | 2.0 | 1.0 | 777 | $1,165 | $1.50 | 23d | 1 | 1.07mi |
| 5625 Keyway Blvd Charlotte, NC | 1.0–2.0 | 1.0–2.0 | 783 | $1,360 | $1.74 | 1d | 16 | 1.08mi |
| 7000 Barrington Dr Charlotte, NC | 1.0–3.0 | 1.0–1.5 | 997 | $1,290 | $1.29 | 1d | 8 | 1.09mi |
| 3829 Stonehaven Dr Charlotte, NC | 3.0 | 1.5 | 1081 | $1,850 | $1.71 | 16d | 1 | 1.09mi |
| 5625 Hollyfield Dr Charlotte, NC | 1.0–3.0 | 1.0–2.0 | 1118 | $2,052 | $1.83 | 2d | 188 | 1.10mi |
| 3932 Slagle Dr Charlotte, NC | 3.0 | 2.0 | 1015 | $1,800 | $1.77 | 23d | 1 | 1.11mi |
| 4540 Tantilla Cir Charlotte, NC | 1.0–2.0 | 1.0–2.0 | 748 | $1,350 | $1.80 | 7d | 4 | 1.13mi |
| 7264 Rose Terrace Ct Charlotte, NC | 2.0 | 2.0 | 1000 | $1,375 | $1.38 | 4d | 6 | 1.13mi |
| 7000 Barrington Dr Unit 2500-03 Charlotte, NC | 2.0 | 1.5 | 945 | $1,410 | $1.49 | 23d | 1 | 1.13mi |
| 7234 Rose Terrace Ct Unit 7242 Charlotte, NC | 2.0 | 2.0 | 1000 | $1,450 | $1.45 | 23d | 1 | 1.14mi |
HOA detail condo
- Monthly dues
- $300 · $3,600/yr
- Assessments
- None detected in remarks — confirm with the listing agent.
Listing history 38 events
-
2026-06-18days on market $132,000 Active 196 DOM
-
2026-06-17days on market $132,000 Active 195 DOM
-
2026-06-16days on market $132,000 Active 194 DOM
-
2026-06-15days on market $132,000 Active 193 DOM
-
2026-06-13days on market $132,000 Active 191 DOM
-
2026-06-10days on market $132,000 Active 187 DOM
-
2026-06-08days on market $132,000 Active 186 DOM
-
2026-06-07days on market $132,000 Active 185 DOM
-
2026-06-04days on market $132,000 Active 182 DOM
-
2026-06-03days on market $132,000 Active 181 DOM
-
2026-06-02days on market $132,000 Active 180 DOM
-
2026-06-02days on market $132,000 Active 179 DOM
-
2026-05-31days on market $132,000 Active 178 DOM
-
2025-12-07status Active
-
2025-10-23status Pending
-
2025-10-20price $132,000
-
2025-10-20$133,000 Active
-
2025-07-07price $133,000
-
2025-06-27price $134,000
-
2025-06-03price $139,000
-
2025-04-09status Active
-
2025-03-03status Pending
-
2025-02-25$134,900 Active
-
2024-10-15$140,000 Active
-
2024-09-20price $144,500
-
2024-08-19price $145,000
-
2024-06-20$146,500 Active
-
2024-06-10price $148,000
-
2024-04-27price $149,000
-
2024-04-05status Active
-
2024-02-26status Pending
-
2024-02-16$155,000 Active
-
2023-10-01price $162,000
-
2023-09-26price $168,800
-
2023-09-18price $169,000
-
2023-08-24price $174,000
-
2023-08-09$179,000 Active
-
2023-08-04$179,000 Active
ⓘ Source: listings_history table (triggers on properties + properties_extension) + one-shot
backfill from property_details.listing_events for pre-trigger history.
Climate risk First Street
- Flood 1/10 Low FEMA zone X (unshaded) · 0% chance over 30 yrs
- Wildfire 1/10 Low
- Heat 6/10 Major 7 d/yr ≥104°F today · 17 d/yr by 30 yrs out
- Wind 6/10 Major 27% chance of damaging wind over 30 yrs
- Air quality 3/10 Moderate 3 unhealthy d/yr today · 4 by 30 yrs out
Nearby sold comps map
Loading sold comps map…
Walkable amenities ~0.75 mi
Loading nearby amenities…
Taxation est. · year 1
- Rental income
- $17,698
- − Mortgage interest
- −$7,394
- − Property taxes
- −$1,980
- − Insurance
- −$660
- − Repairs & maintenance
- −$1,416
- − Management
- −$1,416
- − HOA
- −$3,600
- − Depreciation
- −$3,840
- Taxable loss
- −$2,608
- Est. tax savings @ 24.0%
- +$626
- After-tax cash flow
- $61/yr
For passive investors: Depreciation is non-cash, so a rental often shows a tax loss while cash-flowing — sheltering income. Rental losses are passive: they offset passive income freely, and up to $25,000/yr can offset ordinary (W-2) income if you actively participate and your MAGI is under $100k (phasing out to $0 by $150k); unused losses carry forward. On sale, claimed depreciation is recaptured at up to 25%, and gains may owe capital-gains tax (a 1031 exchange can defer both). Figures are a year-1 estimate at your 24.0% rate — not tax advice; consult a CPA.
Schools (NCES district)
- District
- Charlotte-Mecklenburg Schools
- NCES district ID
- 3702970
- Math proficiency
- 42% ▼ -6.00%
- Reading proficiency
- 46% ▲ 1.00%
- Median HH income
- $57,175
- Composite
- 38.49/100
- National rank
- #4183
- State rank
- #85 of 178 in NC
Livability — Charlotte
- Score
- 78/100
- State rank
- #26
- US rank
- #2502
Category grades
Schools grade is shown separately in the Schools card above.
Census & demographics
- Census place
- Charlotte, NC
- County
- Mecklenburg County · 1,167,319 people
- City population
- 920,422
- Metro
- Charlotte-Concord-Gastonia, NC-SC
- Population (ZIP)
- 42,440
- Household income
- $52,723
- Rent vs Own
- Severe rent burden
- 2550.0
Population outlook (Mecklenburg County) Hauer SSP2
- Today (2025)
- 1,305,740 people
- By 2030
- 1,442,752 · +10.5%
- By 2040
- 1,722,441 · +31.9%
- By 2050
- 1,999,450 · +53.1%
- By 2075
- 2,642,495 · +102.4%
- By 2100
- 3,106,755 · +137.9%
Race, ethnicity, and origin ACS 2023
- Neighborhood character
- Highly diverse neighborhood (Simpson 0.71)
- Race & ethnicity
- Black 39% Hispanic / Latino 32% White 18% Two or more races 12% Asian 8% Native American 1%
- Hispanic origin (detail)
- Mexican 14% Dominican 2%
- Common ancestry
- Serbian 1% Lithuanian 1% Slovak 1%
- Foreign-born
- 29% · Canada, Philippines, Jamaica
- Languages at home
- 60% English-only · Spanish 29% Other Indo-European 3% Other Asian/Pacific 3%
Political lean MEDSL · Mecklenburg
- 2024 margin
- Solid D (+32.9) · D 65.6% · R 32.7% · Other 1.6%
- 2008→2024 swing
- +8.5pp toward D · 2008: 24.4pp · 2024: 32.9pp
- All cycles
- 2024: D+32.9 2020: D+35.1 2016: D+29.9 2012: D+22.5 2008: D+24.4
Not yet ingested
- Civics
- —
Market trends
- HPI YoY
- ▼ -268.88%
- Current HPI
- 317.7088
- Rent YoY
- ▼ -3.02%
- Metro
- Charlotte-Concord-Gastonia, NC-SC
- State GDP YoY
- ▲ 3.28%
- F500 in state
- 26
Industry mix (Fortune 500 HQ in NC)
| Industry | F500 HQs | Revenue |
|---|---|---|
| Financial Services | 2 | $213B |
|
||
| Retail | 2 | $95B |
|
||
| Industrial Conglomerate | 1 | $38B |
|
||
| Metals / Steel | 1 | $35B |
|
||
| Utilities | 1 | $30B |
|
||
| Industrial Machinery | 1 | $19B |
|
||
Price history
-26.3% since first listed25 events — show timeline
- 2025-12-07 Relisted — CANOPYMLS as Distributed by MLS Grid
- 2025-10-23 Pending — CANOPYMLS as Distributed by MLS Grid
- 2025-10-20 Price Changed $132,000 CANOPYMLS as Distributed by MLS Grid
- 2025-10-20 Listed $133,000 CANOPYMLS as Distributed by MLS Grid
- 2025-07-07 Price Changed $133,000 CANOPYMLS as Distributed by MLS Grid
- 2025-06-27 Price Changed $134,000 CANOPYMLS as Distributed by MLS Grid
- 2025-06-03 Price Changed $139,000 CANOPYMLS as Distributed by MLS Grid
- 2025-04-09 Relisted — CANOPYMLS as Distributed by MLS Grid
- 2025-03-03 Pending — CANOPYMLS as Distributed by MLS Grid
- 2025-02-25 Listed $134,900 CANOPYMLS as Distributed by MLS Grid
- 2024-10-15 Listed $140,000 CANOPYMLS as Distributed by MLS Grid
- 2024-09-20 Price Changed $144,500 CANOPYMLS as Distributed by MLS Grid
- 2024-08-19 Price Changed $145,000 CANOPYMLS as Distributed by MLS Grid
- 2024-06-20 Listed $146,500 CANOPYMLS as Distributed by MLS Grid
- 2024-06-10 Price Changed $148,000 CANOPYMLS as Distributed by MLS Grid
- 2024-04-27 Price Changed $149,000 CANOPYMLS as Distributed by MLS Grid
- 2024-04-05 Relisted — CANOPYMLS as Distributed by MLS Grid
- 2024-02-26 Pending — CANOPYMLS as Distributed by MLS Grid
- 2024-02-16 Listed $155,000 CANOPYMLS as Distributed by MLS Grid
- 2023-10-01 Price Changed $162,000 CANOPYMLS as Distributed by MLS Grid
- 2023-09-26 Price Changed $168,800 CANOPYMLS as Distributed by MLS Grid
- 2023-09-18 Price Changed $169,000 CANOPYMLS as Distributed by MLS Grid
- 2023-08-24 Price Changed $174,000 CANOPYMLS as Distributed by MLS Grid
- 2023-08-09 Listed $179,000 CANOPYMLS as Distributed by MLS Grid
- 2023-08-04 Listed $179,000 CANOPYMLS as Distributed by MLS Grid
Cash-flow waterfall
monthlySold comps — $/sqft
last 12 mo · ≤1 miLoading sold comps…