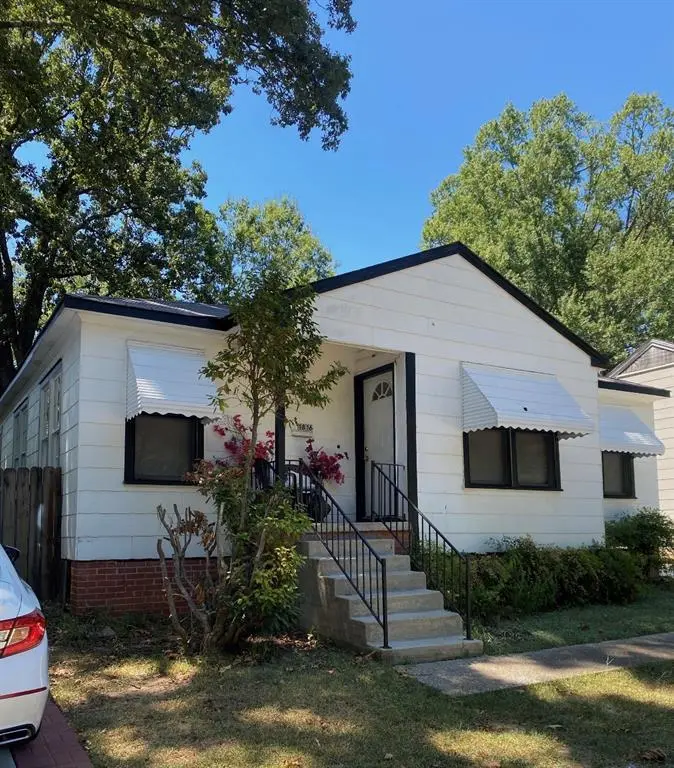
1816 Jenkins Ave · Shreveport, LA
Flood risk 1/10 · Minimal
- FEMA flood zone
- X (unshaded)
- Chance of flooding over 30 yrs
- 0.0%
- Est. flood insurance / yr
- $507 – $1,088
Fire risk 1/10 · Minimal
- Est. fire insurance / yr
- $1,269 – $2,357
Heat risk 7/10 · Major
- Hot days now (above 110°F)
- 7 days/yr
- Hot days in 30 yrs
- 21 days/yr
Wind risk 6/10 · Moderate
- Chance of severe wind over 30 yrs
- 66.0%
Air-quality risk 2/10 · Minimal
- Unhealthy air days now
- 1 days/yr
- Unhealthy air days in 30 yrs
- 2 days/yr
Risk factors via First Street. Map © Google.
Why this score? — see what drove the B grade
The composite is a weighted blend of 9 inputs, each scored 0–100. Each bar is that input's sub-score; the figure is the points it added to the 100-point composite (weight × sub-score).
- Cash flow +30.0/30.0
- DSCR +10.0/10.0
- 1% rule +8.3/10.0
- ARV discount +7.1/15.0
- Appreciation +4.8/10.0
- Livability +3.0/5.0
- Rent growth +2.5/5.0
- Condition / age +2.5/5.0
- Schools +2.2/10.0
$69,000
🖨 Deal sheet 📄 Offer letter ✓ Due diligence
Listing remarks
Cute and well-maintained 3 bedroom, 1 bath home with an active tenant in place, currently leased at $850 per month. The lease has approximately 5 months remaining on a 1-year term, providing near term flexibility and continued rental income. This property features wood and tile flooring throughout, along with blinds already installed for added convenience. The kitchen includes a gas range and refrigerator, and the home is serviced by a gas hot water heather. A garage adds valuable storage. A solid investment property with steady income and desirable features. Do not disturb tenants!
Key facts
- Gas hot water heater
- Garage
- Refrigerator
Tags
Property features AI
Finance
- Other: Standard listing; possession at closing/funding; Minerals excluded
- Financial info: Listing accepts cash, fixed-rate, or other financing
- HOA & community: No association
Exterior
- Parking: Driveway; Covered parking space; Attached garage with 1 garage space
- Utilities: City water; City sewer; Not in a municipal utility district
- Home design: Single-family residence; One story; Residential property in a subdivision; Built in 1955
- Construction: Brick and vinyl siding exterior; Composition roof; Pillar/post/pier foundation
- Exterior features: Covered front porch; Awnings
Interior
- Kitchen: Gas range; Refrigerator; Gas water heater
- Bedrooms: Primary bedroom on level 1; Two additional bedrooms on level 1 (total 3 bedrooms)
- Flooring: Hardwood; Tile
- Bathrooms: One full bathroom
- Heating & cooling: Central heating (natural gas); Central air; Ceiling fan(s)
- Interior features: Eat-in kitchen; Window coverings; One living area; One dining area; 6 total rooms
- Laundry & utility: Laundry area in the garage
Neighborhood map
What this means for you Summary
Snapshot
- This is a 2-bed/1.0-bath single-family listed at $69k.
Deal economics
- At list price, monthly cash flow is $297 ($4k/yr) — positive.
- The deal already cash-flows at list — no discount required.
- Meets the 1% rule at list price ($918 rent vs $69k).
- Recommended offer: $68k (1.5% below list) — sets the bar for market timing.
- Cap rate 11.5% vs local median 5.7% in Shreveport — top-decile yield for the area; either an underpriced asset or a hidden risk that comps aren't pricing in. Stress-test before assuming the spread holds.
Location & tenants
- Location reads 59/100 on livability (#270 in LA) — a working-class tenant base; expect higher turnover. Strengths: cost of living A+, housing A; Watch: schools D+, crime F, amenities F.
- Caddo Parish (urban): math 21% / reading 32% proficiency, ranked #53 of 98 in LA (top 54%) — low school quality limits family demand, transient renter base, plan for 1-2y turnover; 64% free/reduced lunch — lower-income household profile, screen leases tightly.
- Market conditions: 61 active listings in the ZIP; 40 comparable units currently listed for rent nearby; rentals at typical pace (median 21d on market — plan ~3-4 weeks tenant-placement turnaround); lower-income renter base — watch delinquency; 221 units permitted in Caddo Parish in 2024 (0 in 5+ unit buildings).
- At $918/mo this rent would consume 57% of the median local household income ($19k/yr) (locally 702% of renters already pay >50% of income on rent) — very limited rent-growth headroom before tenants either downsize or default.
Forward outlook
- In year one you build about $269 of equity ($477 loan paydown + $-208 appreciation (-0.3% local appreciation)).
- Caddo County population projected at -15% by 2050 — secular population decline; favor cash flow + early exit over multi-decade hold.
- At projected returns (-0.3% appreciation + 3.0% rent growth), your $19k cash investment doubles in ~5 years — after that, you're playing with house money.
Negotiation context
- It's been on market 21 days — a 2% lower offer ($68k) is reasonable based on typical stale-listing flexibility.
- Current owner paid $42k; list at $69k implies a 64% gain — meaningful room to come down on a strong offer.
Risks & watch-outs
- Watch-outs: built in 1955 — expect roof / HVAC / electrical / plumbing capex.
- Climate carrying-cost: major wind risk, 66% chance of damaging wind over 30y; extreme-heat days projected 7→21/yr by 2055 (HVAC capex compounding) — expect insurance premiums to compound above CPI over the hold.
Questions for the listing agent
- Built in 1955 — when were the roof, HVAC, electrical panel, plumbing, and water heater last replaced?
- Is there a deadline driving the sale (1031 exchange, divorce, estate, relocation)? That informs how much negotiation room exists.
- Schools are D-rated, which usually means shorter tenancies and higher turnover. Who's the typical renter profile here, and what's been the actual vacancy rate?
- Crime grade is F in this area — have there been break-ins, vandalism, or insurance claims at this property in the last 3 years? What carrier currently insures it and at what premium?
- What's the average days-on-market for RENTAL listings here right now (not sales)? A rising rental-DOM trend means longer vacancies and softer asking-rent achievability than the comps imply.
- What's the recent tenant-quality profile in this submarket — average credit score on applications, eviction rate, late-payment / NSF rate, and stable-employment percentage? A property-management company in the area should have these aggregated.
- How much new for-sale + rental construction is in the pipeline within 1–3 miles? Heavy new supply typically softens prices + rents 12–24 months out; constrained supply supports both.
Investment metrics
- 1% rule
- 1.33% ✓
- Cap rate
- 11.46%
- Cash-on-cash
- 18.46%
- DSCR
- 1.82
- GRM
- 6.3
CMA / ARV
- ARV (on-the-fly)
- $68,442
- Comps found
- 12
Show comp detail 12 sales within ~0.75 mi
| Address | Dist | Beds/Ba | Sqft | Sold | Price | $/sf | Match |
|---|---|---|---|---|---|---|---|
| 140 E College | 0.24mi | 3/1.0 (+1) | 1,100 (-2%) | 0mo | $10,000 | $9 | 80 |
| 123 Lister St | 0.33mi | 2/1.0 | 1,059 (-6%) | 12mo | $65,000 | $61 | 65 |
| 432 E Merrick St | 0.27mi | 3/1.0 (+1) | 1,210 (+8%) | 9mo | $50,000 | $41 | 62 |
| 204 Boulevard St | 0.45mi | 2/1.0 | 1,028 (-8%) | 6mo | $38,000 | $37 | 60 |
| 154 E Wyandotte St | 0.15mi | 3/1.5 (+1) | 1,264 (+13%) | 6mo | $69,500 | $55 | 60 |
| 110 E Prospect St | 0.45mi | 3/1.0 (+1) | 1,211 (+8%) | 7mo | $87,000 | $72 | 55 |
| 1115 Crofton St | 0.64mi | 3/1.0 (+1) | 1,159 (+3%) | 11mo | $25,000 | $22 | 51 |
| 316 Dalzell St | 0.64mi | 3/2.0 (+1) | 1,142 (+2%) | 11mo | $148,000 | $130 | 49 |
| 406 College St | 0.63mi | 2/1.0 | 1,215 (+8%) | 13mo | $50,000 | $41 | 46 |
| 2530 Captain Sawyer Dr | 0.73mi | 3/1.0 (+1) | 1,056 (-6%) | 10mo | $134,999 | $128 | 43 |
| 2541 Mecom Dr | 0.73mi | 3/1.5 (+1) | 1,180 (+5%) | 10mo | $146,350 | $124 | 42 |
| 332 Prospect St | 0.70mi | 3/2.0 (+1) | 1,200 (+7%) | 13mo | $95,000 | $79 | 36 |
Match score weights: distance 35% · size 25% · config 20% · recency 20%. Top-matched comps best support the ARV.
Projected returns pro-forma
-0.3% appreciation · 3.0% rent growth · sell at horizon
- IRR
- 17.4%
- Equity multiple
- 1.82×
- Total profit
- $15,923
- Equity at exit
- $19,003
- IRR
- 22.2%
- Equity multiple
- 3.39×
- Total profit
- $46,144
- Equity at exit
- $22,035
Cash invested: $19,320 (down + closing). Projections, not guarantees.
Landlord ↔ Tenant lean methodology
- Overall (STATE)
- 90 Strongly Landlord-Friendly
- State Louisiana
- 90 Strongly Landlord-Friendly · R+12
- County
- — inherits STATE
- City
- — inherits STATE
ZIP-level market 71101
- Home prices YoY
- -0.4%
- Active inventory
- 61
- Price-to-rent
- 6.3×
Monthly cashflow live
- Estimated rent
- $918 high interval (Pro) →
- Mortgage (P&I)
- −$362
- Tax from tax record
- −$37 /mo · $450/yr
- Insurance
- −$29
- HOA
- −$0
- Vacancy / Maint / Mgmt
- −$193
- Net cashflow
- $297
Break-even live
UW: 25.0% down · 7.5% · 30yr · 1.5% tax · 5.0% vac · 8.0% maint · 8.0% mgmt
Financing live
Cash to close
- Down payment
- $17,250
- Closing costs
- $2,070
- Reserves months
- —
- Total cash needed
- —
Loan-product check · same deal, 3 products live
Conventional
25% down · 7.5% · 30yr
- Down + closing
- —
- Monthly P&I
- —
- Monthly cashflow
- —
- DSCR
- —
- Eligible?
- —
Personal DTI + credit; lowest rate.
DSCR
20% down · 8.5% · 30yr
- Down + closing
- —
- Monthly P&I
- —
- Monthly cashflow
- —
- DSCR
- —
- Eligible?
- —
No personal income docs; deal must DSCR.
Hard money
10% down · 12.0% · 12mo
- Down + closing
- —
- Monthly P&I
- —
- Monthly cashflow
- —
- DSCR
- —
- Eligible?
- —
Short-term bridge; refi at stabilization.
Rent comps 40 comps
| Address | Beds | Baths | Sqft | Rent | $/sqft | DOM | Units | Dist |
|---|---|---|---|---|---|---|---|---|
| 126 E Olive St Shreveport, LA | 2.0 | 1.0 | 1200 | $1,500 | $1.25 | 13d | 1 | 0.15mi |
| 143 E Herndon St Unit 143 Shreveport, LA | 2.0 | 1.0 | 1200 | $830 | $0.69 | 21d | 1 | 0.17mi |
| 103 E Merrick St Shreveport, LA | 2.0 | 1.0 | 1200 | $900 | $0.75 | 44d | 1 | 0.24mi |
| 127 Herndon St Shreveport, LA | 2.0 | 1.0 | 1325 | $800 | $0.60 | 13d | 1 | 0.27mi |
| 253 E Jordan St Unit 251 Shreveport, LA | 2.0 | 1.0 | 784 | $900 | $1.15 | 43d | 1 | 0.28mi |
| 202 E College St Apt 2 Shreveport, LA | 1.0 | 1.0 | 800 | $600 | $0.75 | 43d | 1 | 0.38mi |
| 114 Egan St Shreveport, LA | 1.0 | 1.0 | 800 | $550 | $0.69 | 43d | 1 | 0.42mi |
| 204 Boulevard St Shreveport, LA | 2.0 | 1.0 | 1028 | $1,195 | $1.16 | 43d | 1 | 0.43mi |
| 1225 Pecan St Unit B Shreveport, LA | 3.0 | 2.0 | 1070 | $900 | $0.84 | 21d | 1 | 0.50mi |
| 320 College St Unit A Shreveport, LA | 1.0 | 1.0 | 800 | $650 | $0.81 | 21d | 1 | 0.51mi |
| 2515 Centenary Blvd Shreveport, LA | 2.0 | 1.0 | 1200 | $2,500 | $2.08 | 13d | 1 | 0.55mi |
| 140 E Wilkinson St Shreveport, LA | 3.0 | 3.0 | 1174 | $1,300 | $1.11 | 21d | 1 | 0.55mi |
| 1147 Cornwell Ave Unit 1 Shreveport, LA | 3.0 | 2.0 | 1200 | $895 | $0.75 | 13d | 1 | 0.57mi |
| 140 Wilkinson St Unit 142 Shreveport, LA | 3.0 | 3.0 | 1174 | $1,300 | $1.11 | 21d | 1 | 0.60mi |
| 140 Wilkinson St Unit 140 Shreveport, LA | 2.0 | 1.0 | 1000 | $1,200 | $1.20 | 21d | 1 | 0.60mi |
| 406 College St Shreveport, LA | 2.0 | 1.0 | 1215 | $900 | $0.74 | 43d | 1 | 0.61mi |
| 2618 Roosevelt Ave Shreveport, LA | 3.0 | 1.0 | 845 | $1,000 | $1.18 | 21d | 1 | 0.62mi |
| 315 Dalzell St Shreveport, LA | 2.0 | 2.5 | 1372 | $1,100 | $0.80 | 43d | 1 | 0.63mi |
| 431 College St Shreveport, LA | 2.0 | 2.0 | 1100 | $850 | $0.77 | 13d | 1 | 0.66mi |
| 409 Egan St Shreveport, LA | 2.0 | 1.0 | 1000 | $725 | $0.72 | 43d | 1 | 0.67mi |
| 2506 Mecom Dr Shreveport, LA | 3.0 | 1.5 | 1433 | $1,350 | $0.94 | 13d | 1 | 0.68mi |
| 342 Prospect St Shreveport, LA | 1.0 | 1.0 | 800 | $650 | $0.81 | 21d | 1 | 0.68mi |
| 315 Robinson Pl Shreveport, LA | 2.0 | 1.0 | 1161 | $800 | $0.69 | 13d | 1 | 0.71mi |
| 523 Wichita St Shreveport, LA | 1.0 | 1.0 | 800 | $650 | $0.81 | 21d | 1 | 0.73mi |
| 451 Egan St Shreveport, LA | 3.0 | 1.5 | 1300 | $750 | $0.58 | 13d | 1 | 0.74mi |
| 533 Merrick St Unit C Shreveport, LA | 1.0 | 1.0 | 825 | $595 | $0.72 | 21d | 1 | 0.77mi |
| 1535 River Parkway Blvd Shreveport, LA | 1.0–3.0 | 1.0–2.0 | 928 | $1,740 | $1.88 | 13d | 10 | 0.77mi |
| 557 Merrick St Shreveport, LA | 1.0 | 1.0 | 950 | $725 | $0.76 | 43d | 1 | 0.81mi |
| 517 Stoner Ave Shreveport, LA | 2.0 | 1.0 | 1100 | $625 | $0.57 | 43d | 1 | 0.82mi |
| 2615 Judith Pl Shreveport, LA | 3.0 | 2.0 | 1450 | $1,600 | $1.10 | 13d | 1 | 0.84mi |
| 546 Dalzell St Shreveport, LA | 2.0 | 1.0 | 1000 | $875 | $0.88 | 21d | 1 | 0.85mi |
| 818 E Washington St Shreveport, LA | 3.0 | 1.0 | 1100 | $1,300 | $1.18 | 21d | 1 | 0.91mi |
| 649 Merrick St Shreveport, LA | 1.0 | 1.0 | 700 | $650 | $0.93 | 13d | 1 | 0.93mi |
| 314 Kings Hwy Shreveport, LA | 1.0 | 1.0 | 1200 | $700 | $0.58 | 43d | 1 | 0.97mi |
| 708 College St Shreveport, LA | 2.0 | 1.0 | 1156 | $925 | $0.80 | 13d | 1 | 0.97mi |
| 1301 Coates Bluff Dr Shreveport, LA | 1.0–2.0 | 1.0–2.0 | 1004 | $2,300 | $2.29 | 13d | 11 | 1.01mi |
| 642 Robinson Pl Shreveport, LA | 3.0 | 1.0 | 1500 | $1,275 | $0.85 | 21d | 1 | 1.02mi |
| 336 Atkins Ave Shreveport, LA | 2.0 | 1.0 | 912 | $900 | $0.99 | 43d | 1 | 1.04mi |
| 640 Kirby Pl Unit 640 Shreveport, LA | 1.0 | 1.0 | 850 | $600 | $0.71 | 21d | 1 | 1.09mi |
| 1844 Line Ave Unit 2 Shreveport, LA | 1.0 | 1.0 | 750 | $850 | $1.13 | 21d | 1 | 1.10mi |
Listing history 18 events
-
2026-06-16days on market $69,000 Active 21 DOM
-
2026-06-15days on market $69,000 Active 20 DOM
-
2026-06-14days on market $69,000 Active 18 DOM
-
2026-06-13days on market $69,000 Active 17 DOM
-
2026-06-10days on market $69,000 Active 15 DOM
-
2026-06-09days on market $69,000 Active 14 DOM
-
2026-06-08days on market $69,000 Active 13 DOM
-
2026-06-07days on market $69,000 Active 12 DOM
-
2026-06-05days on market $69,000 Active 9 DOM
-
2026-06-03days on market $69,000 Active 8 DOM
-
2026-06-02days on market $69,000 Active 7 DOM
-
2026-06-01days on market $69,000 Active 6 DOM
-
2026-05-31days on market $69,000 Active 5 DOM
-
2026-05-30days on market $69,000 Active 4 DOM
-
2026-05-26$69,000 Active
-
2011-03-07soldstatus $42,000
-
2006-08-15soldstatus
-
1998-05-29soldstatus
ⓘ Source: listings_history table (triggers on properties + properties_extension) + one-shot
backfill from property_details.listing_events for pre-trigger history.
Tax reassessment forecast LA · Resets to sale price
- Current annual tax
- $450 · $37/mo
- Projected year-2 tax
- $450 · $37/mo
- Expected delta
- $0/yr ($0/mo · 0.0%)
ⓘ Screening estimate from a state-policy table — verify with the county assessor before closing.
Climate risk First Street
- Flood 1/10 Low FEMA zone X (unshaded) · 0% chance over 30 yrs
- Wildfire 1/10 Low
- Heat 7/10 Severe 7 d/yr ≥110°F today · 21 d/yr by 30 yrs out
- Wind 6/10 Major 66% chance of damaging wind over 30 yrs
- Air quality 2/10 Low 1 unhealthy d/yr today · 2 by 30 yrs out
Nearby sold comps map
Loading sold comps map…
Walkable amenities ~0.75 mi
Loading nearby amenities…
Taxation est. · year 1
- Rental income
- $11,017
- − Mortgage interest
- −$3,865
- − Property taxes
- −$450
- − Insurance
- −$345
- − Repairs & maintenance
- −$881
- − Management
- −$881
- − Depreciation
- −$2,007
- Taxable income
- $2,587
- Est. tax owed @ 24.0%
- −$621
- After-tax cash flow
- $2,945/yr
For passive investors: Depreciation is non-cash, so a rental often shows a tax loss while cash-flowing — sheltering income. Rental losses are passive: they offset passive income freely, and up to $25,000/yr can offset ordinary (W-2) income if you actively participate and your MAGI is under $100k (phasing out to $0 by $150k); unused losses carry forward. On sale, claimed depreciation is recaptured at up to 25%, and gains may owe capital-gains tax (a 1031 exchange can defer both). Figures are a year-1 estimate at your 24.0% rate — not tax advice; consult a CPA.
Schools (NCES district)
- District
- Caddo Parish
- NCES district ID
- 2200300
- Math proficiency
- 21% ▼ -33.00%
- Reading proficiency
- 32% ▼ -30.00%
- Median HH income
- $39,227
- Composite
- 22.23/100
- National rank
- #8148
- State rank
- #53 of 98 in LA
Livability — Shreveport
- Score
- 59/100
- State rank
- #270
- US rank
- #19730
Category grades
Schools grade is shown separately in the Schools card above.
Census & demographics
- Census place
- Shreveport, LA
- County
- Caddo Parish · 178,536 people
- City population
- 164,123
- Metro
- Shreveport-Bossier City, LA
- Population (ZIP)
- 6,415
- Household income
- $19,351
- Rent vs Own
- Severe rent burden
- 702.0
Population outlook (Caddo County) Hauer SSP2
- Today (2025)
- 243,190 people
- By 2030
- 237,231 · -2.5%
- By 2040
- 222,502 · -8.5%
- By 2050
- 206,516 · -15.1%
- By 2075
- 165,706 · -31.9%
- By 2100
- 122,262 · -49.7%
Race, ethnicity, and origin ACS 2023
- Neighborhood character
- Majority Black (63%)
- Race & ethnicity
- Black 63% White 29% Hispanic / Latino 5% Two or more races 2%
- Common ancestry
- Lithuanian 1% Slovak 1%
- Foreign-born
- 2% · China
- Languages at home
- 98% English-only · Tagalog/Filipino 0%
Political lean MEDSL · Caddo
- 2024 margin
- Toss-up / Even · D 51.6% · R 47.0% · Other 1.4%
- 2008→2024 swing
- +1.6pp toward D · 2008: 3.0pp · 2024: 4.6pp
- All cycles
- 2024: D+4.6 2020: D+6.8 2016: D+4.2 2012: D+4.9 2008: D+3.0
Not yet ingested
- Civics
- —
Market trends
- HPI YoY
- ▼ -0.30%
- Current HPI
- 74.2131
- Rent YoY
- —
- Metro
- Shreveport-Bossier City, LA
- State GDP YoY
- ▲ 3.29%
- F500 in state
- 10
Industry mix (Fortune 500 HQ in LA)
| Industry | F500 HQs | Revenue |
|---|---|---|
| Telecommunications | 2 | $23B |
|
||
| Utilities | 1 | $12B |
|
||
| Wholesale / Distribution | 1 | $5B |
|
||
| Advertising | 1 | $2B |
|
||
Price history
+64.3% since first listed4 events — show timeline
- 2026-05-26 Listed $69,000 NTREIS
- 2011-03-07 Sold (Public Records) $42,000 Public Records
- 2006-08-15 Sold (Public Records) — Public Records
- 1998-05-29 Sold (Public Records) — Public Records
Property tax history
-1.3%/yrLatest (2025): $450 · +0.4% YoY. Source: county tax records.
Cash-flow waterfall
monthlySold comps — $/sqft
last 12 mo · ≤1 miLoading sold comps…