 5-Plex
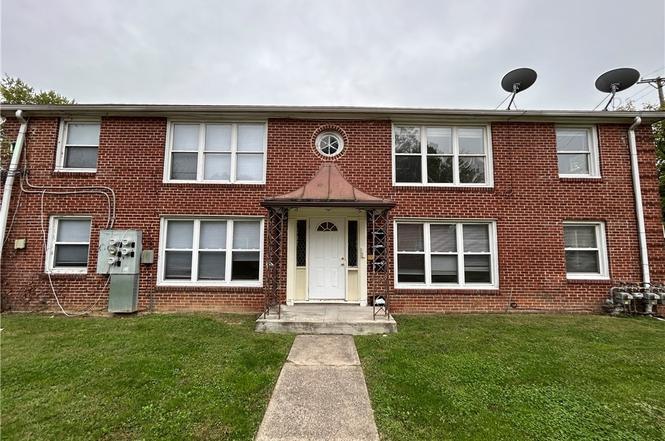
1309 Salem Ave · Dayton, OH
Flood risk No data
- FEMA flood zone
- —
- Chance of flooding over 30 yrs
- —
- Est. flood insurance / yr
- —
Fire risk No data
- Est. fire insurance / yr
- —
Heat risk No data
- Hot days now (above threshold)
- —
- Hot days in 30 yrs
- —
Wind risk No data
- Chance of severe wind over 30 yrs
- —
Air-quality risk No data
- Unhealthy air days now
- —
- Unhealthy air days in 30 yrs
- —
Risk factors via First Street. Map © Google.
Why this score? — see what drove the C grade
The composite is a weighted blend of 9 inputs, each scored 0–100. Each bar is that input's sub-score; the figure is the points it added to the 100-point composite (weight × sub-score).
- Cash flow +25.2/30.0
- DSCR +8.3/10.0
- ARV discount +7.5/15.0
- 1% rule +5.7/10.0
- Rent growth +3.3/5.0
- Livability +3.2/5.0
- Condition / age +2.5/5.0
- Schools +1.3/10.0
- Appreciation +0.0/10.0
$475,000
🖨 Deal sheet 📄 Offer letter ✓ Due diligence
Multi-family units
County records classify this as Multi-Family (5+ Unit). Listing-text estimate: 5 units. confirmed
5+ unit building — per-unit beds/baths from public records are typically unavailable; the breakdown below (if shown) is an estimate from the listing text.
Listing remarks
Solid multifamily investment opportunity featuring 8 total units across two separate buildings, each offering 4 units, conveniently located in Dayton. This setup provides operational flexibility and diversified risk with two structures on one investment. The property offers strong rental demand given its proximity to major roadways, employment centers, shopping, and public transportation. Ideal for investors looking to add cash-flowing multifamily assets to their portfolio or execute a value-add strategy through renovations and rent optimization. With multiple income streams and a proven multifamily layout, this property is well-suited for both seasoned investors and those looking to scale
Key facts
- Built 1947
- Listed 128 days
Property features AI
Finance
- Financial info: Property is for sale; Gross annual income reported: $63,180; Tenants pay electricity, gas, and water
Exterior
- Parking: No garage; parking lot available
- Utilities: Natural gas available; Public water; Sewer available
- Home design: Two-story building; Brick and frame construction
- Construction: Brick and frame construction
- Exterior features: Irregular-shaped lot; Residential zoning
Interior
- Bedrooms: Two-bedroom units (8 total units)
- Bathrooms: Eight full bathrooms
- Heating & cooling: Forced air heating (natural gas); Window air conditioning units
- Interior features: Full unfinished basement
- Laundry & utility: Washer and dryer included; Gas water heater
Neighborhood map
What this means for you Summary
Snapshot
- This is a 5 × 3-bed/?-bath units multifamily listed at $475k.
Deal economics
- At list price, monthly cash flow is $1k ($13k/yr) — positive. Per door: $214/mo.
- The deal already cash-flows at list — no discount required.
- Meets the 1% rule at list price ($5k rent vs $475k).
- Recommended offer: $418k (12.0% below list) — sets the bar for market timing.
- Cap rate 9.0% vs local median 7.4% in Dayton — meaningfully above typical; check what's discounted (condition, days-on-market, listing class) to confirm the premium yield is real.
Location & tenants
- Location reads 65/100 on livability (#716 in OH) — a middle-class / working-renter tenant base. Strengths: cost of living A+, housing A+, health & safety A; Watch: schools C-, amenities C-, crime F.
- Dayton City (urban): math 12% / reading 21% proficiency, ranked #641 of 656 in OH (top 98%) — low school quality limits family demand, transient renter base, plan for 1-2y turnover; 74% free/reduced lunch — lower-income household profile, screen leases tightly.
- Market conditions: Rents rising (+3.0%/yr); 156 active listings in the ZIP; lower-income renter base — watch delinquency; 907 units permitted in Montgomery County in 2024 (416 in 5+ unit buildings).
- At $5,099/mo this rent would consume 146% of the median local household income ($42k/yr) (locally 1504% of renters already pay >50% of income on rent) — very limited rent-growth headroom before tenants either downsize or default.
Forward outlook
- Local home prices are declining (-3.0%/yr); year-one equity from $3k of loan paydown is wiped out by about $14k of value loss. Plan a longer hold.
- Montgomery County population projected at -10% by 2050 — secular population decline; favor cash flow + early exit over multi-decade hold.
Negotiation context
- It's been on market 128 days — a 12% lower offer ($418k) is reasonable based on typical stale-listing flexibility.
- 3 sale attempts since 18y ago; this cycle's ask has dropped $75k (14%) from the opening price — seller is motivated, your offer sets the floor, not the list.
- Current owner paid $36k; list at $475k implies a 1219% gain — meaningful room to come down on a strong offer.
Risks & watch-outs
- Watch-outs: built in 1947 — expect roof / HVAC / electrical / plumbing capex.
Questions for the listing agent
- It's been on market 128 days. Have you received any prior offers? Is the seller open to a 12% concession, seller financing, or rate buy-down credit?
- Can we see the unit-by-unit rent roll, current vacancy, and any below-market leases? What's the average tenancy length?
- What capital expenditures (roof, boiler, parking lot, exteriors) have been made in the last 5 years, and what's planned in the next 2?
- Built in 1947 — when were the roof, HVAC, electrical panel, plumbing, and water heater last replaced?
- Why hasn't it sold? Are there any deal-killer items the seller is aware of (foundation, flood, title, zoning, code violations)?
- Is there a deadline driving the sale (1031 exchange, divorce, estate, relocation)? That informs how much negotiation room exists.
- Crime grade is F in this area — have there been break-ins, vandalism, or insurance claims at this property in the last 3 years? What carrier currently insures it and at what premium?
- What's the average days-on-market for RENTAL listings here right now (not sales)? A rising rental-DOM trend means longer vacancies and softer asking-rent achievability than the comps imply.
- What's the recent tenant-quality profile in this submarket — average credit score on applications, eviction rate, late-payment / NSF rate, and stable-employment percentage? A property-management company in the area should have these aggregated.
- How much new apartment / multifamily construction is in the pipeline within 1–3 miles? Heavy new supply (>2% of stock underway) typically softens rents 12–24 months out; light construction supports rent growth.
Investment metrics
- 1% rule
- 1.07% ✓
- Cap rate
- 9.00%
- Cash-on-cash
- 9.67%
- DSCR
- 1.43
- GRM
- 7.8
CMA / ARV
No comps found within radius.
Projected returns pro-forma
-3.0% appreciation · 3.03% rent growth · sell at horizon
- IRR
- -1.7%
- Equity multiple
- 0.93×
- Total profit
- $-8,709
- Equity at exit
- $70,824
- IRR
- 8.0%
- Equity multiple
- 1.60×
- Total profit
- $80,405
- Equity at exit
- $41,069
Cash invested: $133,000 (down + closing). Projections, not guarantees.
Landlord ↔ Tenant lean methodology
- Overall (STATE)
- 73 Landlord-Friendly
- State Ohio
- 73 Landlord-Friendly · R+6
- County
- — inherits STATE
- City
- — inherits STATE
ZIP-level market 45406
- Rents YoY
- 3.0%
- Active inventory
- 156
- Price-to-rent
- 38.8×
Monthly cashflow live
- Estimated rent
- $5,099 high interval (Pro) →
- Mortgage (P&I)
- −$2,491
- Tax from tax record
- −$268 /mo · $3,217/yr
- Insurance
- −$198
- HOA
- −$0
- Vacancy / Maint / Mgmt
- −$1,071
- Net cashflow
- $1,071
Break-even live
5-unit breakdown (identical units grouped — click to expand)
| Units | Beds | Baths | Est. rent |
|---|---|---|---|
| 5× units | 3 | — | $5,100 |
| #1 | 3 | — | $1,020 |
| #2 | 3 | — | $1,020 |
| #3 | 3 | — | $1,020 |
| #4 | 3 | — | $1,020 |
| #5 | 3 | — | $1,020 |
| Total (5 units) | $5,099 | ||
UW: 25.0% down · 7.5% · 30yr · 1.5% tax · 5.0% vac · 8.0% maint · 8.0% mgmt
Financing live
Cash to close
- Down payment
- $118,750
- Closing costs
- $14,250
- Reserves months
- —
- Total cash needed
- —
Loan-product check · same deal, 3 products live
Conventional
25% down · 7.5% · 30yr
- Down + closing
- —
- Monthly P&I
- —
- Monthly cashflow
- —
- DSCR
- —
- Eligible?
- —
Personal DTI + credit; lowest rate.
DSCR
20% down · 8.5% · 30yr
- Down + closing
- —
- Monthly P&I
- —
- Monthly cashflow
- —
- DSCR
- —
- Eligible?
- —
No personal income docs; deal must DSCR.
Hard money
10% down · 12.0% · 12mo
- Down + closing
- —
- Monthly P&I
- —
- Monthly cashflow
- —
- DSCR
- —
- Eligible?
- —
Short-term bridge; refi at stabilization.
Listing history 29 events
-
2026-06-18days on market $475,000 Active 128 DOM
-
2026-06-17days on market $475,000 Active 127 DOM
-
2026-06-16days on market $475,000 Active 126 DOM
-
2026-06-15days on market $475,000 Active 125 DOM
-
2026-06-14days on market $475,000 Active 123 DOM
-
2026-06-13days on market $475,000 Active 122 DOM
-
2026-06-10days on market $475,000 Active 120 DOM
-
2026-06-09days on market $475,000 Active 119 DOM
-
2026-06-08days on market $475,000 Active 118 DOM
-
2026-06-07days on market $475,000 Active 117 DOM
-
2026-06-05days on market $475,000 Active 114 DOM
-
2026-06-03days on market $475,000 Active 113 DOM
-
2026-06-02days on market $475,000 Active 112 DOM
-
2026-06-01days on market $475,000 Active 111 DOM
-
2026-05-31days on market $475,000 Active 110 DOM
-
2026-04-29historical ActiveUnderContract
-
2026-03-15price $500,000
-
2026-03-03price $525,000
-
2026-02-06$550,000 Active
-
2021-11-24historical
-
2021-09-24$540,000 Active
-
2010-03-31historical
-
2008-08-08$69,900
-
2006-11-22soldstatus $36,000
-
2004-10-26soldstatus $140,000
-
1999-01-05soldstatus $200,000
-
1996-12-06soldstatus $175,000
-
1996-12-05soldstatus $175,000
-
1987-12-04soldstatus $105,000
ⓘ Source: listings_history table (triggers on properties + properties_extension) + one-shot
backfill from property_details.listing_events for pre-trigger history.
Tax reassessment forecast OH · Partial reset (capped growth)
- Current annual tax
- $3,217 · $268/mo
- Projected year-2 tax
- $5,313 · $443/mo
- Expected delta
- +$2,097/yr (+$175/mo · 65.2%)
ⓘ Screening estimate from a state-policy table — verify with the county assessor before closing.
Nearby sold comps map
Loading sold comps map…
Walkable amenities ~0.75 mi
Loading nearby amenities…
Taxation est. · year 1
- Rental income
- $61,188
- − Mortgage interest
- −$26,607
- − Property taxes
- −$3,217
- − Insurance
- −$2,375
- − Repairs & maintenance
- −$4,895
- − Management
- −$4,895
- − Depreciation
- −$13,818
- Taxable income
- $5,381
- Est. tax owed @ 24.0%
- −$1,291
- After-tax cash flow
- $11,564/yr
For passive investors: Depreciation is non-cash, so a rental often shows a tax loss while cash-flowing — sheltering income. Rental losses are passive: they offset passive income freely, and up to $25,000/yr can offset ordinary (W-2) income if you actively participate and your MAGI is under $100k (phasing out to $0 by $150k); unused losses carry forward. On sale, claimed depreciation is recaptured at up to 25%, and gains may owe capital-gains tax (a 1031 exchange can defer both). Figures are a year-1 estimate at your 24.0% rate — not tax advice; consult a CPA.
Schools (NCES district)
- District
- Dayton City
- NCES district ID
- 3904384
- Math proficiency
- 12% ▼ -12.00%
- Reading proficiency
- 21% ▼ -11.00%
- Median HH income
- $28,688
- Composite
- 12.94/100
- National rank
- #9579
- State rank
- #641 of 656 in OH
Livability — Dayton
- Score
- 65/100
- State rank
- #716
- US rank
- #12895
Category grades
Schools grade is shown separately in the Schools card above.
Census & demographics
- Census place
- Dayton, OH
- County
- Montgomery County · 459,541 people
- City population
- 164,387
- Metro
- Dayton-Kettering, OH
- Population (ZIP)
- 19,991
- Household income
- $41,796
- Rent vs Own
- Severe rent burden
- 1504.0
Population outlook (Montgomery County) Hauer SSP2
- Today (2025)
- 523,241 people
- By 2030
- 514,948 · -1.6%
- By 2040
- 493,378 · -5.7%
- By 2050
- 469,639 · -10.2%
- By 2075
- 418,360 · -20.0%
- By 2100
- 353,315 · -32.5%
Race, ethnicity, and origin ACS 2023
- Neighborhood character
- Predominantly Black (75%)
- Race & ethnicity
- Black 75% White 16% Two or more races 7% Hispanic / Latino 3%
- Common ancestry
- Italian 2% Lithuanian 1% Slovak 1%
- Foreign-born
- 2% · Canada
- Languages at home
- 97% English-only · Spanish 1%
Political lean MEDSL · Montgomery
- 2024 margin
- Toss-up / Even · D 49.8% · R 49.3%
- 2008→2024 swing
- -5.8pp toward R · 2008: 6.2pp · 2024: 0.5pp
- All cycles
- 2024: D+0.5 2020: D+2.2 2016: R+1.2 2012: D+3.1 2008: D+6.2
Not yet ingested
- Civics
- —
Market trends
- HPI YoY
- ▼ -113.75%
- Current HPI
- 197.1302
- Rent YoY
- ▲ 3.03%
- Metro
- Dayton-Kettering, OH
- State GDP YoY
- ▲ 1.98%
- F500 in state
- 48
Industry mix (Fortune 500 HQ in OH)
| Industry | F500 HQs | Revenue |
|---|---|---|
| Insurance | 3 | $145B |
|
||
| Industrial Machinery | 3 | $49B |
|
||
| Financial Services | 3 | $24B |
|
||
| Consumer Goods | 2 | $93B |
|
||
| Aerospace / Defense | 2 | $47B |
|
||
| Utilities | 2 | $33B |
|
||
Price history
+376.2% since first listed14 events — show timeline
- 2026-04-29 Contingent — Dayton MLS
- 2026-03-15 Price Changed $500,000 Dayton MLS
- 2026-03-03 Price Changed $525,000 Dayton MLS
- 2026-02-06 Listed $550,000 Dayton MLS
- 2021-11-24 Listing Removed — Dayton MLS
- 2021-09-24 Listed $540,000 Dayton MLS
- 2010-03-31 Listing Removed — Dayton MLS
- 2008-08-08 Listed $69,900 Dayton MLS
- 2006-11-22 Sold (Public Records) $36,000 Public Records
- 2004-10-26 Sold (Public Records) $140,000 Public Records
- 1999-01-05 Sold (Public Records) $200,000 Public Records
- 1996-12-06 Sold (Public Records) $175,000 Public Records
- 1996-12-05 Sold (Public Records) $175,000 Public Records
- 1987-12-04 Sold (Public Records) $105,000 Public Records
Property tax history
+2.3%/yrLatest (2025): $3,217 · -1.0% YoY. Source: county tax records.
Cash-flow waterfall
monthlySold comps — $/sqft
last 12 mo · ≤1 miLoading sold comps…