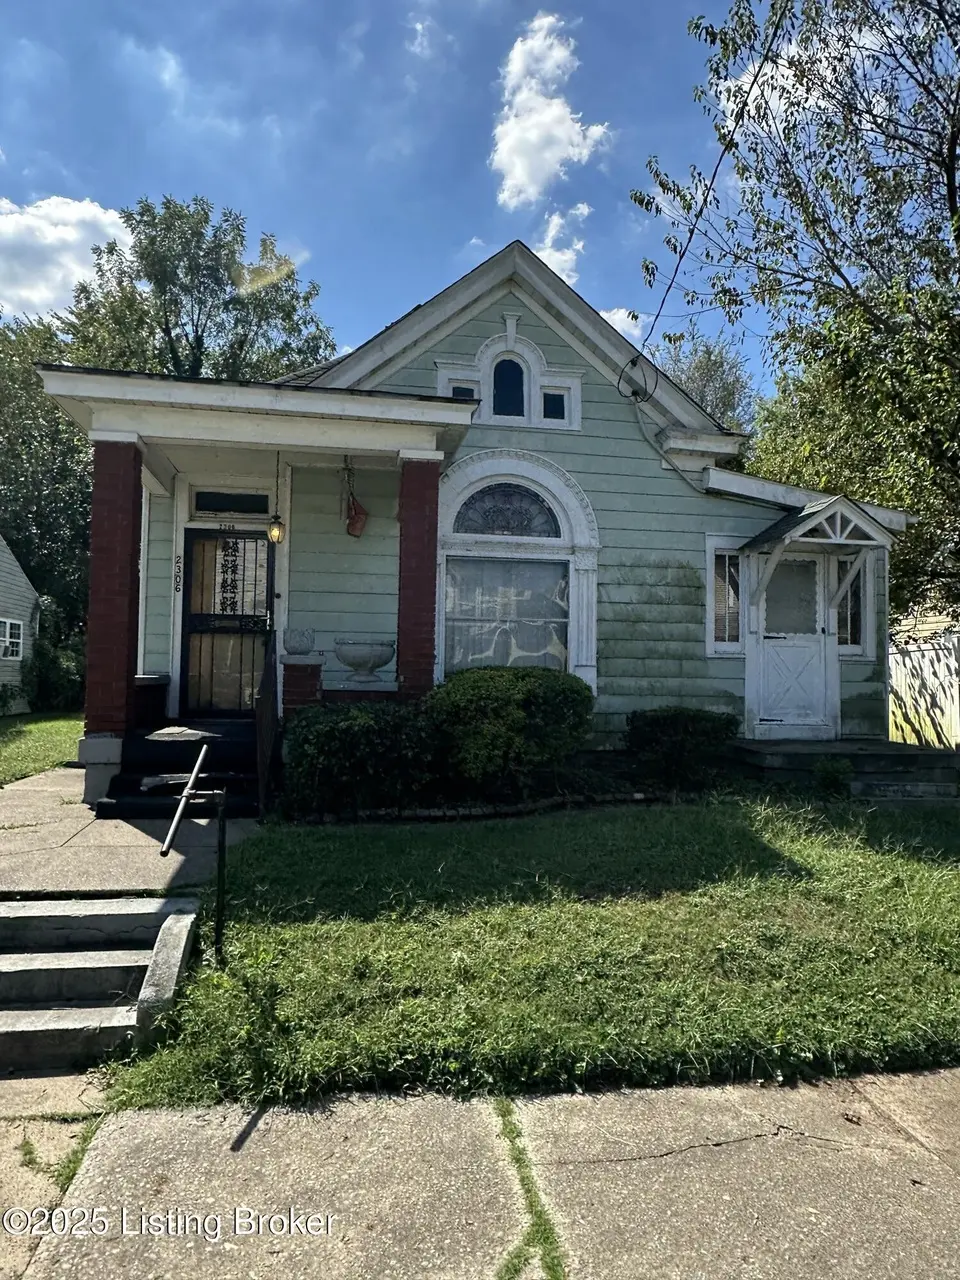
2306 Bolling Ave · Louisville, KY
Flood risk 6/10 · Moderate
- FEMA flood zone
- X (unshaded)
- Chance of flooding over 30 yrs
- 0.69%
- Est. flood insurance / yr
- $507 – $1,088
Fire risk 1/10 · Minimal
- Est. fire insurance / yr
- $839 – $1,559
Heat risk 5/10 · Moderate
- Hot days now (above 104°F)
- 7 days/yr
- Hot days in 30 yrs
- 19 days/yr
Wind risk 2/10 · Minimal
- Chance of severe wind over 30 yrs
- 1.0%
Air-quality risk 2/10 · Minimal
- Unhealthy air days now
- 1 days/yr
- Unhealthy air days in 30 yrs
- 3 days/yr
Risk factors via First Street. Map © Google.
Why this score? — see what drove the A- grade
The composite is a weighted blend of 9 inputs, each scored 0–100. Each bar is that input's sub-score; the figure is the points it added to the 100-point composite (weight × sub-score).
- Cash flow +30.0/30.0
- 1% rule +10.0/10.0
- DSCR +10.0/10.0
- Appreciation +10.0/10.0
- ARV discount +7.5/15.0
- Rent growth +4.5/5.0
- Livability +3.2/5.0
- Condition / age +2.5/5.0
- Schools +2.3/10.0
$55,000
🖨 Deal sheet (PDF) 📄 Offer letter ✓ Due diligence
Listing remarks
Here is a perfect opportunity to let your imagination run wild. With 1800 square feet, 1.5 bathrooms, and a large back yard, the options are limitless for making this home what you envision. Investors take note and schedule your personal showing today.
Key facts
- 6,752 sq ft lot
- Built 1910
- Listed 69 days
Property features AI
Finance
- HOA & community: No association fee
Exterior
- Utilities: Electricity connected
- Home design: Single-family residence; One-story; Built in 1910; Other architectural style
- Construction: Wood frame with aluminum siding; Shingle roof
- Exterior features: Privacy fencing; Chain link fencing; Lot dimensions approximately 50 x 135
Interior
- Kitchen: Kitchen on the first floor
- Bedrooms: Three bedrooms total; Two bedrooms on the first floor; Primary bedroom on the first floor
- Bathrooms: One full bathroom; One half bathroom
- Heating & cooling: Electric heating; One HVAC unit
- Interior features: Six total rooms; Four closets; Cellar basement; First-floor laundry
- Laundry & utility: Laundry located on the first floor
Neighborhood map
What this means for you Summary
Snapshot
- This is a 3-bed/1.5-bath single-family listed at $55k.
Deal economics
- At list price, monthly cash flow is $687 ($8k/yr) — positive.
- The deal already cash-flows at list — no discount required.
- Meets the 1% rule at list price ($1k rent vs $55k).
- Recommended offer: $52k (6.0% below list) — sets the bar for market timing.
Location & tenants
- Location reads 63/100 on livability (#333 in KY) — a middle-class / working-renter tenant base. Strengths: cost of living A+, housing A+; Watch: employment C-, health & safety D+, crime F.
- Jefferson County (urban): math 19% / reading 35% proficiency, ranked #121 of 165 in KY (top 73%) — low school quality limits family demand, transient renter base, plan for 1-2y turnover.
- Zoned schools: Mcferran Preparatory Academy (math 2% / reading 8%, grade F, #670 of 676 statewide, top 100%, 691 students, 83% FRL); Carrithers Middle (math 10% / reading 36%, grade F, #197 of 217 statewide, top 92%, 583 students, 60% FRL); Iroquois High (math 12% / reading 8%, grade F, #245 of 254 statewide, top 97%, 1,090 students, 74% FRL) — zoned schools average 72% FRL vs 56% district-wide (16 pts higher); higher-poverty schools than district average — tighter screening recommended.
- Zoned-school proficiency averages 13% at this address vs 27% district-wide (-14 pts) — the specific schools serving this property underperform the Jefferson County average; the district grade overstates school quality for this exact location.
- Market conditions: Rents rising fast (+8.1%/yr); 93 active listings in the ZIP; 14 comparable units currently listed for rent nearby; rentals at typical pace (median 23d on market — plan ~3-4 weeks tenant-placement turnaround); lower-income renter base — watch delinquency; 2,836 units permitted in Jefferson County in 2024 (1,558 in 5+ unit buildings).
Forward outlook
- In year one you build about $6k of equity ($380 loan paydown + $6k appreciation (10.0% local appreciation)).
- Jefferson County population projected at +13% by 2050 — modest demand growth; plan on rents tracking national, not racing it.
- At projected returns (10.0% appreciation + 8.0% rent growth), your $15k cash investment doubles in ~2 years — after that, you're playing with house money.
- By year 6, paydown + projected appreciation supports a ~$35k cash-out refi (75% LTV) — recoverable capital for the next deal without selling this one.
Negotiation context
- It's been on market 70 days — a 6% lower offer ($52k) is reasonable based on typical stale-listing flexibility.
- 2 sale attempts; this cycle's ask has dropped $25k (31%) from the opening price — seller is motivated, your offer sets the floor, not the list.
Risks & watch-outs
- Watch-outs: built in 1910 — expect roof / HVAC / electrical / plumbing capex.
- Climate carrying-cost: major flood risk; extreme-heat days projected 7→19/yr by 2055 (HVAC capex compounding) — expect insurance premiums to compound above CPI over the hold.
Questions for the listing agent
- It's been on market 70 days. Have you received any prior offers? Is the seller open to a 6% concession, seller financing, or rate buy-down credit?
- Built in 1910 — when were the roof, HVAC, electrical panel, plumbing, and water heater last replaced?
- Why hasn't it sold? Are there any deal-killer items the seller is aware of (foundation, flood, title, zoning, code violations)?
- Is there a deadline driving the sale (1031 exchange, divorce, estate, relocation)? That informs how much negotiation room exists.
- Schools are D-rated, which usually means shorter tenancies and higher turnover. Who's the typical renter profile here, and what's been the actual vacancy rate?
- Crime grade is F in this area — have there been break-ins, vandalism, or insurance claims at this property in the last 3 years? What carrier currently insures it and at what premium?
- What's the average days-on-market for RENTAL listings here right now (not sales)? A rising rental-DOM trend means longer vacancies and softer asking-rent achievability than the comps imply.
- What's the recent tenant-quality profile in this submarket — average credit score on applications, eviction rate, late-payment / NSF rate, and stable-employment percentage? A property-management company in the area should have these aggregated.
- How much new for-sale + rental construction is in the pipeline within 1–3 miles? Heavy new supply typically softens prices + rents 12–24 months out; constrained supply supports both.
Investment metrics
- 1% rule
- 2.46% ✓
- Cap rate
- 21.28%
- Cash-on-cash
- 53.53%
- DSCR
- 3.38
- GRM
- 3.4
CMA / ARV
- ARV (on-the-fly)
- $163,890
- Comps found
- 12
Show comp detail 12 sales within ~0.75 mi
| Address | Dist | Beds/Ba | Sqft | Sold | Price | $/sf | Match |
|---|---|---|---|---|---|---|---|
| 1844 Bolling Ave | 0.17mi | 3/1.5 | 1,726 (-5%) | 6mo | $155,000 | $90 | 78 |
| 1365 Cypress St | 0.31mi | 3/1.5 | 1,764 (-3%) | 4mo | $165,000 | $94 | 77 |
| 2001 Wilson Ave | 0.47mi | 3/2.0 | 1,764 (-3%) | 8mo | $85,000 | $48 | 65 |
| 1811 Beech St | 0.60mi | 3/2.0 | 1,872 (+3%) | 2mo | $168,000 | $90 | 64 |
| 2307 W Lee St | 0.16mi | 4/2.0 (+1) | 1,600 (-12%) | 4mo | $172,000 | $108 | 62 |
| 2724 Hale Ave | 0.65mi | 3/1.5 | 1,891 (+4%) | 2mo | $55,000 | $29 | 61 |
| 2300 Oregon Ave | 0.65mi | 4/2.0 (+1) | 1,810 (-1%) | 4mo | $142,500 | $79 | 58 |
| 1703 Wilson Ave | 0.71mi | 3/1.5 | 1,896 (+4%) | 7mo | $32,000 | $17 | 54 |
| 1533 Beech St | 0.53mi | 4/2.0 (+1) | 1,660 (-9%) | 2mo | $120,000 | $72 | 52 |
| 1544 Catalpa St | 0.41mi | 4/2.5 (+1) | 1,596 (-12%) | 1mo | $185,000 | $116 | 50 |
| 2107 Ratcliffe Ave | 0.73mi | 3/2.0 | 1,706 (-6%) | 5mo | $198,000 | $116 | 49 |
| 2341 Grand Ave | 0.73mi | 3/1.5 | 2,002 (+10%) | 4mo | $129,900 | $65 | 45 |
Match score weights: distance 35% · size 25% · config 20% · recency 20%. Top-matched comps best support the ARV.
Projected returns pro-forma
10.0% appreciation · 8.0% rent growth · sell at horizon
- IRR
- 70.5%
- Equity multiple
- 6.25×
- Total profit
- $80,869
- Equity at exit
- $49,548
- IRR
- 66.2%
- Equity multiple
- 15.38×
- Total profit
- $221,462
- Equity at exit
- $106,853
Cash invested: $15,400 (down + closing). Projections, not guarantees.
Landlord ↔ Tenant lean methodology
- Overall (STATE)
- 83 Strongly Landlord-Friendly
- State Kentucky
- 83 Strongly Landlord-Friendly · R+16
- County
- — inherits STATE
- City
- — inherits STATE
ZIP-level market 40210
- Home prices YoY
- 12.1%
- Rents YoY
- 8.1%
- Active inventory
- 93
- Price-to-rent
- 3.4×
Monthly cashflow live
- Estimated rent
- $1,351 high interval (Pro) →
- Mortgage (P&I)
- −$288
- Tax est. 1.5%
- −$69 /mo · $825/yr
- Insurance
- −$23
- HOA
- −$0
- Vacancy / Maint / Mgmt
- −$284
- Net cashflow
- $687
Break-even live
Sensitivity live
| Price | -10% $725 | -5% $706 | +0% $687 | +5% $668 | +10% $649 |
|---|---|---|---|---|---|
| Rent | -10% $580 | -5% $634 | +0% $687 | +5% $740 | +10% $794 |
| Rate | -1.0pp $715 | -0.5pp $701 | base $687 | +0.5pp $673 | +1.0pp $658 |
UW: 25.0% down · 7.5% · 30yr · 1.5% tax · 5.0% vac · 8.0% maint · 8.0% mgmt
Financing live
Cash to close
- Down payment
- $13,750
- Closing costs
- $1,650
- Reserves months
- —
- Total cash needed
- —
Loan-product check · same deal, 3 products live
Conventional
25% down · 7.5% · 30yr
- Down + closing
- —
- Monthly P&I
- —
- Monthly cashflow
- —
- DSCR
- —
- Eligible?
- —
Personal DTI + credit; lowest rate.
DSCR
20% down · 8.5% · 30yr
- Down + closing
- —
- Monthly P&I
- —
- Monthly cashflow
- —
- DSCR
- —
- Eligible?
- —
No personal income docs; deal must DSCR.
Hard money
10% down · 12.0% · 12mo
- Down + closing
- —
- Monthly P&I
- —
- Monthly cashflow
- —
- DSCR
- —
- Eligible?
- —
Short-term bridge; refi at stabilization.
Rent comps 14 comps
| Address | Beds | Baths | Sqft | Rent | $/sqft | DOM | Units | Dist |
|---|---|---|---|---|---|---|---|---|
| 1774 Bolling Ave Louisville, KY | 3.0 | 2.0 | 1611 | $1,300 | $0.81 | 12d | 1 | 0.37mi |
| 1545 Catalpa St Louisville, KY | 4.0 | 1.5 | 1760 | $1,545 | $0.88 | 5d | 1 | 0.40mi |
| 1618 S 30th St Louisville, KY | 3.0 | 1.0 | 1896 | $1,235 | $0.65 | 18d | 1 | 0.63mi |
| 1705 1/2 Hale Ave Louisville, KY | 3.0 | 2.0 | 1257 | $1,400 | $1.11 | 12d | 1 | 0.82mi |
| 2912 Greenwood Ave Louisville, KY | 3.0 | 2.0 | 1362 | $1,150 | $0.84 | 18d | 1 | 0.92mi |
| 2825 Greenwood Ave #2 Louisville, KY | 2.0 | 1.0 | 1300 | $995 | $0.77 | 25d | 1 | 0.92mi |
| 2825 Greenwood Ave #4 Louisville, KY | 3.0 | 1.0 | 1440 | $1,250 | $0.87 | 25d | 1 | 0.92mi |
| 1847 W Kentucky St Louisville, KY | 2.0 | 1.0 | 1368 | $895 | $0.65 | 5d | 1 | 0.93mi |
| 1115 S 32nd St Louisville, KY | 3.0 | 1.0 | 1393 | $1,275 | $0.92 | 23d | 1 | 0.96mi |
| 1115 S 32nd St Louisville, KY | 3.0 | 1.0 | 1393 | $1,275 | $0.92 | 25d | 1 | 0.96mi |
| 3514 Grand Ave Louisville, KY | 3.0 | 1.5 | 1450 | $1,295 | $0.89 | 23d | 1 | 1.23mi |
| 820 Hazel St Louisville, KY | 4.0 | 2.0 | 1872 | $1,395 | $0.75 | 5d | 1 | 1.26mi |
| 737 S 33rd St Louisville, KY | 4.0 | 1.0 | 1356 | $1,595 | $1.18 | 25d | 1 | 1.43mi |
| 803 S 35th St Louisville, KY | 3.0 | 1.0 | 1486 | $1,350 | $0.91 | 25d | 1 | 1.46mi |
Listing history 20 events
-
2026-06-21days on market $55,000 Active 70 DOM
-
2026-06-18days on market $55,000 Active 67 DOM
-
2026-06-17days on market $55,000 Active 66 DOM
-
2026-06-16days on market $55,000 Active 65 DOM
-
2026-06-15days on market $55,000 Active 64 DOM
-
2026-06-13statusdays on market $55,000 Active 62 DOM
-
2026-06-10days on market $55,000 Active Under Contract 59 DOM
-
2026-06-09days on market $55,000 Active Under Contract 58 DOM
-
2026-06-08days on market $55,000 Active Under Contract 57 DOM
-
2026-06-07days on market $55,000 Active Under Contract 56 DOM
-
2026-06-03days on market $55,000 Active Under Contract 52 DOM
-
2026-06-02days on market $55,000 Active Under Contract 51 DOM
-
2026-06-01days on market $55,000 Active Under Contract 50 DOM
-
2026-05-31days on market $55,000 Active Under Contract 49 DOM
-
2026-05-19price $55,000
-
2026-04-29historical Active Under Contract
-
2026-04-12$80,000 Active
-
2025-10-17status Pending
-
2025-10-17historical
-
2025-10-03$80,000 Active
ⓘ Source: listings_history table (triggers on properties + properties_extension) + one-shot
backfill from property_details.listing_events for pre-trigger history.
Climate risk First Street
- Flood 6/10 Major FEMA zone X (unshaded) · 69% chance over 30 yrs
- Wildfire 1/10 Low
- Heat 5/10 Major 7 d/yr ≥104°F today · 19 d/yr by 30 yrs out
- Wind 2/10 Low 100% chance of damaging wind over 30 yrs
- Air quality 2/10 Low 1 unhealthy d/yr today · 3 by 30 yrs out
Nearby sold comps map
Loading sold comps map…
Walkable amenities ~0.75 mi
Loading nearby amenities…
Taxation est. · year 1
- Rental income
- $16,209
- − Mortgage interest
- −$3,081
- − Property taxes
- −$825
- − Insurance
- −$275
- − Repairs & maintenance
- −$1,297
- − Management
- −$1,297
- − Depreciation
- −$1,600
- Taxable income
- $7,835
- Est. tax owed @ 24.0%
- −$1,880
- After-tax cash flow
- $6,364/yr
For passive investors: Depreciation is non-cash, so a rental often shows a tax loss while cash-flowing — sheltering income. Rental losses are passive: they offset passive income freely, and up to $25,000/yr can offset ordinary (W-2) income if you actively participate and your MAGI is under $100k (phasing out to $0 by $150k); unused losses carry forward. On sale, claimed depreciation is recaptured at up to 25%, and gains may owe capital-gains tax (a 1031 exchange can defer both). Figures are a year-1 estimate at your 24.0% rate — not tax advice; consult a CPA.
Schools (NCES district)
- District
- Jefferson County
- NCES district ID
- 2102990
- Math proficiency
- 19% ▼ -17.00%
- Reading proficiency
- 35% ▼ -11.00%
- Median HH income
- $47,885
- Composite
- 23.45/100
- National rank
- #7884
- State rank
- #121 of 165 in KY
Livability — Louisville
- Score
- 63/100
- State rank
- #333
- US rank
- #15887
Category grades
Schools grade is shown separately in the Schools card above.
Census & demographics
- Census place
- Louisville, KY
- County
- Jefferson County · 790,184 people
- City population
- 769,292
- Metro
- Louisville/Jefferson County, KY-IN
- Population (ZIP)
- 13,518
- Household income
- $35,347
- Rent vs Own
- Severe rent burden
- 815.0
Population outlook (Jefferson County) Hauer SSP2
- Today (2025)
- 823,112 people
- By 2030
- 849,343 · +3.2%
- By 2040
- 895,696 · +8.8%
- By 2050
- 933,630 · +13.4%
- By 2075
- 1,028,262 · +24.9%
- By 2100
- 1,072,675 · +30.3%
Race, ethnicity, and origin ACS 2023
- Neighborhood character
- Predominantly Black (84%)
- Race & ethnicity
- Black 84% White 8% Two or more races 5% Hispanic / Latino 3%
- Common ancestry
- Iranian 1%
- Foreign-born
- 4% · Canada
- Languages at home
- 93% English-only · Spanish 3%
Political lean MEDSL · Jefferson
- 2024 margin
- D (+16.6) · D 57.4% · R 40.9% · Other 1.7%
- 2008→2024 swing
- +4.5pp toward D · 2008: 12.0pp · 2024: 16.6pp
- All cycles
- 2024: D+16.6 2020: D+20.1 2016: D+13.3 2012: D+11.1 2008: D+12.0
Not yet ingested
- Civics
- —
Market trends
- HPI YoY
- ▲ 28.45%
- Current HPI
- 264.0146
- Rent YoY
- ▲ 8.05%
- Metro
- Louisville/Jefferson County, KY-IN
- State GDP YoY
- ▲ 1.81%
- F500 in state
- 4
Industry mix (Fortune 500 HQ in KY)
| Industry | F500 HQs | Revenue |
|---|---|---|
| Healthcare | 1 | $118B |
|
||
| Food / Beverage | 1 | $7B |
|
||
Price history
-31.2% since first listed6 events — show timeline
- 2026-05-19 Price Changed $55,000 Metro Search MLS
- 2026-04-29 Contingent — Metro Search MLS
- 2026-04-12 Listed $80,000 Metro Search MLS
- 2025-10-17 Pending — Metro Search MLS
- 2025-10-17 Listing Removed — Metro Search MLS
- 2025-10-03 Listed $80,000 Metro Search MLS
Cash-flow waterfall
monthlySold comps — $/sqft
last 12 mo · ≤1 miLoading sold comps…