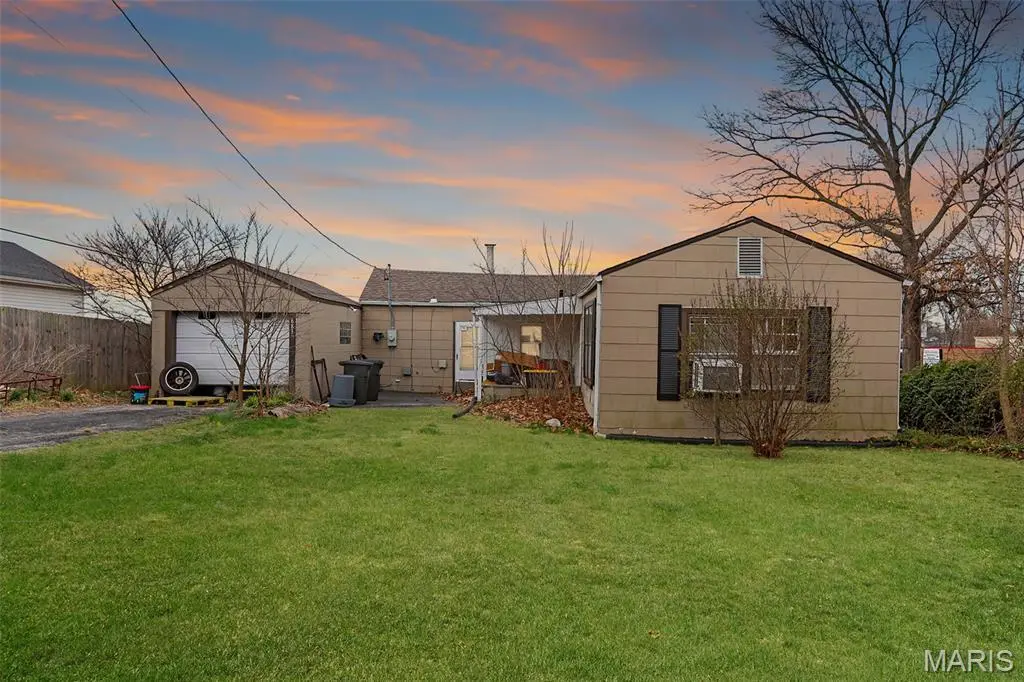
8832 Powell Ave · Brentwood, MO
Flood risk 1/10 · Minimal
- FEMA flood zone
- X (unshaded)
- Chance of flooding over 30 yrs
- 0.0%
- Est. flood insurance / yr
- $473 – $860
Fire risk 1/10 · Minimal
- Est. fire insurance / yr
- $1,054 – $1,958
Heat risk 5/10 · Moderate
- Hot days now (above 107°F)
- 7 days/yr
- Hot days in 30 yrs
- 21 days/yr
Wind risk 2/10 · Minimal
- Chance of severe wind over 30 yrs
- 1.0%
Air-quality risk 3/10 · Minor
- Unhealthy air days now
- 2 days/yr
- Unhealthy air days in 30 yrs
- 4 days/yr
Risk factors via First Street. Map © Google.
Why this score? — see what drove the B- grade
The composite is a weighted blend of 9 inputs, each scored 0–100. Each bar is that input's sub-score; the figure is the points it added to the 100-point composite (weight × sub-score).
- Cash flow +24.8/30.0
- ARV discount +15.0/15.0
- DSCR +8.0/10.0
- 1% rule +6.3/10.0
- Schools +5.8/10.0
- Livability +4.2/5.0
- Rent growth +2.9/5.0
- Condition / age +2.5/5.0
- Appreciation +0.0/10.0
$175,000
🖨 Deal sheet 📄 Offer letter ✓ Due diligence
Listing remarks
Opportunity awaits in the heart of Brentwood! Situated in a highly desirable location surrounded by shopping, dining, and easy highway access, this property presents an exceptional chance for investors, builders, or those looking to create their dream home from the ground up. Offered as-is, this lot provides incredible potential for redevelopment or new construction. Whether you're envisioning a custom residence or your next project, the possibilities here are endless. Best for a teardown and would need extensive renovation. Seller will not repairs, priced to sell.
Key facts
- 7,679 sq ft lot
- Garage
- Built 1922
Neighborhood map
What this means for you Summary
Snapshot
- This is a 2-bed/1.0-bath single-family listed at $175k.
Deal economics
- At list price, monthly cash flow is $370 ($4k/yr) — positive.
- The deal already cash-flows at list — no discount required.
- Meets the 1% rule at list price ($2k rent vs $175k).
- Cap rate 8.8% vs local median 4.8% in Brentwood — top-decile yield for the area; either an underpriced asset or a hidden risk that comps aren't pricing in. Stress-test before assuming the spread holds.
Location & tenants
- Location reads 84/100 on livability (#6 in MO, #689 nationally) — a professional / high-income tenant draw. Strengths: employment A+, housing A+, cost of living B; Watch: crime C-.
- Brentwood (suburban): math 65% / reading 66% proficiency, ranked #4 of 324 in MO (top 1%) — acceptable for families but not a draw, mixed tenant base, ~2y average lease; only 18% free/reduced lunch — higher-income household profile.
- Zoned schools: Mcgrath Elem. (math 67% / reading 67%, grade B+, #46 of 1,115 statewide, top 5%, 195 students, 16% FRL); Brentwood High (math 62% / reading 74%, grade B, #12 of 521 statewide, top 2%, 191 students, 30% FRL) — zoned schools at 23% FRL track the district average.
- Market conditions: Rents rising (+1.5%/yr); 128 active listings in the ZIP; 33 comparable units currently listed for rent nearby; rentals leasing fast (median 8d on market — plan ~1-2 weeks tenant-placement turnaround); solid renter incomes; 920 units permitted in St. Louis County in 2024 (250 in 5+ unit buildings).
Forward outlook
- Local home prices are declining (-3.0%/yr); year-one equity from $1k of loan paydown is wiped out by about $5k of value loss. Plan a longer hold.
Negotiation context
- Only 9 days on market — expect competitive offers; lowballing is unlikely to land.
- Current owner paid $125k; 40% above their basis — modest negotiation headroom, anchor on the comps not their cost.
Risks & watch-outs
- Watch-outs: built in 1922 — expect roof / HVAC / electrical / plumbing capex.
- Climate carrying-cost: extreme-heat days projected 7→21/yr by 2055 (HVAC capex compounding) — expect insurance premiums to compound above CPI over the hold.
Questions for the listing agent
- Built in 1922 — when were the roof, HVAC, electrical panel, plumbing, and water heater last replaced?
- Is there a deadline driving the sale (1031 exchange, divorce, estate, relocation)? That informs how much negotiation room exists.
- Schools are A-rated — typically a magnet for longer-tenancy family renters. What's the average tenant stay here, and is there a school-zone premium baked into asking?
- What's the average days-on-market for RENTAL listings here right now (not sales)? A rising rental-DOM trend means longer vacancies and softer asking-rent achievability than the comps imply.
- What's the recent tenant-quality profile in this submarket — average credit score on applications, eviction rate, late-payment / NSF rate, and stable-employment percentage? A property-management company in the area should have these aggregated.
- How much new for-sale + rental construction is in the pipeline within 1–3 miles? Heavy new supply typically softens prices + rents 12–24 months out; constrained supply supports both.
Investment metrics
- 1% rule
- 1.13% ✓
- Cap rate
- 8.83%
- Cash-on-cash
- 9.06%
- DSCR
- 1.40
- GRM
- 7.4
CMA / ARV
- ARV (on-the-fly)
- $264,160
- Comps found
- 12
Show comp detail 12 sales within ~0.75 mi
| Address | Dist | Beds/Ba | Sqft | Sold | Price | $/sf | Match |
|---|---|---|---|---|---|---|---|
| 8832 Powell Ave | 0.00mi | 3/1.0 (+1) | 1,016 (0%) | 1mo | $175,000 | $172 | 94 |
| 2318 Patton Ave | 0.43mi | 2/1.0 | 976 (-4%) | 0mo | $249,900 | $256 | 73 |
| 2331 Patton Ave | 0.39mi | 2/2.0 | 982 (-3%) | 2mo | $299,000 | $304 | 70 |
| 2837 Manderly Dr | 0.25mi | 3/1.0 (+1) | 1,094 (+8%) | 4mo | $284,900 | $260 | 67 |
| 8832 Lawn Ave | 0.72mi | 2/1.0 | 997 (-2%) | 1mo | $305,000 | $306 | 63 |
| 2327 Hill Ave | 0.42mi | 3/1.0 (+1) | 1,091 (+7%) | 1mo | $289,000 | $265 | 62 |
| 8816 Bridgeport Ave | 0.53mi | 3/2.0 (+1) | 1,000 (-2%) | 2mo | $250,000 | $250 | 62 |
| 8637 Litzsinger Rd | 0.51mi | 2/1.0 | 915 (-10%) | 2mo | $265,000 | $290 | 57 |
| 716 Bell Ave | 0.70mi | 3/1.0 (+1) | 966 (-5%) | 0mo | $140,000 | $145 | 54 |
| 2918 Wingate Ct | 0.74mi | 2/1.0 | 1,080 (+6%) | 4mo | $280,000 | $259 | 52 |
| 8824 Lawn Ave | 0.72mi | 2/1.0 | 925 (-9%) | 0mo | $289,900 | $313 | 51 |
| 2835 Dunkirk Dr | 0.62mi | 2/1.0 | 1,142 (+12%) | 0mo | $250,000 | $219 | 50 |
Match score weights: distance 35% · size 25% · config 20% · recency 20%. Top-matched comps best support the ARV.
Projected returns pro-forma
-3.0% appreciation · 1.49% rent growth · sell at horizon
- IRR
- -4.3%
- Equity multiple
- 0.84×
- Total profit
- $-7,741
- Equity at exit
- $26,093
- IRR
- 3.6%
- Equity multiple
- 1.24×
- Total profit
- $11,882
- Equity at exit
- $15,131
Cash invested: $49,000 (down + closing). Projections, not guarantees.
Landlord ↔ Tenant lean methodology
- Overall (STATE)
- 81 Strongly Landlord-Friendly
- State Missouri
- 81 Strongly Landlord-Friendly · R+10
- County
- — inherits STATE
- City
- — inherits STATE
ZIP-level market 63144
- Rents YoY
- 1.5%
- Active inventory
- 128
- Price-to-rent
- 7.4×
Monthly cashflow live
- Estimated rent
- $1,980 high interval (Pro) →
- Mortgage (P&I)
- −$918
- Tax from tax record
- −$204 /mo · $2,442/yr
- Insurance
- −$73
- HOA
- −$0
- Vacancy / Maint / Mgmt
- −$416
- Net cashflow
- $370
Break-even live
UW: 25.0% down · 7.5% · 30yr · 1.5% tax · 5.0% vac · 8.0% maint · 8.0% mgmt
Financing live
Cash to close
- Down payment
- $43,750
- Closing costs
- $5,250
- Reserves months
- —
- Total cash needed
- —
Loan-product check · same deal, 3 products live
Conventional
25% down · 7.5% · 30yr
- Down + closing
- —
- Monthly P&I
- —
- Monthly cashflow
- —
- DSCR
- —
- Eligible?
- —
Personal DTI + credit; lowest rate.
DSCR
20% down · 8.5% · 30yr
- Down + closing
- —
- Monthly P&I
- —
- Monthly cashflow
- —
- DSCR
- —
- Eligible?
- —
No personal income docs; deal must DSCR.
Hard money
10% down · 12.0% · 12mo
- Down + closing
- —
- Monthly P&I
- —
- Monthly cashflow
- —
- DSCR
- —
- Eligible?
- —
Short-term bridge; refi at stabilization.
Rent comps 33 comps
| Address | Beds | Baths | Sqft | Rent | $/sqft | DOM | Units | Dist |
|---|---|---|---|---|---|---|---|---|
| 9006 Madge Ave Saint Louis, MO | 2.0 | 2.0 | 1000 | $2,100 | $2.10 | 7d | 1 | 0.13mi |
| 2806 Hilldale Ave Saint Louis, MO | 2.0 | 2.0 | 1104 | $2,550 | $2.31 | 1d | 1 | 0.14mi |
| 2820 Hilldale Ave Saint Louis, MO | 3.0 | 2.0 | 1140 | $2,550 | $2.24 | 1d | 1 | 0.18mi |
| 72 Van Mark Way Brentwood, MO | 1.0–2.0 | 1.0 | 780 | $1,249 | $1.60 | 1d | 4 | 0.31mi |
| 2501 Mary Ave Brentwood, MO | 1.0 | 1.5 | 1100 | $1,725 | $1.57 | 7d | 1 | 0.35mi |
| 8661 Litzsinger Rd Saint Louis, MO | 2.0 | 1.0 | 910 | $1,765 | $1.94 | 43d | 1 | 0.48mi |
| 9305 Manchester Rd St. Louis, MO | 1.0–2.0 | 1.0 | 776 | $1,445 | $1.86 | 2d | 12 | 0.52mi |
| 927 N Elm Ave Saint Louis, MO | 3.0 | 1.0 | 828 | $1,800 | $2.17 | 20d | 1 | 0.52mi |
| 153 Willis Ave Saint Louis, MO | 3.0 | 1.5 | 1097 | $2,100 | $1.91 | 1d | 1 | 0.54mi |
| 2756 McKnight Crossing Ct Saint Louis, MO | 2.0 | 2.0 | 1175 | $2,425 | $2.06 | 1d | 1 | 0.62mi |
| 2756 McKnight Crossing Ct Saint Louis, MO | 2.0 | 2.0 | 1175 | $2,425 | $2.06 | 10d | 1 | 0.62mi |
| 539 N Elm Ave Saint Louis, MO | 3.0 | 1.0 | 1055 | $1,500 | $1.42 | 10d | 1 | 0.86mi |
| 1696 E Swan Cir Saint Louis, MO | 2.0 | 1.0 | 967 | $1,600 | $1.65 | 43d | 1 | 0.86mi |
| 9035 W Swan Cir Saint Louis, MO | 3.0 | 1.5 | 1450 | $2,400 | $1.66 | 10d | 1 | 0.87mi |
| 1800 S Brentwood Blvd Saint Louis, MO | 1.0–3.0 | 1.0–2.0 | 1164 | $2,105 | $1.81 | 1d | 19 | 0.89mi |
| 1736 Redbird Cv Saint Louis, MO | 2.0 | 1.0 | 900 | $1,800 | $2.00 | 43d | 1 | 0.94mi |
| 324 Eldridge Ave Saint Louis, MO | 2.0 | 1.0 | 1015 | $2,000 | $1.97 | 1d | 1 | 0.94mi |
| 9071 Wrenwood Ln Saint Louis, MO | 2.0 | 1.0 | 1060 | $1,650 | $1.56 | 43d | 1 | 0.96mi |
| 8901 Cardinal Ter Saint Louis, MO | 2.0 | 1.0 | 1004 | $1,600 | $1.59 | 10d | 1 | 0.96mi |
| 1607 Redbird Cv Saint Louis, MO | 2.0 | 1.0 | 946 | $2,038 | $2.15 | 1d | 1 | 1.00mi |
| 1469 Bobolink Pl Saint Louis, MO | 2.0 | 1.0 | 981 | $1,700 | $1.73 | 43d | 1 | 1.04mi |
| 1251 Strassner Dr Saint Louis, MO | 2.0 | 2.0 | 1177 | $1,925 | $1.64 | 43d | 1 | 1.07mi |
| 1241 Strassner Dr Brentwood, MO | 2.0 | 2.0 | 1127 | $1,950 | $1.73 | 1d | 1 | 1.09mi |
| 31 Sunnen Dr Maplewood, MO | 1.0–2.0 | 1.0–2.0 | 956 | $2,428 | $2.54 | 1d | 17 | 1.12mi |
| 425 Bismark Ave Saint Louis, MO | 2.0 | 1.5 | 853 | $2,095 | $2.46 | 43d | 1 | 1.15mi |
| 7828 Laclede Forest Dr Maplewood, MO | 1.0–2.0 | 1.0 | 725 | $1,345 | $1.86 | 3d | 2 | 1.15mi |
| 2705 Laclede Station Rd Maplewood, MO | 2.0 | 1.5 | 840 | $1,499 | $1.78 | 4d | 1 | 1.20mi |
| 139 W Kirkham Ave Saint Louis, MO | 2.0 | 2.5 | 1163 | $2,300 | $1.98 | 14d | 1 | 1.20mi |
| 9724 Greenwood Ter Saint Louis, MO | 2.0 | 1.0 | 907 | $1,525 | $1.68 | 20d | 1 | 1.24mi |
| 9816 Obrien Ct Saint Louis, MO | 3.0 | 2.0 | 1040 | $2,100 | $2.02 | 1d | 1 | 1.29mi |
| 7784 W Bruno Ave Saint Louis, MO | 2.0 | 1.0 | 900 | $950 | $1.06 | 43d | 1 | 1.42mi |
| 226 E Lockwood Ave Saint Louis, MO | 1.0 | 1.0 | 672 | $2,570 | $3.82 | 1d | 5 | 1.46mi |
| 341 W Pacific Ave Saint Louis, MO | 2.0 | 1.5 | 1200 | $1,995 | $1.66 | 20d | 1 | 1.47mi |
Listing history 6 events
-
2026-04-02status Pending
-
2026-03-24$175,000 Active
-
2019-04-25soldstatus $125,000
-
2019-01-08price $134,500
-
2018-11-19soldstatus $115,000
-
1994-03-04soldstatus
ⓘ Source: listings_history table (triggers on properties + properties_extension) + one-shot
backfill from property_details.listing_events for pre-trigger history.
Tax reassessment forecast MO · Resets to sale price
- Current annual tax
- $2,442 · $204/mo
- Projected year-2 tax
- $2,442 · $204/mo
- Expected delta
- $0/yr ($0/mo · 0.0%)
ⓘ Screening estimate from a state-policy table — verify with the county assessor before closing.
Climate risk First Street
- Flood 1/10 Low FEMA zone X (unshaded) · 0% chance over 30 yrs
- Wildfire 1/10 Low
- Heat 5/10 Major 7 d/yr ≥107°F today · 21 d/yr by 30 yrs out
- Wind 2/10 Low 100% chance of damaging wind over 30 yrs
- Air quality 3/10 Moderate 2 unhealthy d/yr today · 4 by 30 yrs out
Nearby sold comps map
Loading sold comps map…
Walkable amenities ~0.75 mi
Loading nearby amenities…
Taxation est. · year 1
- Rental income
- $23,758
- − Mortgage interest
- −$9,803
- − Property taxes
- −$2,442
- − Insurance
- −$875
- − Repairs & maintenance
- −$1,901
- − Management
- −$1,901
- − Depreciation
- −$5,091
- Taxable income
- $1,746
- Est. tax owed @ 24.0%
- −$419
- After-tax cash flow
- $4,020/yr
For passive investors: Depreciation is non-cash, so a rental often shows a tax loss while cash-flowing — sheltering income. Rental losses are passive: they offset passive income freely, and up to $25,000/yr can offset ordinary (W-2) income if you actively participate and your MAGI is under $100k (phasing out to $0 by $150k); unused losses carry forward. On sale, claimed depreciation is recaptured at up to 25%, and gains may owe capital-gains tax (a 1031 exchange can defer both). Figures are a year-1 estimate at your 24.0% rate — not tax advice; consult a CPA.
Schools (NCES district)
- District
- Brentwood
- NCES district ID
- 2905880
- Math proficiency
- 65% ▼ -3.00%
- Reading proficiency
- 66% ▼ -1.00%
- Median HH income
- $69,522
- Composite
- 57.51/100
- National rank
- #1069
- State rank
- #4 of 324 in MO
Livability — Brentwood
- Score
- 84/100
- State rank
- #6
- US rank
- #689
Category grades
Schools grade is shown separately in the Schools card above.
Census & demographics
- Census place
- Brentwood, MO
- County
- Saint Louis County · 888,823 people
- City population
- 9,505
- Metro
- St. Louis, MO-IL
- Population (ZIP)
- 9,505
- Household income
- $104,438
- Rent vs Own
- Severe rent burden
- 310.0
Population outlook (St. Louis County) Hauer SSP2
- Today (2025)
- 1,025,227 people
- By 2030
- 1,028,023 · +0.3%
- By 2040
- 1,020,940 · -0.4%
- By 2050
- 1,007,280 · -1.8%
- By 2075
- 987,277 · -3.7%
- By 2100
- 921,984 · -10.1%
Race, ethnicity, and origin ACS 2023
- Neighborhood character
- Predominantly White (78%)
- Race & ethnicity
- White 78% Two or more races 10% Asian 7% Black 5% Hispanic / Latino 2%
- Common ancestry
- Romanian 4% Italian 3% Slovak 2%
- Foreign-born
- 11% · China, Canada, South Korea
- Languages at home
- 91% English-only · Other Asian/Pacific 2% Spanish 2% Russian/Polish/Slavic 1%
Political lean MEDSL · St. Louis
- 2024 margin
- Strong D (+23.4) · D 60.8% · R 37.4% · Other 1.7%
- 2008→2024 swing
- +3.5pp toward D · 2008: 19.9pp · 2024: 23.4pp
- All cycles
- 2024: D+23.4 2020: D+24.0 2016: D+16.2 2012: D+13.7 2008: D+19.9
Not yet ingested
- Civics
- —
Market trends
- HPI YoY
- ▼ -411.33%
- Current HPI
- 207.0145
- Rent YoY
- ▲ 1.49%
- Metro
- St. Louis, MO-IL
- State GDP YoY
- ▲ 1.84%
- F500 in state
- 20
Industry mix (Fortune 500 HQ in MO)
| Industry | F500 HQs | Revenue |
|---|---|---|
| Healthcare | 1 | $163B |
|
||
| Insurance | 1 | $21B |
|
||
| Industrial Technology | 1 | $17B |
|
||
| Retail | 1 | $16B |
|
||
| Industrial Distribution | 1 | $10B |
|
||
| Utilities | 1 | $9B |
|
||
Price history
+52.2% since first listed6 events — show timeline
- 2026-04-02 Pending — MARIS as Distributed by MLS Grid
- 2026-03-24 Listed $175,000 MARIS as Distributed by MLS Grid
- 2019-04-25 Sold (Public Records) $125,000 Public Records
- 2019-01-08 Price Changed $134,500 MARIS as Distributed by MLS Grid
- 2018-11-19 Sold (Public Records) $115,000 Public Records
- 1994-03-04 Sold (Public Records) — Public Records
Property tax history
+4.3%/yrLatest (2022): $2,442 · +0.8% YoY. Source: county tax records.
Cash-flow waterfall
monthlySold comps — $/sqft
last 12 mo · ≤1 miLoading sold comps…