 🏷️ Likely Rental
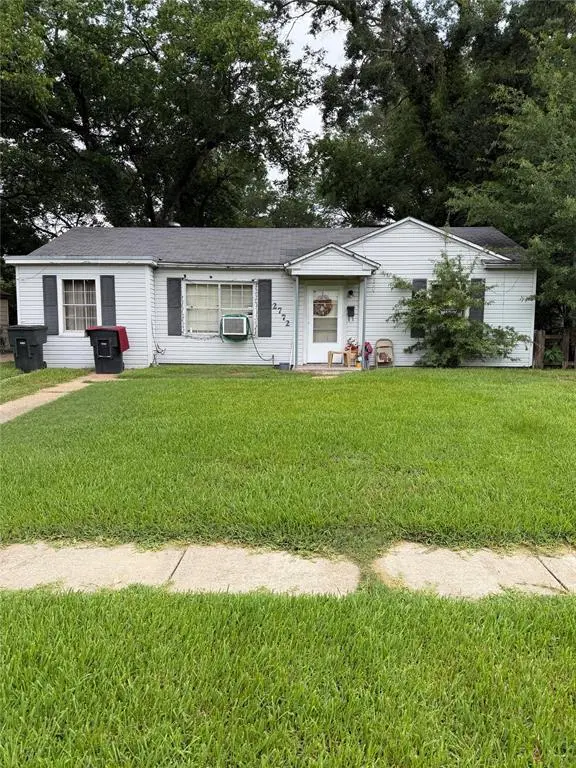
2772 Rosemont St · Shreveport, LA
Flood risk 1/10 · Minimal
- FEMA flood zone
- X (unshaded)
- Chance of flooding over 30 yrs
- 0.0%
- Est. flood insurance / yr
- $507 – $1,088
Fire risk 1/10 · Minimal
- Est. fire insurance / yr
- $1,269 – $2,357
Heat risk 7/10 · Major
- Hot days now (above 110°F)
- 7 days/yr
- Hot days in 30 yrs
- 22 days/yr
Wind risk 6/10 · Moderate
- Chance of severe wind over 30 yrs
- 68.0%
Air-quality risk 2/10 · Minimal
- Unhealthy air days now
- 1 days/yr
- Unhealthy air days in 30 yrs
- 1 days/yr
Risk factors via First Street. Map © Google.
Why this score? — see what drove the B+ grade
The composite is a weighted blend of 9 inputs, each scored 0–100. Each bar is that input's sub-score; the figure is the points it added to the 100-point composite (weight × sub-score).
- Cash flow +30.0/30.0
- ARV discount +15.0/15.0
- 1% rule +10.0/10.0
- DSCR +10.0/10.0
- Rent growth +3.1/5.0
- Livability +3.0/5.0
- Condition / age +2.5/5.0
- Schools +2.2/10.0
- Appreciation +0.0/10.0
$39,000
🖨 Deal sheet 📄 Offer letter ✓ Due diligence
Listing remarks
Investor Opportunity in Sunset Acres Subdivision. Discover this promising investment property, a tenant-occuped residence in the Shreveport LA's Sunset Acres. This 3-bedroom, 1-bathroom presents a compelling opportunity for investors seeking a reliable income stream. The current tenant, who has resided in the property for approximately 12+ years, is committed to remaining and currently pays $600 per month. This home is convenently located to easy public transportation access which may enhance the appeal for future tenants. For viewing arrangements and more details, please contact the Listing Agent directly.
Key facts
- 7,144 sq ft lot
- Built 1955
- Listed 9 days
Tags
Property features AI
Finance
- Other: All appliances and window air units are owned by the tenant and do not convey
- Financial info: Treat as clear loan type; No second mortgage
- HOA & community: No homeowners association
Exterior
- Parking: Driveway parking; No covered or carport spaces
- Utilities: City water; City sewer; Not in a municipal utility district
- Home design: Single family residence; One story; Property attached: Yes
- Construction: Built in 1955
- Exterior features: Lot under 0.5 acre (approximately 0.164 acre); Subdivision: Sunset Acres
Interior
- Kitchen: No appliances included (tenant-owned appliances do not convey)
- Bedrooms: 3 bedrooms (primary bedroom on main level)
- Bathrooms: 1 full bathroom
- Heating & cooling: Window air conditioning units (tenant-owned); Wall furnace heating
- Interior features: Eat-in kitchen; One living area; One dining area; Two total rooms
- Laundry & utility: No washer/dryer listed
Neighborhood map
What this means for you Summary
Snapshot
- This is a 3-bed/1.0-bath single-family listed at $39k.
Deal economics
- At list price, monthly cash flow is $491 ($6k/yr) — positive.
- The deal already cash-flows at list — no discount required.
- Meets the 1% rule at list price ($967 rent vs $39k).
- Cap rate 21.4% vs local median 5.7% in Shreveport — top-decile yield for the area; either an underpriced asset or a hidden risk that comps aren't pricing in. Stress-test before assuming the spread holds.
Location & tenants
- Location reads 59/100 on livability (#270 in LA) — a working-class tenant base; expect higher turnover. Strengths: cost of living A+, housing A; Watch: schools D+, crime F, amenities F.
- Caddo Parish (urban): math 21% / reading 32% proficiency, ranked #53 of 98 in LA (top 54%) — low school quality limits family demand, transient renter base, plan for 1-2y turnover; 64% free/reduced lunch — lower-income household profile, screen leases tightly.
- Market conditions: Rents rising (+2.4%/yr); 138 active listings in the ZIP; 22 comparable units currently listed for rent nearby; rentals lingering (median 44d on market — plan ~5-8 weeks vacancy on turnover, expect pricing pressure); 55% of comp listings sitting > 30 days — soft ceiling on asking rent; lower-income renter base — watch delinquency; 221 units permitted in Caddo Parish in 2024 (0 in 5+ unit buildings).
- This rent runs 36% of the median local income ($32k/yr) — at the standard rent-burdened threshold; future hikes will face affordability resistance.
Forward outlook
- Local home prices are declining (-3.0%/yr); year-one equity from $270 of loan paydown is wiped out by about $1k of value loss. Plan a longer hold.
- Caddo County population projected at -15% by 2050 — secular population decline; favor cash flow + early exit over multi-decade hold.
- At projected returns (-3.0% appreciation + 2.4% rent growth), your $11k cash investment doubles in ~3 years — after that, you're playing with house money.
Negotiation context
- Only 9 days on market — expect competitive offers; lowballing is unlikely to land.
Risks & watch-outs
- Watch-outs: built in 1955 — expect roof / HVAC / electrical / plumbing capex.
- Climate carrying-cost: major wind risk, 68% chance of damaging wind over 30y; extreme-heat days projected 7→22/yr by 2055 (HVAC capex compounding) — expect insurance premiums to compound above CPI over the hold.
Questions for the listing agent
- Built in 1955 — when were the roof, HVAC, electrical panel, plumbing, and water heater last replaced?
- Is there a deadline driving the sale (1031 exchange, divorce, estate, relocation)? That informs how much negotiation room exists.
- Schools are D-rated, which usually means shorter tenancies and higher turnover. Who's the typical renter profile here, and what's been the actual vacancy rate?
- Crime grade is F in this area — have there been break-ins, vandalism, or insurance claims at this property in the last 3 years? What carrier currently insures it and at what premium?
- What's the average days-on-market for RENTAL listings here right now (not sales)? A rising rental-DOM trend means longer vacancies and softer asking-rent achievability than the comps imply.
- What's the recent tenant-quality profile in this submarket — average credit score on applications, eviction rate, late-payment / NSF rate, and stable-employment percentage? A property-management company in the area should have these aggregated.
- How much new for-sale + rental construction is in the pipeline within 1–3 miles? Heavy new supply typically softens prices + rents 12–24 months out; constrained supply supports both.
Investment metrics
- 1% rule
- 2.48% ✓
- Cap rate
- 21.41%
- Cash-on-cash
- 53.98%
- DSCR
- 3.40
- GRM
- 3.4
CMA / ARV
- ARV (on-the-fly)
- $49,082
- Comps found
- 12
Show comp detail 12 sales within ~0.75 mi
| Address | Dist | Beds/Ba | Sqft | Sold | Price | $/sf | Match |
|---|---|---|---|---|---|---|---|
| 2729 Marquette St | 0.12mi | 2/1.0 (-1) | 1,000 (-6%) | 9mo | $58,000 | $58 | 72 |
| 6312 Canal Blvd | 0.31mi | 2/1.0 (-1) | 1,126 (+6%) | 10mo | $92,500 | $82 | 63 |
| 7003 Sherwood Cir | 0.66mi | 3/1.0 | 1,059 (-1%) | 8mo | $40,000 | $38 | 62 |
| 3012 Ivy Ln | 0.54mi | 3/1.0 | 983 (-8%) | 6mo | $125,000 | $127 | 56 |
| 7135 Wyngate Blvd | 0.72mi | 3/1.0 | 1,124 (+5%) | 4mo | $51,950 | $46 | 54 |
| 7123 Wyngate Blvd | 0.70mi | 3/1.0 | 1,146 (+7%) | 2mo | $35,000 | $31 | 53 |
| 2910 Meadow Ave | 0.54mi | 3/1.0 | 931 (-13%) | 3mo | $45,000 | $48 | 51 |
| 841 Huntington Ln | 0.65mi | 3/2.0 | 1,115 (+4%) | 9mo | $24,900 | $22 | 50 |
| 2640 Meadow Ave | 0.58mi | 3/2.0 | 1,196 (+12%) | 8mo | $59,500 | $50 | 43 |
| 2754 Lakehurst Ave | 0.60mi | 3/1.5 | 1,214 (+14%) | 10mo | $55,000 | $45 | 39 |
| 7119 Elsie St | 0.58mi | 2/2.0 (-1) | 1,188 (+11%) | 16mo | $32,000 | $27 | 32 |
| 7118 Wyngate Blvd | 0.67mi | 4/1.0 (+1) | 1,193 (+12%) | 16mo | $49,900 | $42 | 31 |
Match score weights: distance 35% · size 25% · config 20% · recency 20%. Top-matched comps best support the ARV.
Projected returns pro-forma
-3.0% appreciation · 2.37% rent growth · sell at horizon
- IRR
- 51.4%
- Equity multiple
- 3.23×
- Total profit
- $24,372
- Equity at exit
- $5,815
- IRR
- 56.5%
- Equity multiple
- 6.41×
- Total profit
- $59,106
- Equity at exit
- $3,372
Cash invested: $10,920 (down + closing). Projections, not guarantees.
Landlord ↔ Tenant lean methodology
- Overall (STATE)
- 90 Strongly Landlord-Friendly
- State Louisiana
- 90 Strongly Landlord-Friendly · R+12
- County
- — inherits STATE
- City
- — inherits STATE
ZIP-level market 71108
- Rents YoY
- 2.4%
- Active inventory
- 138
- Price-to-rent
- 3.4×
Monthly cashflow live
- Estimated rent
- $967 high interval (Pro) →
- Mortgage (P&I)
- −$205
- Tax from tax record
- −$52 /mo · $620/yr
- Insurance
- −$16
- HOA
- −$0
- Vacancy / Maint / Mgmt
- −$203
- Net cashflow
- $491
Break-even live
UW: 25.0% down · 7.5% · 30yr · 1.5% tax · 5.0% vac · 8.0% maint · 8.0% mgmt
Financing live
Cash to close
- Down payment
- $9,750
- Closing costs
- $1,170
- Reserves months
- —
- Total cash needed
- —
Loan-product check · same deal, 3 products live
Conventional
25% down · 7.5% · 30yr
- Down + closing
- —
- Monthly P&I
- —
- Monthly cashflow
- —
- DSCR
- —
- Eligible?
- —
Personal DTI + credit; lowest rate.
DSCR
20% down · 8.5% · 30yr
- Down + closing
- —
- Monthly P&I
- —
- Monthly cashflow
- —
- DSCR
- —
- Eligible?
- —
No personal income docs; deal must DSCR.
Hard money
10% down · 12.0% · 12mo
- Down + closing
- —
- Monthly P&I
- —
- Monthly cashflow
- —
- DSCR
- —
- Eligible?
- —
Short-term bridge; refi at stabilization.
Rent comps 22 comps
| Address | Beds | Baths | Sqft | Rent | $/sqft | DOM | Units | Dist |
|---|---|---|---|---|---|---|---|---|
| 2762 Marquette St Shreveport, LA | 3.0 | 1.0 | 1054 | $1,000 | $0.95 | 20d | 1 | 0.04mi |
| 2721 Sunnybrook St Shreveport, LA | 3.0 | 1.0 | 913 | $1,000 | $1.10 | 43d | 1 | 0.21mi |
| 2943 Hillcrest Ave Shreveport, LA | 4.0 | 2.0 | 960 | $1,000 | $1.04 | 20d | 1 | 0.47mi |
| 3051 Amherst St Shreveport, LA | 3.0 | 1.0 | 994 | $595 | $0.60 | 43d | 1 | 0.47mi |
| 7504 W Canal Blvd Shreveport, LA | 3.0 | 1.0 | 1388 | $1,150 | $0.83 | 43d | 1 | 0.66mi |
| 3306 Valley View Dr Shreveport, LA | 3.0 | 1.0 | 1300 | $1,150 | $0.88 | 20d | 1 | 0.75mi |
| 749 W 68th St Shreveport, LA | 3.0 | 1.0 | 1232 | $800 | $0.65 | 43d | 1 | 0.75mi |
| 7137 Burlingame Blvd Shreveport, LA | 3.0 | 1.5 | 1100 | $700 | $0.64 | 43d | 1 | 0.76mi |
| 3437 Red Bud Ln Shreveport, LA | 3.0 | 1.5 | 1393 | $1,200 | $0.86 | 20d | 1 | 0.80mi |
| 7224 Union Ave Shreveport, LA | 2.0 | 1.0 | 735 | $625 | $0.85 | 13d | 1 | 0.81mi |
| 2641 Valley Ridge Rd Shreveport, LA | 3.0 | 1.0 | 1045 | $725 | $0.69 | 20d | 1 | 1.01mi |
| 2644 Valley Ridge Rd Shreveport, LA | 4.0 | 1.0 | 1023 | $1,100 | $1.08 | 43d | 1 | 1.03mi |
| 622 W 75th St Shreveport, LA | 2.0 | 1.0 | 833 | $800 | $0.96 | 20d | 1 | 1.07mi |
| 702 Bringhurst Dr Shreveport, LA | 3.0 | 1.5 | 1206 | $1,100 | $0.91 | 43d | 1 | 1.09mi |
| 513 Sassafras Ave Shreveport, LA | 3.0 | 1.0 | 960 | $870 | $0.91 | 20d | 1 | 1.11mi |
| 7913 Woodfield Dr Shreveport, LA | 3.0 | 1.0 | 1067 | $1,000 | $0.94 | 43d | 1 | 1.16mi |
| 5306 Prentiss Ave Shreveport, LA | 3.0 | 1.0 | 957 | $975 | $1.02 | 43d | 1 | 1.22mi |
| 3530 Pleasant Dr Shreveport, LA | 2.0 | 1.0 | 750 | $725 | $0.97 | 20d | 1 | 1.24mi |
| 5218 Fairfax Ave Shreveport, LA | 2.0 | 1.0 | 971 | $825 | $0.85 | 20d | 1 | 1.30mi |
| 1954 State St Shreveport, LA | 3.0 | 1.0 | 900 | $900 | $1.00 | 43d | 1 | 1.35mi |
| 223 W 69th St Shreveport, LA | 2.0 | 1.0 | 990 | $750 | $0.76 | 43d | 1 | 1.39mi |
| 629 Woodmont Pl Shreveport, LA | 3.0 | 1.0 | 1431 | $1,295 | $0.90 | 44d | 1 | 1.41mi |
Listing history 8 events
-
2026-06-18days on market $39,000 Active 9 DOM
-
2026-06-17days on market $39,000 Active 8 DOM
-
2026-06-16days on market $39,000 Active 7 DOM
-
2026-06-15days on market $39,000 Active 6 DOM
-
2026-06-14days on market $39,000 Active 4 DOM
-
2026-06-13days on market $39,000 Active 3 DOM
-
2026-06-09remarks 614-char remark
-
2026-06-09$39,000 Active 1 DOM
ⓘ Source: listings_history table (triggers on properties + properties_extension) + one-shot
backfill from property_details.listing_events for pre-trigger history.
Tax reassessment forecast LA · Resets to sale price
- Current annual tax
- $620 · $52/mo
- Projected year-2 tax
- $620 · $52/mo
- Expected delta
- $0/yr ($0/mo · 0.0%)
ⓘ Screening estimate from a state-policy table — verify with the county assessor before closing.
Climate risk First Street
- Flood 1/10 Low FEMA zone X (unshaded) · 0% chance over 30 yrs
- Wildfire 1/10 Low
- Heat 7/10 Severe 7 d/yr ≥110°F today · 22 d/yr by 30 yrs out
- Wind 6/10 Major 68% chance of damaging wind over 30 yrs
- Air quality 2/10 Low 1 unhealthy d/yr today · 1 by 30 yrs out
Nearby sold comps map
Loading sold comps map…
Walkable amenities ~0.75 mi
Loading nearby amenities…
Taxation est. · year 1
- Rental income
- $11,599
- − Mortgage interest
- −$2,185
- − Property taxes
- −$620
- − Insurance
- −$195
- − Repairs & maintenance
- −$928
- − Management
- −$928
- − Depreciation
- −$1,135
- Taxable income
- $5,609
- Est. tax owed @ 24.0%
- −$1,346
- After-tax cash flow
- $4,548/yr
For passive investors: Depreciation is non-cash, so a rental often shows a tax loss while cash-flowing — sheltering income. Rental losses are passive: they offset passive income freely, and up to $25,000/yr can offset ordinary (W-2) income if you actively participate and your MAGI is under $100k (phasing out to $0 by $150k); unused losses carry forward. On sale, claimed depreciation is recaptured at up to 25%, and gains may owe capital-gains tax (a 1031 exchange can defer both). Figures are a year-1 estimate at your 24.0% rate — not tax advice; consult a CPA.
Schools (NCES district)
- District
- Caddo Parish
- NCES district ID
- 2200300
- Math proficiency
- 21% ▼ -33.00%
- Reading proficiency
- 32% ▼ -30.00%
- Median HH income
- $39,227
- Composite
- 22.23/100
- National rank
- #8148
- State rank
- #53 of 98 in LA
Livability — Shreveport
- Score
- 59/100
- State rank
- #270
- US rank
- #19730
Category grades
Schools grade is shown separately in the Schools card above.
Census & demographics
- Census place
- Shreveport, LA
- County
- Caddo Parish · 178,536 people
- City population
- 164,123
- Metro
- Shreveport-Bossier City, LA
- Population (ZIP)
- 18,072
- Household income
- $32,055
- Rent vs Own
- Severe rent burden
- 1526.0
Population outlook (Caddo County) Hauer SSP2
- Today (2025)
- 243,190 people
- By 2030
- 237,231 · -2.5%
- By 2040
- 222,502 · -8.5%
- By 2050
- 206,516 · -15.1%
- By 2075
- 165,706 · -31.9%
- By 2100
- 122,262 · -49.7%
Race, ethnicity, and origin ACS 2023
- Neighborhood character
- Predominantly Black (83%)
- Race & ethnicity
- Black 83% White 11% Hispanic / Latino 4% Two or more races 2%
- Foreign-born
- 2% · Canada
- Languages at home
- 96% English-only · Spanish 3%
Political lean MEDSL · Caddo
- 2024 margin
- Toss-up / Even · D 51.6% · R 47.0% · Other 1.4%
- 2008→2024 swing
- +1.6pp toward D · 2008: 3.0pp · 2024: 4.6pp
- All cycles
- 2024: D+4.6 2020: D+6.8 2016: D+4.2 2012: D+4.9 2008: D+3.0
Not yet ingested
- Civics
- —
Market trends
- HPI YoY
- ▼ -58.98%
- Current HPI
- 58.1377
- Rent YoY
- ▲ 2.37%
- Metro
- Shreveport-Bossier City, LA
- State GDP YoY
- ▲ 3.29%
- F500 in state
- 10
Industry mix (Fortune 500 HQ in LA)
| Industry | F500 HQs | Revenue |
|---|---|---|
| Telecommunications | 2 | $23B |
|
||
| Utilities | 1 | $12B |
|
||
| Wholesale / Distribution | 1 | $5B |
|
||
| Advertising | 1 | $2B |
|
||
Price history
4 events — show timeline
- 2026-06-09 Listed $39,000 NTREIS
- 2006-07-27 Sold (Public Records) — Public Records
- 2005-06-06 Sold (Public Records) — Public Records
- 1979-05-18 Sold (Public Records) — Public Records
Property tax history
-0.8%/yrLatest (2025): $620 · +0.4% YoY. Source: county tax records.
Cash-flow waterfall
monthlySold comps — $/sqft
last 12 mo · ≤1 miLoading sold comps…