2934 River Ridge Rd · Bourret, MI
Flood risk 1/10 · Minimal
- FEMA flood zone
- X (unshaded)
- Chance of flooding over 30 yrs
- 0.0%
- Est. flood insurance / yr
- $473 – $860
Fire risk 3/10 · Minor
- Est. fire insurance / yr
- $784 – $1,456
Heat risk 2/10 · Minimal
- Hot days now (above 95°F)
- 7 days/yr
- Hot days in 30 yrs
- 13 days/yr
Wind risk 1/10 · Minimal
- Chance of severe wind over 30 yrs
- —
Air-quality risk 2/10 · Minimal
- Unhealthy air days now
- 0 days/yr
- Unhealthy air days in 30 yrs
- 1 days/yr
Risk factors via First Street. Map © Google.
Why this score? — see what drove the B- grade
The composite is a weighted blend of 9 inputs, each scored 0–100. Each bar is that input's sub-score; the figure is the points it added to the 100-point composite (weight × sub-score).
- Cash flow +30.0/30.0
- 1% rule +10.0/10.0
- DSCR +10.0/10.0
- ARV discount +7.5/15.0
- Schools +2.9/10.0
- Rent growth +2.5/5.0
- Livability +2.5/5.0
- Condition / age +2.5/5.0
- Appreciation +0.0/10.0
$44,900
🖨 Deal sheet 📄 Offer letter ✓ Due diligence
Listing remarks MLS
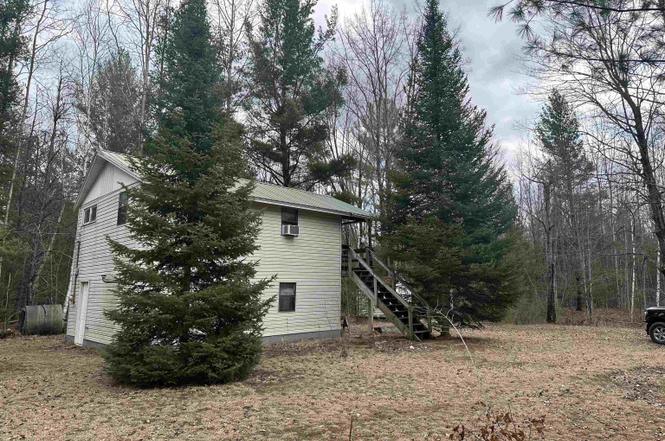
Discover the perfect up-north escape at this rustic year-round cabin, ideally located on a quiet corner lot at 2934 River Ridge Rd in Alger, Michigan. Just a short walk from the Middle Branch of the Tittabawassee River, this inviting property offers a serene wooded setting and access to four-season recreation. Step inside to an open-concept layout that’s both cozy and functional—perfect for relaxing after a day outdoors. The home features a level yard with plenty of space for outdoor enjoyment, a ground-level area for convenient storage, and comes fully furnished, making it move-in ready. Whether you're into snowmobiling, hiking, hunting, or fishing, this property puts adventure right at your doorstep. Enjoy the peace and quiet of nature without sacrificing comfort—a great weekend getaway or full-time residence for those seeking simplicity and serenity in northern Michigan.
Key facts
- Quiet corner lot
- Ground-level area
- Level yard
Tags
Property features AI
Finance
- HOA & community: Homeowners association present
Exterior
- Utilities: Private well water; Septic tank sewer
- Home design: Single-family residence; Two levels; About 1,000 square feet above grade
- Construction: Vinyl siding construction
- Exterior features: Lot dimensions approximately 60 x 241 x 60 x 239; Lot about 0.3 acres; No pool
Interior
- Kitchen: Oven; Range
- Bathrooms: 1 full bathroom
- Heating & cooling: Forced air heating (propane); Window air conditioning units
- Interior features: Oven and range; Basement with exterior entry and walk-out access; Total of 3 rooms
Neighborhood map
What this means for you Summary
Snapshot
- This is a 1-bed/1.0-bath single-family listed at $45k.
Deal economics
- At list price, monthly cash flow is $421 ($5k/yr) — positive.
- The deal already cash-flows at list — no discount required.
- Meets the 1% rule at list price ($884 rent vs $45k).
Location & tenants
- Location reads: area grade B — affects rentability + tenant quality, not the cash-flow math above.
- West Branch-Rose City Area Schools (rural): math 27% / reading 43% proficiency, ranked #306 of 540 in MI (top 57%) — families likely to look elsewhere, expect single-tenant / working-renter base with shorter leases.
- Market conditions: 66 active listings in the ZIP; 90 units permitted in Gladwin County in 2024 (0 in 5+ unit buildings).
Forward outlook
- Local home prices are declining (-3.0%/yr); year-one equity from $310 of loan paydown is wiped out by about $1k of value loss. Plan a longer hold.
- Gladwin County population projected at -25% by 2050 — secular population decline; favor cash flow + early exit over multi-decade hold.
- At projected returns (-3.0% appreciation + 3.0% rent growth), your $13k cash investment doubles in ~3 years — after that, you're playing with house money.
Negotiation context
- Only 14 days on market — expect competitive offers; lowballing is unlikely to land.
- 12 sale attempts since 6y ago with the ask held roughly flat each time — persistent listings suggest the price (not the market) is what's stuck; bring a comps-based counter.
- Current owner paid $35k; 29% above their basis — modest negotiation headroom, anchor on the comps not their cost.
Risks & watch-outs
- Watch-outs: built in 1950 — expect roof / HVAC / electrical / plumbing capex.
Questions for the listing agent
- Built in 1950 — when were the roof, HVAC, electrical panel, plumbing, and water heater last replaced?
- Is there a deadline driving the sale (1031 exchange, divorce, estate, relocation)? That informs how much negotiation room exists.
- What's the average days-on-market for RENTAL listings here right now (not sales)? A rising rental-DOM trend means longer vacancies and softer asking-rent achievability than the comps imply.
- What's the recent tenant-quality profile in this submarket — average credit score on applications, eviction rate, late-payment / NSF rate, and stable-employment percentage? A property-management company in the area should have these aggregated.
- How much new for-sale + rental construction is in the pipeline within 1–3 miles? Heavy new supply typically softens prices + rents 12–24 months out; constrained supply supports both.
Investment metrics
- 1% rule
- 1.97% ✓
- Cap rate
- 17.56%
- Cash-on-cash
- 40.22%
- DSCR
- 2.79
- GRM
- 4.2
CMA / ARV
No comps found within radius.
Projected returns pro-forma
-3.0% appreciation · 3.0% rent growth · sell at horizon
- IRR
- 36.6%
- Equity multiple
- 2.56×
- Total profit
- $19,556
- Equity at exit
- $6,695
- IRR
- 43.2%
- Equity multiple
- 5.10×
- Total profit
- $51,559
- Equity at exit
- $3,882
Cash invested: $12,572 (down + closing). Projections, not guarantees.
Landlord ↔ Tenant lean methodology
- Overall (STATE)
- 62 Landlord-Friendly
- State Michigan
- 62 Landlord-Friendly · EVEN
- County
- — inherits STATE
- City
- — inherits STATE
ZIP-level market 48610
- Active inventory
- 66
- Price-to-rent
- 4.2×
Monthly cashflow live
- Estimated rent
- $884 medium interval (Pro) →
- Mortgage (P&I)
- −$235
- Tax from tax record
- −$22 /mo · $269/yr
- Insurance
- −$19
- HOA
- −$0
- Vacancy / Maint / Mgmt
- −$186
- Net cashflow
- $421
Break-even live
UW: 25.0% down · 7.5% · 30yr · 1.5% tax · 5.0% vac · 8.0% maint · 8.0% mgmt
Financing live
Cash to close
- Down payment
- $11,225
- Closing costs
- $1,347
- Reserves months
- —
- Total cash needed
- —
Loan-product check · same deal, 3 products live
Conventional
25% down · 7.5% · 30yr
- Down + closing
- —
- Monthly P&I
- —
- Monthly cashflow
- —
- DSCR
- —
- Eligible?
- —
Personal DTI + credit; lowest rate.
DSCR
20% down · 8.5% · 30yr
- Down + closing
- —
- Monthly P&I
- —
- Monthly cashflow
- —
- DSCR
- —
- Eligible?
- —
No personal income docs; deal must DSCR.
Hard money
10% down · 12.0% · 12mo
- Down + closing
- —
- Monthly P&I
- —
- Monthly cashflow
- —
- DSCR
- —
- Eligible?
- —
Short-term bridge; refi at stabilization.
Listing history 11 events
-
2026-06-18days on market $44,900 Active 14 DOM
-
2026-06-17days on market $44,900 Active 13 DOM
-
2026-06-16days on market $44,900 Active 12 DOM
-
2026-06-15days on market $44,900 Active 11 DOM
-
2026-06-13days on market $44,900 Active 9 DOM
-
2026-06-12days on market $44,900 Active 8 DOM
-
2026-06-09days on market $44,900 Active 5 DOM
-
2026-06-08days on market $44,900 Active 4 DOM
-
2026-06-07days on market $44,900 Active 3 DOM
-
2026-06-07remarks 699-char remark
-
2026-06-07$44,900 Active 2 DOM
ⓘ Source: listings_history table (triggers on properties + properties_extension) + one-shot
backfill from property_details.listing_events for pre-trigger history.
Tax reassessment forecast MI · Partial reset (capped growth)
- Current annual tax
- $269 · $22/mo
- Projected year-2 tax
- $480 · $40/mo
- Expected delta
- +$211/yr (+$18/mo · 78.6%)
ⓘ Screening estimate from a state-policy table — verify with the county assessor before closing.
Climate risk First Street
- Flood 1/10 Low FEMA zone X (unshaded) · 0% chance over 30 yrs
- Wildfire 3/10 Moderate
- Heat 2/10 Low 7 d/yr ≥95°F today · 13 d/yr by 30 yrs out
- Wind 1/10 Low
- Air quality 2/10 Low 0 unhealthy d/yr today · 1 by 30 yrs out
Nearby sold comps map
Loading sold comps map…
Walkable amenities ~0.75 mi
Loading nearby amenities…
Taxation est. · year 1
- Rental income
- $10,602
- − Mortgage interest
- −$2,515
- − Property taxes
- −$269
- − Insurance
- −$224
- − Repairs & maintenance
- −$848
- − Management
- −$848
- − Depreciation
- −$1,306
- Taxable income
- $4,591
- Est. tax owed @ 24.0%
- −$1,102
- After-tax cash flow
- $3,955/yr
For passive investors: Depreciation is non-cash, so a rental often shows a tax loss while cash-flowing — sheltering income. Rental losses are passive: they offset passive income freely, and up to $25,000/yr can offset ordinary (W-2) income if you actively participate and your MAGI is under $100k (phasing out to $0 by $150k); unused losses carry forward. On sale, claimed depreciation is recaptured at up to 25%, and gains may owe capital-gains tax (a 1031 exchange can defer both). Figures are a year-1 estimate at your 24.0% rate — not tax advice; consult a CPA.
Schools (NCES district)
- District
- West Branch-Rose City Area Schools
- NCES district ID
- 2635850
- Math proficiency
- 27% ▼ -14.00%
- Reading proficiency
- 43% ▼ -10.00%
- Median HH income
- $38,145
- Composite
- 29.15/100
- National rank
- #6580
- State rank
- #306 of 540 in MI
Livability — Bourret
No livability data for this city. (Only ~50 U.S. cities are tracked.)
Census & demographics
- Population (ZIP)
- 3,261
Population outlook (Gladwin County) Hauer SSP2
- Today (2025)
- 23,440 people
- By 2030
- 22,281 · -4.9%
- By 2040
- 19,867 · -15.2%
- By 2050
- 17,667 · -24.6%
- By 2075
- 12,909 · -44.9%
- By 2100
- 8,629 · -63.2%
Race, ethnicity, and origin ACS 2023
- Neighborhood character
- Predominantly White (94%)
- Race & ethnicity
- White 94% Two or more races 4% Hispanic / Latino 3%
- Common ancestry
- Romanian 7% Lithuanian 4% Slovak 3%
- Foreign-born
- 0%
Political lean MEDSL · Gladwin
- 2024 margin
- Solid R (+40.7) · D 29.1% · R 69.8% · Other 1.1%
- 2008→2024 swing
- -42.2pp toward R · 2008: 1.5pp · 2024: -40.7pp
- All cycles
- 2024: R+40.7 2020: R+36.8 2016: R+34.7 2012: R+7.2 2008: D+1.5
Not yet ingested
- Civics
- —
Market trends
- HPI YoY
- ▼ -95.02%
- Current HPI
- 125.4127
- Rent YoY
- —
- Metro
- —
- State GDP YoY
- ▲ 1.37%
- F500 in state
- 28
Industry mix (Fortune 500 HQ in MI)
| Industry | F500 HQs | Revenue |
|---|---|---|
| Automotive Parts | 3 | $48B |
|
||
| Automotive | 2 | $372B |
|
||
| Chemicals | 1 | $45B |
|
||
| Automotive Retail | 1 | $29B |
|
||
| Healthcare / Medical Devices | 1 | $23B |
|
||
| Automotive Technology | 1 | $20B |
|
||
Price history
+29.1% since first listed26 events — show timeline
- 2026-06-02 Listed $44,900 REALCOMP
- 2026-06-02 Listed $44,900 MiRealSource-MiMLS
- 2025-10-15 Listing Removed — MiRealSource-MiMLS
- 2025-10-14 Relisted — REALCOMP
- 2025-10-14 Relisted — MiRealSource-MiMLS
- 2025-09-08 Pending — REALCOMP
- 2025-09-08 Pending — MiRealSource-MiMLS
- 2025-09-08 Listing Removed — REALCOMP
- 2025-08-01 Price Changed $42,000 MiRealSource-MiMLS
- 2025-07-31 Price Changed $42,000 REALCOMP
- 2025-07-01 Price Changed $49,900 MiRealSource-MiMLS
- 2025-06-30 Price Changed $49,900 REALCOMP
- 2025-04-23 Listed $55,500 REALCOMP
- 2025-04-23 Listed $55,500 MiRealSource-MiMLS
- 2025-01-24 Listing Removed — REALCOMP
- 2025-01-24 Listing Removed — MiRealSource-MiMLS
- 2024-11-11 Price Changed $59,900 MiRealSource-MiMLS
- 2024-10-12 Price Changed $64,900 MiRealSource-MiMLS
- 2024-08-27 Listed $59,900 REALCOMP
- 2024-08-27 Listed $69,900 MiRealSource-MiMLS
- 2020-07-08 Sold (MLS) $34,777 SW Michigan MLS
- 2020-07-08 Sold (MLS) $34,777 REALCOMP
- 2020-01-07 Listed $34,777 MiRealSource-MiMLS
- 2020-01-07 Listed $34,777 SW Michigan MLS
- 2020-01-07 Listed $34,777 MiRealSource-MiMLS
- 2020-01-07 Listed $34,777 REALCOMP
Property tax history
-4.0%/yrLatest (2025): $269 · -80.0% YoY. Source: county tax records.
Cash-flow waterfall
monthlySold comps — $/sqft
last 12 mo · ≤1 miLoading sold comps…