 🏗️ New Construction
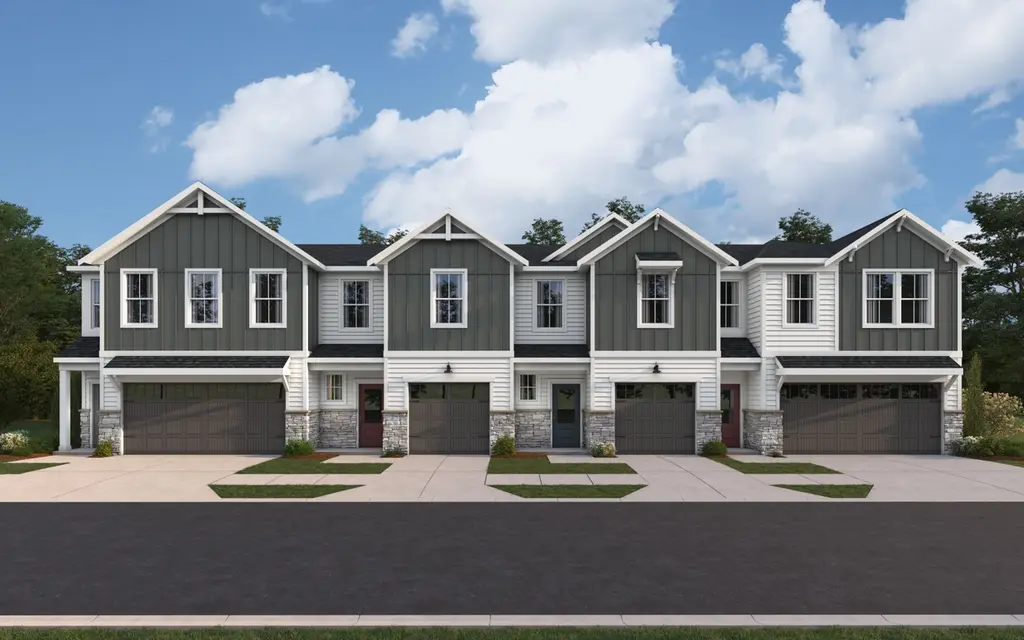
Wilder Plan · McCordsville, IN
Flood risk No data
- FEMA flood zone
- —
- Chance of flooding over 30 yrs
- —
- Est. flood insurance / yr
- —
Fire risk No data
- Est. fire insurance / yr
- —
Heat risk No data
- Hot days now (above threshold)
- —
- Hot days in 30 yrs
- —
Wind risk No data
- Chance of severe wind over 30 yrs
- —
Air-quality risk No data
- Unhealthy air days now
- —
- Unhealthy air days in 30 yrs
- —
Risk factors via First Street. Map © Google.
Why this score? — see what drove the D grade
The composite is a weighted blend of 9 inputs, each scored 0–100. Each bar is that input's sub-score; the figure is the points it added to the 100-point composite (weight × sub-score).
- Cash flow +10.8/30.0
- ARV discount +7.5/15.0
- Condition / age +4.8/5.0
- Schools +4.1/10.0
- Rent growth +3.8/5.0
- Livability +3.5/5.0
- 1% rule +3.2/10.0
- DSCR +3.1/10.0
- Appreciation +0.0/10.0
$285,990
🖨 Deal sheet 📄 Offer letter ✓ Due diligence
Listing remarks
The Wilder by Fischer Homes offers a beautifully designed open floor plan with an island kitchen, perfect for modern living and entertaining. The main level features a kitchen, living room, and dining room, perfect for entertaining. Enjoy versatile spaces with an included loft. Outdoor living is enhanced with a patio, while the two-car garage adds convenience. Optional features like an electric fireplace provide additional style and comfort, making the Wilder a versatile and inviting home.
Key facts
- Island kitchen
- Patio
- Electric fireplace
Tags
Property features AI
Finance
- Other: Virtual tour available
- Financial info: List price $385,990
Exterior
- Parking: 2 garage spaces (2 parking spaces total)
- Home design: New construction plan (Wilder)
- Exterior features: Address: 6046 Windsor Dr, McCordsville, IN 46055; Living area approximately 1,856
Interior
- Kitchen: Standard kitchen included (plan details)
- Bedrooms: 3 bedrooms
- Bathrooms: 2 full bathrooms and 1 half bathroom
- Interior features: Open living area (plan: Wilder)
Neighborhood map
What this means for you Summary
Snapshot
- This is a 3-bed/2.5-bath townhouse listed at $286k. Condition is rated excellent.
Deal economics
- At list price, monthly cash flow is $-140 ($-2k/yr) — negative.
- To cash-flow at today's rent, offer at most $280k (1.9% below list).
- To meet the 1% rule (rent ≥ 1% of price), the offer needs to be $245k (14.2% below list).
- Recommended offer: $245k (14.2% below list) — sets the bar for 1% rule.
- Cap rate 5.7% vs local median 3.9% in McCordsville — top-decile yield for the area; either an underpriced asset or a hidden risk that comps aren't pricing in. Stress-test before assuming the spread holds.
Location & tenants
- Location reads 69/100 on livability (#181 in IN) — a middle-class / working-renter tenant base. Strengths: employment A+, cost of living A+, housing A+; Watch: amenities F, commute F, health & safety F.
- Mt Vernon Community School Corporation (rural): math 43% / reading 48% proficiency, ranked #70 of 301 in IN (top 23%) — families likely to look elsewhere, expect single-tenant / working-renter base with shorter leases; only 18% free/reduced lunch — higher-income household profile.
- Market conditions: Rents rising fast (+5.2%/yr); 422 active listings in the ZIP; 11 comparable units currently listed for rent nearby; rentals leasing fast (median 8d on market — plan ~1-2 weeks tenant-placement turnaround); high-income renter base; 1,091 units permitted in Hancock County in 2024 (0 in 5+ unit buildings).
Forward outlook
- Local home prices are declining (-3.0%/yr); year-one equity from $2k of loan paydown is wiped out by about $9k of value loss. Plan a longer hold.
- Hancock County population projected at +7% by 2050 — modest demand growth; plan on rents tracking national, not racing it.
Negotiation context
- Only 7 days on market — expect competitive offers; lowballing is unlikely to land.
Questions for the listing agent
- What do current leases actually rent for vs. the listed asking? Can we see a recent rent roll and the last 12 months of T-12 income?
- Is there a deadline driving the sale (1031 exchange, divorce, estate, relocation)? That informs how much negotiation room exists.
- Schools are B-rated — typically a magnet for longer-tenancy family renters. What's the average tenant stay here, and is there a school-zone premium baked into asking?
- The area grade is low — what's the realistic commute time and amenity access for the typical tenant pool here? Any planned neighborhood developments (good or bad) we should know about?
- What's the average days-on-market for RENTAL listings here right now (not sales)? A rising rental-DOM trend means longer vacancies and softer asking-rent achievability than the comps imply.
- What's the recent tenant-quality profile in this submarket — average credit score on applications, eviction rate, late-payment / NSF rate, and stable-employment percentage? A property-management company in the area should have these aggregated.
- How much new for-sale + rental construction is in the pipeline within 1–3 miles? Heavy new supply typically softens prices + rents 12–24 months out; constrained supply supports both.
Investment metrics
- 1% rule
- 0.82% ✗
- Cap rate
- 5.74%
- Cash-on-cash
- -1.99%
- DSCR
- 0.91
- GRM
- 10.2
CMA / ARV
- ARV (on-the-fly)
- $300,672
- Comps found
- 10
Show comp detail 10 sales within ~0.75 mi
| Address | Dist | Beds/Ba | Sqft | Sold | Price | $/sf | Match |
|---|---|---|---|---|---|---|---|
| 7348 W County Road 600 Rd Unit 12-604 | 0.02mi | 3/2.5 | 2,127 (+15%) | 7mo | $305,000 | $143 | 69 |
| 5790 Arcade Blvd | 0.39mi | 3/2.5 | 2,021 (+9%) | 2mo | $300,400 | $149 | 65 |
| 7343 Bayview Run Unit 11-604 | 0.07mi | 3/3.5 | 2,127 (+15%) | 6mo | $351,046 | $165 | 64 |
| 7318 W County Road 600 Rd Unit 14-605 | 0.05mi | 3/3.5 | 2,059 (+11%) | 18mo | $350,000 | $170 | 60 |
| 5771 CR W 750 N | 0.42mi | 3/2.5 | 2,021 (+9%) | 10mo | $327,499 | $162 | 57 |
| 5767 CR W 750 N | 0.43mi | 3/2.5 | 2,021 (+9%) | 13mo | $315,000 | $156 | 54 |
| 5729 CR W 750 N | 0.46mi | 3/2.5 | 2,021 (+9%) | 14mo | $319,999 | $158 | 52 |
| 5723 CR W 750 | 0.47mi | 3/2.5 | 2,021 (+9%) | 14mo | $309,999 | $153 | 51 |
| 5724 Arcade Blvd | 0.45mi | 3/2.5 | 2,021 (+9%) | 16mo | $329,999 | $163 | 50 |
| 7314 W County Road 600 Rd Unit 14-604 | 0.05mi | 4/3.5 (+1) | 2,127 (+15%) | 18mo | $358,990 | $169 | 49 |
Match score weights: distance 35% · size 25% · config 20% · recency 20%. Top-matched comps best support the ARV.
Projected returns pro-forma
-3.0% appreciation · 5.18% rent growth · sell at horizon
- IRR
- -17.2%
- Equity multiple
- 0.38×
- Total profit
- $-52,088
- Equity at exit
- $44,831
- IRR
- -5.5%
- Equity multiple
- 0.61×
- Total profit
- $-33,078
- Equity at exit
- $25,997
Cash invested: $84,188 (down + closing). Projections, not guarantees.
Landlord ↔ Tenant lean methodology
- Overall (STATE)
- 90 Strongly Landlord-Friendly
- State Indiana
- 90 Strongly Landlord-Friendly · R+11
- County
- — inherits STATE
- City
- — inherits STATE
ZIP-level market 46055
- Home prices YoY
- -20.1%
- Rents YoY
- 5.2%
- Active inventory
- 422
- Price-to-rent
- 9.7×
Monthly cashflow live
- Estimated rent
- $2,453 high interval (Pro) →
- Mortgage (P&I)
- −$1,577
- Tax est. 1.5%
- −$376 /mo · $4,510/yr
- Insurance
- −$125
- HOA
- −$0
- Vacancy / Maint / Mgmt
- −$515
- Net cashflow
- $-140
Break-even live
UW: 25.0% down · 7.5% · 30yr · 1.5% tax · 5.0% vac · 8.0% maint · 8.0% mgmt
Financing live
Cash to close
- Down payment
- $75,168
- Closing costs
- $9,020
- Reserves months
- —
- Total cash needed
- —
Loan-product check · same deal, 3 products live
Conventional
25% down · 7.5% · 30yr
- Down + closing
- —
- Monthly P&I
- —
- Monthly cashflow
- —
- DSCR
- —
- Eligible?
- —
Personal DTI + credit; lowest rate.
DSCR
20% down · 8.5% · 30yr
- Down + closing
- —
- Monthly P&I
- —
- Monthly cashflow
- —
- DSCR
- —
- Eligible?
- —
No personal income docs; deal must DSCR.
Hard money
10% down · 12.0% · 12mo
- Down + closing
- —
- Monthly P&I
- —
- Monthly cashflow
- —
- DSCR
- —
- Eligible?
- —
Short-term bridge; refi at stabilization.
Rent comps 11 comps
| Address | Beds | Baths | Sqft | Rent | $/sqft | DOM | Units | Dist |
|---|---|---|---|---|---|---|---|---|
| 6032 Windsor Dr Unit MC McCordsville, IN | 3.0 | 4.0 | 2320 | $2,400 | $1.03 | 23d | 1 | 0.01mi |
| 5790 Arcade Blvd McCordsville, IN | 3.0 | 2.5 | 2021 | $2,250 | $1.11 | 20d | 1 | 0.40mi |
| 5743 W 750 N Unit 5743 750 McCordsville, IN | 3.0 | 2.5 | 2400 | $2,050 | $0.85 | 4d | 1 | 0.45mi |
| 7044 N Mesquite Ct McCordsville, IN | 3.0 | 2.0 | 2073 | $1,991 | $0.96 | 7d | 1 | 0.72mi |
| 6654 Willow Way McCordsville, IN | 3.0–4.0 | 2.0–2.5 | 1810 | $2,485 | $1.37 | 1d | 10 | 0.98mi |
| 5510 Wood Spring Ln McCordsville, IN | 3.0 | 2.5 | 2009 | $2,091 | $1.04 | 21d | 1 | 1.07mi |
| 6267 Cypress Ct McCordsville, IN | 3.0 | 2.0 | 1673 | $2,500 | $1.49 | 2d | 1 | 1.07mi |
| 5871 Broadacre Dr McCordsville, IN | 1.0–3.0 | 1.0–2.0 | 978 | $2,285 | $2.34 | 2d | 150 | 1.34mi |
| 6077 W Jamison Dr McCordsville, IN | 4.0 | 2.5 | 1951 | $2,569 | $1.32 | 4d | 1 | 1.37mi |
| 7427 Cobblestone West Dr Indianapolis, IN | 3.0 | 2.0 | 1704 | $1,931 | $1.13 | 7d | 1 | 1.45mi |
| 6055 W Brickell Ln McCordsville, IN | 3.0 | 2.0 | 1827 | $2,211 | $1.21 | 16d | 1 | 1.47mi |
Listing history 8 events
-
2026-06-18price $285,990 Active 7 DOM
-
2026-06-18days on market $385,990 Active 7 DOM
-
2026-06-17days on market $385,990 Active 6 DOM
-
2026-06-16days on market $385,990 Active 5 DOM
-
2026-06-15days on market $385,990 Active 4 DOM
-
2026-06-13days on market $385,990 Active 2 DOM
-
2026-06-13remarks 494-char remark
-
2026-06-13$385,990 Active 1 DOM
ⓘ Source: listings_history table (triggers on properties + properties_extension) + one-shot
backfill from property_details.listing_events for pre-trigger history.
Nearby sold comps map
Loading sold comps map…
Walkable amenities ~0.75 mi
Loading nearby amenities…
Taxation est. · year 1
- Rental income
- $29,440
- − Mortgage interest
- −$16,842
- − Property taxes
- −$4,510
- − Insurance
- −$1,503
- − Repairs & maintenance
- −$2,355
- − Management
- −$2,355
- − Depreciation
- −$8,747
- Taxable loss
- −$6,873
- Est. tax savings @ 24.0%
- +$1,650
- After-tax cash flow
- $-28/yr
For passive investors: Depreciation is non-cash, so a rental often shows a tax loss while cash-flowing — sheltering income. Rental losses are passive: they offset passive income freely, and up to $25,000/yr can offset ordinary (W-2) income if you actively participate and your MAGI is under $100k (phasing out to $0 by $150k); unused losses carry forward. On sale, claimed depreciation is recaptured at up to 25%, and gains may owe capital-gains tax (a 1031 exchange can defer both). Figures are a year-1 estimate at your 24.0% rate — not tax advice; consult a CPA.
Condition & rehab AI · 13 photos
This townhouse is in excellent condition with no visible repairs needed. It offers a well-maintained exterior, fresh interior, and a great curb appeal, making it an attractive investment.
Value-add opportunities
- Both Painting the exterior — Fresh paint enhances curb appeal and can increase both resale and rental value.
- Both Landscaping improvements — Enhanced landscaping can increase curb appeal and attract more potential buyers or renters.
- Both Interior touch-ups — Fresh paint and minor touch-ups can make the interior more inviting and increase both resale and rental value.
Renovation cost estimate screening
Value-add ROI direction
- Both Painting the exterior — Fresh paint enhances curb appeal and can increase both resale and rental value. ↑
- Both Landscaping improvements — Enhanced landscaping can increase curb appeal and attract more potential buyers or renters. ↑
- Both Interior touch-ups — Fresh paint and minor touch-ups can make the interior more inviting and increase both resale and rental value. ↑
ⓘ Cost ranges are severity-bucket heuristics (US national rule-of-thumb). Get contractor quotes + a written scope before underwriting a rehab budget.
Schools (NCES district)
- District
- Mt Vernon Community School Corporation
- NCES district ID
- 1807260
- Math proficiency
- 43% ▼ -12.00%
- Reading proficiency
- 48% ▼ -7.00%
- Median HH income
- $73,671
- Composite
- 41.3/100
- National rank
- #3514
- State rank
- #70 of 301 in IN
Livability — McCordsville
- Score
- 69/100
- State rank
- #181
- US rank
- #8388
Category grades
Schools grade is shown separately in the Schools card above.
Census & demographics
- Census place
- McCordsville, IN
- County
- Hancock County · 59,521 people
- City population
- 16,010
- Metro
- Indianapolis-Carmel-Anderson, IN
- Population (ZIP)
- 16,010
- Household income
- $113,784
- Rent vs Own
- Severe rent burden
- 58.0
Population outlook (Hancock County) Hauer SSP2
- Today (2025)
- 77,820 people
- By 2030
- 79,914 · +2.7%
- By 2040
- 82,734 · +6.3%
- By 2050
- 83,348 · +7.1%
- By 2075
- 82,439 · +5.9%
- By 2100
- 74,181 · -4.7%
Race, ethnicity, and origin ACS 2023
- Neighborhood character
- Predominantly White (77%)
- Race & ethnicity
- White 77% Black 13% Two or more races 6% Hispanic / Latino 4% Asian 1%
- Common ancestry
- Lithuanian 3% Italian 3% Romanian 3%
- Foreign-born
- 4% · Canada, Vietnam, Jamaica
- Languages at home
- 94% English-only · Spanish 4%
Political lean MEDSL · Hancock
- 2024 margin
- Solid R (+33.7) · D 32.2% · R 65.9% · Other 1.9%
- 2008→2024 swing
- -4.1pp toward R · 2008: -29.6pp · 2024: -33.7pp
- All cycles
- 2024: R+33.7 2020: R+37.5 2016: R+44.8 2012: R+41.0 2008: R+29.6
Not yet ingested
- Civics
- —
Market trends
- HPI YoY
- ▼ -52.35%
- Current HPI
- 207.9764
- Rent YoY
- ▲ 5.18%
- Metro
- Indianapolis-Carmel-Anderson, IN
- State GDP YoY
- ▲ 2.90%
- F500 in state
- 18
Industry mix (Fortune 500 HQ in IN)
| Industry | F500 HQs | Revenue |
|---|---|---|
| Industrial Machinery | 2 | $37B |
|
||
| Healthcare | 1 | $177B |
|
||
| Pharmaceuticals | 1 | $45B |
|
||
| Metals / Steel | 1 | $18B |
|
||
| Agriculture | 1 | $17B |
|
||
| Packaging | 1 | $12B |
|
||
Cash-flow waterfall
monthlySold comps — $/sqft
last 12 mo · ≤1 miLoading sold comps…