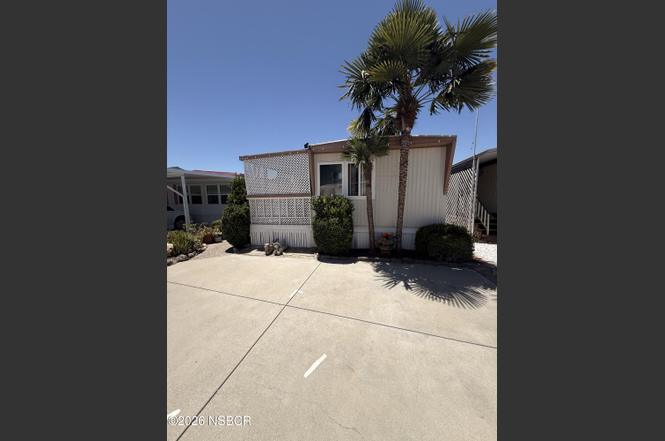
80 Zaca St #17 · Buellton, CA
Flood risk 1/10 · Minimal
- FEMA flood zone
- X (unshaded)
- Chance of flooding over 30 yrs
- 0.0%
- Est. flood insurance / yr
- $507 – $1,088
Fire risk 6/10 · Moderate
- Est. fire insurance / yr
- $659 – $1,223
Heat risk 3/10 · Minor
- Hot days now (above 89°F)
- 7 days/yr
- Hot days in 30 yrs
- 17 days/yr
Wind risk 1/10 · Minimal
- Chance of severe wind over 30 yrs
- —
Air-quality risk 5/10 · Moderate
- Unhealthy air days now
- 8 days/yr
- Unhealthy air days in 30 yrs
- 8 days/yr
Risk factors via First Street. Map © Google.
Why this score? — see what drove the B+ grade
The composite is a weighted blend of 9 inputs, each scored 0–100. Each bar is that input's sub-score; the figure is the points it added to the 100-point composite (weight × sub-score).
- Cash flow +30.0/30.0
- ARV discount +15.0/15.0
- DSCR +10.0/10.0
- 1% rule +8.8/10.0
- Schools +4.7/10.0
- Livability +3.2/5.0
- Rent growth +2.5/5.0
- Condition / age +2.5/5.0
- Appreciation +0.0/10.0
$169,000
🖨 Deal sheet 📄 Offer letter ✓ Due diligence
Listing remarks
Welcome to easy living in one of Buellton's desirable 55+ communities! This well-maintained home offers a comfortable and inviting floor plan featuring a spacious living room, updated flooring, abundant storage, and a generous primary bedroom with built-in cabinetry and vanity area. Enjoy peaceful mornings on the covered front porch or unwind in the private backyard patio surrounded by honeysuckle, plum and lemon trees and charming garden spaces. The low-maintenance yard, attractive curb appeal, and ample parking make this home both practical and inviting. Residents enjoy access to exceptional community amenities, including a clubhouse with gathering spaces, a library, a community kitchen,
Key facts
- Covered front porch
- Built-in cabinetry
- Community amenities
Tags
Property features AI
Finance
- HOA & community: Age-restricted community; Pets allowed; Monthly land lease of $596.29
Exterior
- Utilities: Public water; Public sewer
- Home design: Manufactured home; Single-story (manufactured); Mobile dimensions approximately 60 ft by 12 ft
- Construction: Aluminum siding construction; Raised foundation; Metal roof; Manufacturer/Make: KIT/KIT
- Exterior features: Aluminum siding; Raised foundation; Metal roof
Interior
- Kitchen: Microwave; Refrigerator
- Flooring: Carpet; Laminate
- Bathrooms: 1 full bathroom
- Heating & cooling: Forced air heating; Ceiling fan cooling
- Interior features: Carpet and laminate flooring; Laundry inside
- Laundry & utility: Washer included; Dryer included
Neighborhood map
What this means for you Summary
Snapshot
- This is a 2-bed/1.0-bath manufactured listed at $169k.
Deal economics
- At list price, monthly cash flow is $672 ($8k/yr) — positive.
- The deal already cash-flows at list — no discount required.
- Meets the 1% rule at list price ($2k rent vs $169k).
- Cap rate 11.1% vs local median 3.0% in Buellton — top-decile yield for the area; either an underpriced asset or a hidden risk that comps aren't pricing in. Stress-test before assuming the spread holds.
Location & tenants
- Location reads 63/100 on livability (#438 in CA) — a middle-class / working-renter tenant base. Strengths: employment A+, housing A+, crime B; Watch: amenities F, commute F, cost of living F.
- Santa Ynez Valley Union High (town): math 37% / reading 60% proficiency, ranked #386 of 1,400 in CA (top 28%) — families likely to look elsewhere, expect single-tenant / working-renter base with shorter leases.
- Market conditions: 36 active listings in the ZIP; 719 units permitted in Santa Barbara County in 2024 (217 in 5+ unit buildings).
Forward outlook
- Local home prices are declining (-3.0%/yr); year-one equity from $1k of loan paydown is wiped out by about $5k of value loss. Plan a longer hold.
- Santa Barbara County population projected at +20% by 2050 — long-run rental-demand tailwind backs the buy-and-hold thesis.
- At projected returns (-3.0% appreciation + 3.0% rent growth), your $47k cash investment doubles in ~8 years — after that, you're playing with house money.
Negotiation context
- Only 8 days on market — expect competitive offers; lowballing is unlikely to land.
- 6 sale attempts since 13y ago with the ask held roughly flat each time — persistent listings suggest the price (not the market) is what's stuck; bring a comps-based counter.
Risks & watch-outs
- Climate carrying-cost: major wildfire risk — expect insurance premiums to compound above CPI over the hold.
Questions for the listing agent
- Built in 1968 — when were the roof, HVAC, electrical panel, plumbing, and water heater last replaced?
- Is there a deadline driving the sale (1031 exchange, divorce, estate, relocation)? That informs how much negotiation room exists.
- What's the average days-on-market for RENTAL listings here right now (not sales)? A rising rental-DOM trend means longer vacancies and softer asking-rent achievability than the comps imply.
- What's the recent tenant-quality profile in this submarket — average credit score on applications, eviction rate, late-payment / NSF rate, and stable-employment percentage? A property-management company in the area should have these aggregated.
- How much new for-sale + rental construction is in the pipeline within 1–3 miles? Heavy new supply typically softens prices + rents 12–24 months out; constrained supply supports both.
Investment metrics
- 1% rule
- 1.38% ✓
- Cap rate
- 11.06%
- Cash-on-cash
- 17.04%
- DSCR
- 1.76
- GRM
- 6.0
CMA / ARV
- ARV (on-the-fly)
- $205,200
- Comps found
- 1
Show comp detail 1 sale within ~0.75 mi
| Address | Dist | Beds/Ba | Sqft | Sold | Price | $/sf | Match |
|---|---|---|---|---|---|---|---|
| 80 Zaca St #42 | 0.08mi | 2/1.0 | 720 (0%) | 9mo | $205,000 | $285 | 89 |
Match score weights: distance 35% · size 25% · config 20% · recency 20%. Top-matched comps best support the ARV.
Projected returns pro-forma
-3.0% appreciation · 3.0% rent growth · sell at horizon
- IRR
- 8.3%
- Equity multiple
- 1.33×
- Total profit
- $15,452
- Equity at exit
- $25,198
- IRR
- 17.6%
- Equity multiple
- 2.45×
- Total profit
- $68,712
- Equity at exit
- $14,612
Cash invested: $47,320 (down + closing). Projections, not guarantees.
Landlord ↔ Tenant lean methodology
- Overall (STATE)
- 18 Strongly Tenant-Friendly
- State California
- 18 Strongly Tenant-Friendly · D+13
- County
- — inherits STATE
- City
- — inherits STATE
ZIP-level market 93427
- Active inventory
- 36
- Price-to-rent
- 6.0×
Monthly cashflow live
- Estimated rent
- $2,329 medium interval (Pro) →
- Mortgage (P&I)
- −$886
- Tax est. 1.5%
- −$211 /mo · $2,535/yr
- Insurance
- −$70
- HOA
- −$0
- Vacancy / Maint / Mgmt
- −$489
- Net cashflow
- $672
Break-even live
UW: 25.0% down · 7.5% · 30yr · 1.5% tax · 5.0% vac · 8.0% maint · 8.0% mgmt
Financing live
Cash to close
- Down payment
- $42,250
- Closing costs
- $5,070
- Reserves months
- —
- Total cash needed
- —
Loan-product check · same deal, 3 products live
Conventional
25% down · 7.5% · 30yr
- Down + closing
- —
- Monthly P&I
- —
- Monthly cashflow
- —
- DSCR
- —
- Eligible?
- —
Personal DTI + credit; lowest rate.
DSCR
20% down · 8.5% · 30yr
- Down + closing
- —
- Monthly P&I
- —
- Monthly cashflow
- —
- DSCR
- —
- Eligible?
- —
No personal income docs; deal must DSCR.
Hard money
10% down · 12.0% · 12mo
- Down + closing
- —
- Monthly P&I
- —
- Monthly cashflow
- —
- DSCR
- —
- Eligible?
- —
Short-term bridge; refi at stabilization.
Listing history 6 events
-
2026-06-18days on market $169,000 Active 8 DOM
-
2026-06-17days on market $169,000 Active 7 DOM
-
2026-06-16days on market $169,000 Active 6 DOM
-
2026-06-15days on market $169,000 Active 5 DOM
-
2026-06-14remarks 699-char remark
-
2026-06-14$169,000 Active 3 DOM
ⓘ Source: listings_history table (triggers on properties + properties_extension) + one-shot
backfill from property_details.listing_events for pre-trigger history.
Climate risk First Street
- Flood 1/10 Low FEMA zone X (unshaded) · 0% chance over 30 yrs
- Wildfire 6/10 Major
- Heat 3/10 Moderate 7 d/yr ≥89°F today · 17 d/yr by 30 yrs out
- Wind 1/10 Low
- Air quality 5/10 Major 8 unhealthy d/yr today · 8 by 30 yrs out
Nearby sold comps map
Loading sold comps map…
Walkable amenities ~0.75 mi
Loading nearby amenities…
Taxation est. · year 1
- Rental income
- $27,949
- − Mortgage interest
- −$9,467
- − Property taxes
- −$2,535
- − Insurance
- −$845
- − Repairs & maintenance
- −$2,236
- − Management
- −$2,236
- − Depreciation
- −$4,916
- Taxable income
- $5,714
- Est. tax owed @ 24.0%
- −$1,371
- After-tax cash flow
- $6,693/yr
For passive investors: Depreciation is non-cash, so a rental often shows a tax loss while cash-flowing — sheltering income. Rental losses are passive: they offset passive income freely, and up to $25,000/yr can offset ordinary (W-2) income if you actively participate and your MAGI is under $100k (phasing out to $0 by $150k); unused losses carry forward. On sale, claimed depreciation is recaptured at up to 25%, and gains may owe capital-gains tax (a 1031 exchange can defer both). Figures are a year-1 estimate at your 24.0% rate — not tax advice; consult a CPA.
Schools (NCES district)
- District
- Santa Ynez Valley Union High
- NCES district ID
- 0635850
- Math proficiency
- 37% ▼ -8.00%
- Reading proficiency
- 60% ▼ -13.00%
- Median HH income
- $85,622
- Composite
- 46.97/100
- National rank
- #5151
- State rank
- #386 of 1400 in CA
Livability — Buellton
- Score
- 63/100
- State rank
- #438
- US rank
- #15010
Category grades
Schools grade is shown separately in the Schools card above.
Census & demographics
- Census place
- Buellton, CA
- Population (ZIP)
- 5,866
Population outlook (Santa Barbara County) Hauer SSP2
- Today (2025)
- 484,679 people
- By 2030
- 505,323 · +4.3%
- By 2040
- 545,783 · +12.6%
- By 2050
- 584,263 · +20.5%
- By 2075
- 682,586 · +40.8%
- By 2100
- 723,188 · +49.2%
Race, ethnicity, and origin ACS 2023
- Neighborhood character
- Predominantly White (72%)
- Race & ethnicity
- White 72% Hispanic / Latino 24% Two or more races 8%
- Hispanic origin (detail)
- Mexican 19%
- Common ancestry
- Slovak 5% Italian 3% Lithuanian 2%
- Foreign-born
- 14% · Canada, Jamaica
- Languages at home
- 80% English-only · Spanish 15% French/Haitian/Cajun 2% Other Indo-European 2%
Political lean MEDSL · Santa Barbara
- 2024 margin
- Strong D (+26.7) · D 61.8% · R 35.1% · Other 3.1%
- 2008→2024 swing
- +3.8pp toward D · 2008: 22.9pp · 2024: 26.7pp
- All cycles
- 2024: D+26.7 2020: D+32.1 2016: D+28.2 2012: D+17.1 2008: D+22.9
Not yet ingested
- Civics
- —
Market trends
- HPI YoY
- ▼ -432.89%
- Current HPI
- 247.882
- Rent YoY
- —
- Metro
- —
- State GDP YoY
- ▲ 3.21%
- F500 in state
- 116
Industry mix (Fortune 500 HQ in CA)
| Industry | F500 HQs | Revenue |
|---|---|---|
| Technology | 27 | $1,492B |
|
||
| Financial Services | 3 | $174B |
|
||
| Retail | 3 | $44B |
|
||
| Insurance | 3 | $26B |
|
||
| Media / Entertainment | 2 | $115B |
|
||
| Pharmaceuticals / Biotech | 2 | $62B |
|
||
Price history
+566.1% since first listed11 events — show timeline
- 2026-06-10 Listed $169,000 NSBCRMLS
- 2025-06-25 Listing Removed — NSBCRMLS
- 2025-06-01 Listed $175,000 NSBCRMLS
- 2021-01-24 Listing Removed — SBMLS
- 2021-01-24 Listing Removed — NSBCRMLS
- 2021-01-22 Listed $78,000 SBMLS
- 2021-01-22 Listed $78,000 NSBCRMLS
- 2019-07-23 Listing Removed — NSBCRMLS
- 2019-07-12 Listed $77,000 NSBCRMLS
- 2013-05-11 Listing Removed — NSBCRMLS
- 2013-04-22 Listed $25,370 NSBCRMLS
Cash-flow waterfall
monthlySold comps — $/sqft
last 12 mo · ≤1 miLoading sold comps…