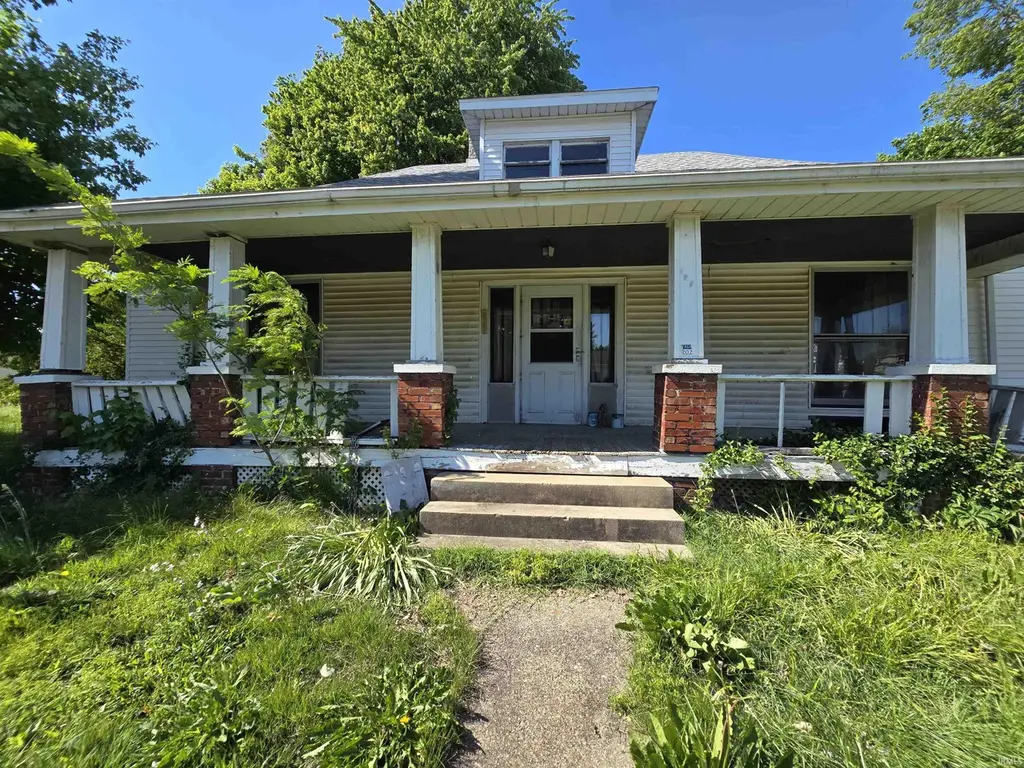
108 E Warrick St · Owensville, IN
Flood risk 1/10 · Minimal
- FEMA flood zone
- X (unshaded)
- Chance of flooding over 30 yrs
- 0.0%
- Est. flood insurance / yr
- $473 – $860
Fire risk 1/10 · Minimal
- Est. fire insurance / yr
- $717 – $1,331
Heat risk 5/10 · Moderate
- Hot days now (above 107°F)
- 7 days/yr
- Hot days in 30 yrs
- 19 days/yr
Wind risk 2/10 · Minimal
- Chance of severe wind over 30 yrs
- 3.0%
Air-quality risk 2/10 · Minimal
- Unhealthy air days now
- 1 days/yr
- Unhealthy air days in 30 yrs
- 2 days/yr
Risk factors via First Street. Map © Google.
Why this score? — see what drove the B grade
The composite is a weighted blend of 9 inputs, each scored 0–100. Each bar is that input's sub-score; the figure is the points it added to the 100-point composite (weight × sub-score).
- Cash flow +30.0/30.0
- 1% rule +10.0/10.0
- DSCR +10.0/10.0
- ARV discount +7.5/15.0
- Schools +4.7/10.0
- Livability +3.2/5.0
- Rent growth +2.5/5.0
- Condition / age +2.5/5.0
- Appreciation +0.0/10.0
$54,900
🖨 Deal sheet 📄 Offer letter ✓ Due diligence
Listing remarks
Investor special with character you just can’t recreate. This 3 bedroom, 1 bath home in Owensville is packed with original charm and waiting for the right buyer to bring it back to life. From the oversized covered front porch to the original woodwork, decorative fireplaces, stained glass details, vintage light fixtures, and hardwood floors, there is a lot here worth saving. With approximately 1,500 square feet, this home offers solid space and endless potential for a renovation project, rental investment, flip, or restoration. The property does need significant work and is being sold as-is, but the bones and character are hard to ignore. If you have been looking for a fixer upper with
Key facts
- Pocket doors
- Original woodwork
- 0.26 acre lot
Tags
Property features AI
Finance
- Other: Located in South Gibson School Corp. district
Exterior
- Utilities: Public water; Public sewer
- Home design: Single-family residence; Site-built home; One story
- Construction: Vinyl siding; Above-grade finished area listed (1,582)
- Exterior features: Corner lot; Sloped lot; Lot dimensions approximately 113 x 100.5
Interior
- Bedrooms: Total rooms: 6
- Bathrooms: Three full bathrooms; Two main-level bathrooms
- Heating & cooling: Natural gas forced-air heating; Cooling present (type: other)
- Interior features: Two fireplaces located in the family room and a bedroom; Partial basement
- Laundry & utility: Main-level laundry
Neighborhood map
What this means for you Summary
Snapshot
- This is a 3-bed/1.0-bath single-family listed at $55k.
Deal economics
- At list price, monthly cash flow is $549 ($7k/yr) — positive.
- The deal already cash-flows at list — no discount required.
- Meets the 1% rule at list price ($1k rent vs $55k).
- Recommended offer: $53k (3.0% below list) — sets the bar for market timing.
Location & tenants
- Location reads 63/100 on livability (#440 in IN) — a middle-class / working-renter tenant base. Strengths: crime A+, cost of living A+, housing A+; Watch: amenities F, commute F, employment D-.
- South Gibson School Corporation (rural): math 50% / reading 58% proficiency, ranked #31 of 301 in IN (top 10%) — acceptable for families but not a draw, mixed tenant base, ~2y average lease.
- Zoned schools: Owensville Community School (math 43% / reading 51%, grade D-, #325 of 994 statewide, top 36%, 415 students, 41% FRL); Gibson Southern High School (math 62% / reading 77%, grade B, #18 of 369 statewide, top 5%, 726 students, 23% FRL).
- Market conditions: 17 active listings in the ZIP; 167 units permitted in Gibson County in 2024 (68 in 5+ unit buildings).
Forward outlook
- Local home prices are declining (-3.0%/yr); year-one equity from $380 of loan paydown is wiped out by about $2k of value loss. Plan a longer hold.
- Gibson County population projected to shrink 10% by 2050 — rents likely to lag national; underwrite the cash flow, not the appreciation.
- At projected returns (-3.0% appreciation + 3.0% rent growth), your $15k cash investment doubles in ~3 years — after that, you're playing with house money.
Negotiation context
- It's been on market 37 days — a 3% lower offer ($53k) is reasonable based on typical stale-listing flexibility.
- 2 sale attempts with the ask held roughly flat each time — persistent listings suggest the price (not the market) is what's stuck; bring a comps-based counter.
- Current owner paid $36k; list at $55k implies a 54% gain — meaningful room to come down on a strong offer.
Risks & watch-outs
- Climate carrying-cost: extreme-heat days projected 7→19/yr by 2055 (HVAC capex compounding) — expect insurance premiums to compound above CPI over the hold.
Questions for the listing agent
- It's been on market 37 days. Have you received any prior offers? Is the seller open to a 3% concession, seller financing, or rate buy-down credit?
- Built in 1960 — when were the roof, HVAC, electrical panel, plumbing, and water heater last replaced?
- Is there a deadline driving the sale (1031 exchange, divorce, estate, relocation)? That informs how much negotiation room exists.
- Schools are D-rated, which usually means shorter tenancies and higher turnover. Who's the typical renter profile here, and what's been the actual vacancy rate?
- What's the average days-on-market for RENTAL listings here right now (not sales)? A rising rental-DOM trend means longer vacancies and softer asking-rent achievability than the comps imply.
- What's the recent tenant-quality profile in this submarket — average credit score on applications, eviction rate, late-payment / NSF rate, and stable-employment percentage? A property-management company in the area should have these aggregated.
- How much new for-sale + rental construction is in the pipeline within 1–3 miles? Heavy new supply typically softens prices + rents 12–24 months out; constrained supply supports both.
Investment metrics
- 1% rule
- 2.21% ✓
- Cap rate
- 18.30%
- Cash-on-cash
- 42.88%
- DSCR
- 2.91
- GRM
- 3.8
CMA / ARV
- ARV (median comp)
- $162,718
- List price
- $54,900
- Delta
- -66.26%
- Verdict
- UNDERPRICED
- Comps
- 20 within 1.0 mi
Show comp detail 6 sales within ~0.75 mi
| Address | Dist | Beds/Ba | Sqft | Sold | Price | $/sf | Match |
|---|---|---|---|---|---|---|---|
| 404 E Clark St | 0.27mi | 3/2.5 | 1,555 (-2%) | 13mo | $315,000 | $203 | 67 |
| 617 S Main St | 0.32mi | 4/1.0 (+1) | 1,728 (+9%) | 0mo | $93,000 | $54 | 64 |
| 601 E Clark St | 0.34mi | 3/1.0 | 1,650 (+4%) | 21mo | $164,900 | $100 | 59 |
| 304 E Maple St | 0.36mi | 3/1.5 | 1,551 (-2%) | 23mo | $191,900 | $124 | 59 |
| 6751 W North St | 0.52mi | 3/1.0 | 1,716 (+8%) | 14mo | $178,900 | $104 | 50 |
| 208 N First St | 0.29mi | 4/3.0 (+1) | 1,804 (+14%) | 19mo | $62,500 | $35 | 34 |
Match score weights: distance 35% · size 25% · config 20% · recency 20%. Top-matched comps best support the ARV.
Projected returns pro-forma
-3.0% appreciation · 3.0% rent growth · sell at horizon
- IRR
- 39.7%
- Equity multiple
- 2.70×
- Total profit
- $26,127
- Equity at exit
- $8,186
- IRR
- 46.1%
- Equity multiple
- 5.42×
- Total profit
- $67,948
- Equity at exit
- $4,747
Cash invested: $15,372 (down + closing). Projections, not guarantees.
Landlord ↔ Tenant lean methodology
- Overall (STATE)
- 90 Strongly Landlord-Friendly
- State Indiana
- 90 Strongly Landlord-Friendly · R+11
- County
- — inherits STATE
- City
- — inherits STATE
ZIP-level market 47665
- Home prices YoY
- -4.6%
- Active inventory
- 17
- Price-to-rent
- 3.8×
Monthly cashflow live
- Estimated rent
- $1,212 medium interval (Pro) →
- Mortgage (P&I)
- −$288
- Tax from tax record
- −$97 /mo · $1,168/yr
- Insurance
- −$23
- HOA
- −$0
- Vacancy / Maint / Mgmt
- −$255
- Net cashflow
- $549
Break-even live
UW: 25.0% down · 7.5% · 30yr · 1.5% tax · 5.0% vac · 8.0% maint · 8.0% mgmt
Financing live
Cash to close
- Down payment
- $13,725
- Closing costs
- $1,647
- Reserves months
- —
- Total cash needed
- —
Loan-product check · same deal, 3 products live
Conventional
25% down · 7.5% · 30yr
- Down + closing
- —
- Monthly P&I
- —
- Monthly cashflow
- —
- DSCR
- —
- Eligible?
- —
Personal DTI + credit; lowest rate.
DSCR
20% down · 8.5% · 30yr
- Down + closing
- —
- Monthly P&I
- —
- Monthly cashflow
- —
- DSCR
- —
- Eligible?
- —
No personal income docs; deal must DSCR.
Hard money
10% down · 12.0% · 12mo
- Down + closing
- —
- Monthly P&I
- —
- Monthly cashflow
- —
- DSCR
- —
- Eligible?
- —
Short-term bridge; refi at stabilization.
Listing history 19 events
-
2026-06-18days on market $54,900 Active 37 DOM
-
2026-06-17days on market $54,900 Active 36 DOM
-
2026-06-16days on market $54,900 Active 35 DOM
-
2026-06-15days on market $54,900 Active 34 DOM
-
2026-06-13days on market $54,900 Active 32 DOM
-
2026-06-12days on market $54,900 Active 31 DOM
-
2026-06-09days on market $54,900 Active 28 DOM
-
2026-06-08days on market $54,900 Active 27 DOM
-
2026-06-07days on market $54,900 Active 26 DOM
-
2026-06-07days on market $54,900 Active 25 DOM
-
2026-06-04days on market $54,900 Active 22 DOM
-
2026-06-02days on market $54,900 Active 21 DOM
-
2026-06-01days on market $54,900 Active 20 DOM
-
2026-05-31days on market $54,900 Active 19 DOM
-
2026-05-31days on market $54,900 Active 18 DOM
-
2026-05-11$54,900 Active 805-char remark
-
2025-05-28price $54,900
-
2025-04-30$75,000 Active
-
2024-11-22soldstatus $35,750
ⓘ Source: listings_history table (triggers on properties + properties_extension) + one-shot
backfill from property_details.listing_events for pre-trigger history.
Tax reassessment forecast IN · Partial reset (capped growth)
- Current annual tax
- $1,168 · $97/mo
- Projected year-2 tax
- $1,168 · $97/mo
- Expected delta
- $0/yr ($0/mo · 0.0%)
ⓘ Screening estimate from a state-policy table — verify with the county assessor before closing.
Climate risk First Street
- Flood 1/10 Low FEMA zone X (unshaded) · 0% chance over 30 yrs
- Wildfire 1/10 Low
- Heat 5/10 Major 7 d/yr ≥107°F today · 19 d/yr by 30 yrs out
- Wind 2/10 Low 3% chance of damaging wind over 30 yrs
- Air quality 2/10 Low 1 unhealthy d/yr today · 2 by 30 yrs out
Nearby sold comps map
Loading sold comps map…
Walkable amenities ~0.75 mi
Loading nearby amenities…
Taxation est. · year 1
- Rental income
- $14,543
- − Mortgage interest
- −$3,075
- − Property taxes
- −$1,168
- − Insurance
- −$274
- − Repairs & maintenance
- −$1,163
- − Management
- −$1,163
- − Depreciation
- −$1,597
- Taxable income
- $6,102
- Est. tax owed @ 24.0%
- −$1,464
- After-tax cash flow
- $5,128/yr
For passive investors: Depreciation is non-cash, so a rental often shows a tax loss while cash-flowing — sheltering income. Rental losses are passive: they offset passive income freely, and up to $25,000/yr can offset ordinary (W-2) income if you actively participate and your MAGI is under $100k (phasing out to $0 by $150k); unused losses carry forward. On sale, claimed depreciation is recaptured at up to 25%, and gains may owe capital-gains tax (a 1031 exchange can defer both). Figures are a year-1 estimate at your 24.0% rate — not tax advice; consult a CPA.
Schools (NCES district)
- District
- South Gibson School Corporation
- NCES district ID
- 1810350
- Math proficiency
- 50% ▼ -7.00%
- Reading proficiency
- 58% ▼ -2.00%
- Median HH income
- $60,560
- Composite
- 47.09/100
- National rank
- #2334
- State rank
- #31 of 301 in IN
Livability — Owensville
- Score
- 63/100
- State rank
- #440
- US rank
- #15744
Category grades
Schools grade is shown separately in the Schools card above.
Census & demographics
- Census place
- Owensville, IN
- Population (ZIP)
- 4,053
Population outlook (Gibson County) Hauer SSP2
- Today (2025)
- 33,671 people
- By 2030
- 33,409 · -0.8%
- By 2040
- 32,364 · -3.9%
- By 2050
- 30,453 · -9.6%
- By 2075
- 24,610 · -26.9%
- By 2100
- 16,217 · -51.8%
Race, ethnicity, and origin ACS 2023
- Neighborhood character
- Predominantly White (94%)
- Race & ethnicity
- White 94% Two or more races 5%
- Common ancestry
- Slovak 2% Romanian 2% Portuguese 1%
- Foreign-born
- 1% · Canada
- Languages at home
- 99% English-only · Spanish 1%
Political lean MEDSL · Gibson
- 2024 margin
- Solid R (+51.4) · D 23.4% · R 74.8% · Other 1.8%
- 2008→2024 swing
- -38.2pp toward R · 2008: -13.2pp · 2024: -51.4pp
- All cycles
- 2024: R+51.4 2020: R+48.2 2016: R+47.6 2012: R+31.0 2008: R+13.2
Not yet ingested
- Civics
- —
Market trends
- HPI YoY
- ▼ -10.27%
- Current HPI
- 212.1149
- Rent YoY
- —
- Metro
- —
- State GDP YoY
- ▲ 2.90%
- F500 in state
- 18
Industry mix (Fortune 500 HQ in IN)
| Industry | F500 HQs | Revenue |
|---|---|---|
| Industrial Machinery | 2 | $37B |
|
||
| Healthcare | 1 | $177B |
|
||
| Pharmaceuticals | 1 | $45B |
|
||
| Metals / Steel | 1 | $18B |
|
||
| Agriculture | 1 | $17B |
|
||
| Packaging | 1 | $12B |
|
||
Price history
+53.6% since first listed4 events — show timeline
- 2026-05-11 Listed $54,900 IRMLS
- 2025-05-28 Price Changed $54,900 IRMLS
- 2025-04-30 Listed $75,000 IRMLS
- 2024-11-22 Sold (Public Records) $35,750 Public Records
Property tax history
+11.0%/yrLatest (2024): $1,168 · +2.0% YoY. Source: county tax records.
Cash-flow waterfall
monthlySold comps — $/sqft
last 12 mo · ≤1 miLoading sold comps…