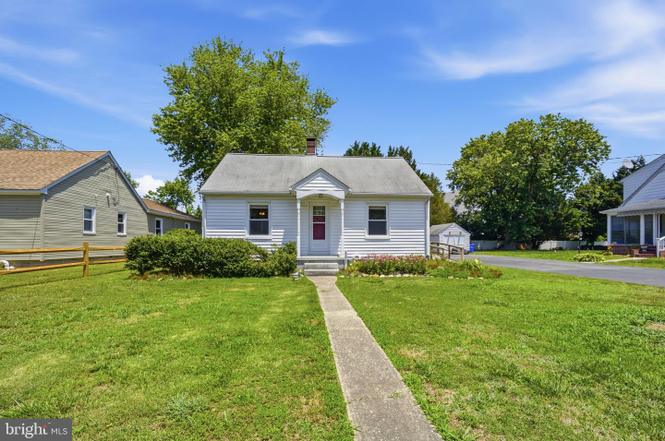
4003 Main St · Grasonville, MD
Flood risk No data
- FEMA flood zone
- —
- Chance of flooding over 30 yrs
- —
- Est. flood insurance / yr
- —
Fire risk No data
- Est. fire insurance / yr
- —
Heat risk No data
- Hot days now (above threshold)
- —
- Hot days in 30 yrs
- —
Wind risk No data
- Chance of severe wind over 30 yrs
- —
Air-quality risk No data
- Unhealthy air days now
- —
- Unhealthy air days in 30 yrs
- —
Risk factors via First Street. Map © Google.
Why this score? — see what drove the F grade
The composite is a weighted blend of 9 inputs, each scored 0–100. Each bar is that input's sub-score; the figure is the points it added to the 100-point composite (weight × sub-score).
- ARV discount +7.5/15.0
- Cash flow +7.1/30.0
- Livability +3.7/5.0
- Schools +3.0/10.0
- Rent growth +2.5/5.0
- Condition / age +2.5/5.0
- DSCR +1.3/10.0
- 1% rule +1.0/10.0
- Appreciation +0.0/10.0
$299,900
🖨 Deal sheet (PDF) 📄 Offer letter ✓ Due diligence
Listing remarks
Eastern Shore charm in the heart of Grasonville! This adorable cottage offers easy one-level living and features a thoughtfully designed addition that creates an expansive gathering space perfect for entertaining family and friends. Accessibility is enhanced with a convenient ramp, making everyday living comfortable and practical. Numerous improvements have been completed over the years, including an energy-efficient mini-split heating and cooling system. Move-in ready and full of character, this home presents an excellent opportunity for buyers seeking affordability, convenience, and Eastern Shore living. Being sold as-is, with plenty of potential for a handy homeowner to add their own fin
Key facts
- 9,900 sq ft lot
- Garage
- Built 1952
Property features AI
Exterior
- Parking: Detached front-entry garage (1 space); Shared driveway
- Utilities: Public sewer; Shared well; Electric hot water
- Home design: Detached structure
- Construction: Block construction; Crawl space foundation; Above-grade and below-grade structures noted; Year built (source: assessor)
- Exterior features: Not in federal flood zone; Tidal water: No
Interior
- Kitchen: Refrigerator; Electric oven/range
- Bedrooms: 2 bedrooms on the main level
- Bathrooms: 1 full bathroom on the main level
- Heating & cooling: Forced air heating; Wall unit heating; Electric and oil heating fuel; Cooling: other (electric fuel)
- Interior features: Ramp to main level (accessibility feature); No basement; Estimated living area
- Laundry & utility: Washer/dryer hookup
Neighborhood map
What this means for you Summary
Snapshot
- This is a 2-bed/1.0-bath single-family listed at $300k.
Deal economics
- At list price, monthly cash flow is $-424 ($-5k/yr) — negative.
- To cash-flow at today's rent, offer at most $225k (25.0% below list).
- To meet the 1% rule (rent ≥ 1% of price), the offer needs to be $180k (40.0% below list).
- Recommended offer: $180k (40.0% below list) — sets the bar for 1% rule.
- Cap rate 4.6% vs local median 1.6% in Grasonville — top-decile yield for the area; either an underpriced asset or a hidden risk that comps aren't pricing in. Stress-test before assuming the spread holds.
Location & tenants
- Location reads 74/100 on livability (#116 in MD, #4,789 nationally) — a middle-class / working-renter tenant base. Strengths: employment A+, housing A+, crime A; Watch: amenities F, commute F, cost of living F.
- Queen Anne'S County Public Schools (rural): math 22% / reading 39% proficiency, ranked #7 of 24 in MD (top 29%) — families likely to look elsewhere, expect single-tenant / working-renter base with shorter leases.
- Zoned schools: Grasonville Elementary School (math 28% / reading 25%, grade F, #238 of 860 statewide, top 29%, 454 students, 45% FRL); Stevensville Middle School (math 12% / reading 40%, grade F, #91 of 225 statewide, top 42%, 496 students, 35% FRL); Kent Island High School (math 63% / reading 68%, grade B, #54 of 222 statewide, top 24%, 1,164 students, 29% FRL).
- Market conditions: 50 active listings in the ZIP; 1 comparable units currently listed for rent nearby; 320 units permitted in Queen Anne's County in 2024 (56 in 5+ unit buildings).
Forward outlook
- Local home prices are declining (-3.0%/yr); year-one equity from $2k of loan paydown is wiped out by about $9k of value loss. Plan a longer hold.
Negotiation context
- Only 5 days on market — expect competitive offers; lowballing is unlikely to land.
- Current owner paid $74k; list at $300k implies a 308% gain — meaningful room to come down on a strong offer.
Risks & watch-outs
- Watch-outs: built in 1952 — expect roof / HVAC / electrical / plumbing capex.
Questions for the listing agent
- What do current leases actually rent for vs. the listed asking? Can we see a recent rent roll and the last 12 months of T-12 income?
- Built in 1952 — when were the roof, HVAC, electrical panel, plumbing, and water heater last replaced?
- Is there a deadline driving the sale (1031 exchange, divorce, estate, relocation)? That informs how much negotiation room exists.
- The area grade is low — what's the realistic commute time and amenity access for the typical tenant pool here? Any planned neighborhood developments (good or bad) we should know about?
- What's the average days-on-market for RENTAL listings here right now (not sales)? A rising rental-DOM trend means longer vacancies and softer asking-rent achievability than the comps imply.
- What's the recent tenant-quality profile in this submarket — average credit score on applications, eviction rate, late-payment / NSF rate, and stable-employment percentage? A property-management company in the area should have these aggregated.
- How much new for-sale + rental construction is in the pipeline within 1–3 miles? Heavy new supply typically softens prices + rents 12–24 months out; constrained supply supports both.
Investment metrics
- 1% rule
- 0.60% ✗
- Cap rate
- 4.60%
- Cash-on-cash
- -6.06%
- DSCR
- 0.73
- GRM
- 13.9
CMA / ARV
No comps found within radius.
Projected returns pro-forma
-3.0% appreciation · 3.0% rent growth · sell at horizon
- IRR
- -26.8%
- Equity multiple
- 0.10×
- Total profit
- $-75,707
- Equity at exit
- $44,716
- IRR
- -24.4%
- Equity multiple
- -0.20×
- Total profit
- $-101,145
- Equity at exit
- $25,930
Cash invested: $83,972 (down + closing). Projections, not guarantees.
Landlord ↔ Tenant lean methodology
- Overall (STATE)
- 27 Tenant-Leaning
- State Maryland
- 27 Tenant-Leaning · D+14
- County
- — inherits STATE
- City
- — inherits STATE
ZIP-level market 21638
- Home prices YoY
- -4.7%
- Active inventory
- 50
- Price-to-rent
- 13.9×
Monthly cashflow live
- Estimated rent
- $1,800 medium interval (Pro) →
- Mortgage (P&I)
- −$1,573
- Tax from tax record
- −$148 /mo · $1,779/yr
- Insurance
- −$125
- HOA
- −$0
- Vacancy / Maint / Mgmt
- −$378
- Net cashflow
- $-424
Break-even live
Sensitivity live
| Price | -10% $-254 | -5% $-339 | +0% $-424 | +5% $-509 | +10% $-594 |
|---|---|---|---|---|---|
| Rent | -10% $-566 | -5% $-495 | +0% $-424 | +5% $-353 | +10% $-282 |
| Rate | -1.0pp $-273 | -0.5pp $-348 | base $-424 | +0.5pp $-502 | +1.0pp $-581 |
UW: 25.0% down · 7.5% · 30yr · 1.5% tax · 5.0% vac · 8.0% maint · 8.0% mgmt
Financing live
Cash to close
- Down payment
- $74,975
- Closing costs
- $8,997
- Reserves months
- —
- Total cash needed
- —
Loan-product check · same deal, 3 products live
Conventional
25% down · 7.5% · 30yr
- Down + closing
- —
- Monthly P&I
- —
- Monthly cashflow
- —
- DSCR
- —
- Eligible?
- —
Personal DTI + credit; lowest rate.
DSCR
20% down · 8.5% · 30yr
- Down + closing
- —
- Monthly P&I
- —
- Monthly cashflow
- —
- DSCR
- —
- Eligible?
- —
No personal income docs; deal must DSCR.
Hard money
10% down · 12.0% · 12mo
- Down + closing
- —
- Monthly P&I
- —
- Monthly cashflow
- —
- DSCR
- —
- Eligible?
- —
Short-term bridge; refi at stabilization.
Rent comps 1 comps
| Address | Beds | Baths | Sqft | Rent | $/sqft | DOM | Units | Dist |
|---|---|---|---|---|---|---|---|---|
| 107 Winchester Ave Unit 107 Grasonville, MD | 1.0 | 1.0 | 560 | $1,800 | $3.21 | 12d | 1 | 0.88mi |
Listing history 5 events
-
2026-06-18days on market $299,900 Active 5 DOM
-
2026-06-17days on market $299,900 Active 4 DOM
-
2026-06-16days on market $299,900 Active 3 DOM
-
2026-06-15remarks 699-char remark
-
2026-06-15$299,900 Active 2 DOM
ⓘ Source: listings_history table (triggers on properties + properties_extension) + one-shot
backfill from property_details.listing_events for pre-trigger history.
Tax reassessment forecast MD · Partial reset (capped growth)
- Current annual tax
- $1,779 · $148/mo
- Projected year-2 tax
- $2,524 · $210/mo
- Expected delta
- +$745/yr (+$62/mo · 41.9%)
ⓘ Screening estimate from a state-policy table — verify with the county assessor before closing.
Nearby sold comps map
Loading sold comps map…
Walkable amenities ~0.75 mi
Loading nearby amenities…
Taxation est. · year 1
- Rental income
- $21,600
- − Mortgage interest
- −$16,799
- − Property taxes
- −$1,779
- − Insurance
- −$1,500
- − Repairs & maintenance
- −$1,728
- − Management
- −$1,728
- − Depreciation
- −$8,724
- Taxable loss
- −$10,658
- Est. tax savings @ 24.0%
- +$2,558
- After-tax cash flow
- $-2,529/yr
For passive investors: Depreciation is non-cash, so a rental often shows a tax loss while cash-flowing — sheltering income. Rental losses are passive: they offset passive income freely, and up to $25,000/yr can offset ordinary (W-2) income if you actively participate and your MAGI is under $100k (phasing out to $0 by $150k); unused losses carry forward. On sale, claimed depreciation is recaptured at up to 25%, and gains may owe capital-gains tax (a 1031 exchange can defer both). Figures are a year-1 estimate at your 24.0% rate — not tax advice; consult a CPA.
Schools (NCES district)
- District
- Queen Anne'S County Public Schools
- NCES district ID
- 2400540
- Math proficiency
- 22% ▼ -30.00%
- Reading proficiency
- 39% ▼ -22.00%
- Median HH income
- $84,577
- Composite
- 29.86/100
- National rank
- #6406
- State rank
- #7 of 24 in MD
Livability — Grasonville
- Score
- 74/100
- State rank
- #116
- US rank
- #4789
Category grades
Schools grade is shown separately in the Schools card above.
Census & demographics
- Census place
- Grasonville, MD
- Population (ZIP)
- 5,068
Population outlook (Queen Anne's County) Hauer SSP2
- Today (2025)
- 51,149 people
- By 2030
- 51,979 · +1.6%
- By 2040
- 52,728 · +3.1%
- By 2050
- 51,828 · +1.3%
- By 2075
- 50,169 · -1.9%
- By 2100
- 44,442 · -13.1%
Race, ethnicity, and origin ACS 2023
- Neighborhood character
- Predominantly White (80%)
- Race & ethnicity
- White 80% Two or more races 10% Hispanic / Latino 5% Black 5%
- Hispanic origin (detail)
- Common ancestry
- Slovak 4% Italian 3% Romanian 3%
- Foreign-born
- 4% · Canada, South Korea, Dominican Republic
- Languages at home
- 95% English-only · Spanish 3% Other Indo-European 1%
Political lean MEDSL · Queen Anne's
- 2024 margin
- Strong R (+27.8) · D 35.1% · R 62.9% · Other 2.1%
- 2008→2024 swing
- -0.7pp no change · 2008: -27.1pp · 2024: -27.8pp
- All cycles
- 2024: R+27.8 2020: R+26.5 2016: R+36.1 2012: R+30.1 2008: R+27.1
Not yet ingested
- Civics
- —
Market trends
- HPI YoY
- ▼ -12.55%
- Current HPI
- 256.8252
- Rent YoY
- —
- Metro
- —
- State GDP YoY
- ▲ 2.97%
- F500 in state
- 12
Industry mix (Fortune 500 HQ in MD)
| Industry | F500 HQs | Revenue |
|---|---|---|
| Aerospace / Defense | 1 | $71B |
|
||
| Utilities | 1 | $25B |
|
||
| Hotels | 1 | $24B |
|
||
| Consumer Goods | 1 | $7B |
|
||
| Real Estate | 1 | $6B |
|
||
| Chemicals | 1 | $2B |
|
||
Price history
+308.0% since first listed3 events — show timeline
- 2026-06-14 Listed $299,900 BRIGHT MLS
- 2026-06-13 Coming Soon $299,900 BRIGHT MLS
- 1993-07-14 Sold (Public Records) $73,500 Public Records
Property tax history
+4.1%/yrLatest (2025): $1,779 · +5.4% YoY. Source: county tax records.
Cash-flow waterfall
monthlySold comps — $/sqft
last 12 mo · ≤1 miLoading sold comps…