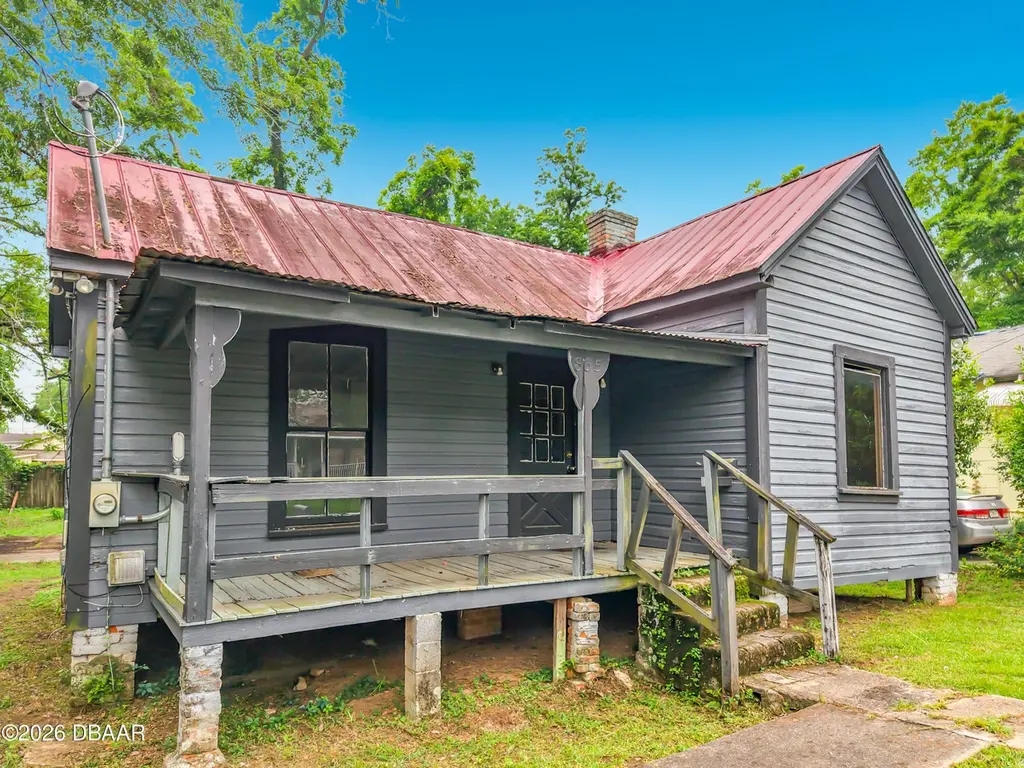
835 W Brevard St · Tallahassee, FL
Flood risk 1/10 · Minimal
- FEMA flood zone
- X (unshaded)
- Chance of flooding over 30 yrs
- 0.0%
- Est. flood insurance / yr
- $507 – $1,088
Fire risk 1/10 · Minimal
- Est. fire insurance / yr
- $947 – $1,759
Heat risk 9/10 · Severe
- Hot days now (above 108°F)
- 7 days/yr
- Hot days in 30 yrs
- 21 days/yr
Wind risk 9/10 · Severe
- Chance of severe wind over 30 yrs
- 99.0%
Air-quality risk 4/10 · Minor
- Unhealthy air days now
- 5 days/yr
- Unhealthy air days in 30 yrs
- 6 days/yr
Risk factors via First Street. Map © Google.
Why this score? — see what drove the B+ grade
The composite is a weighted blend of 9 inputs, each scored 0–100. Each bar is that input's sub-score; the figure is the points it added to the 100-point composite (weight × sub-score).
- Cash flow +30.0/30.0
- ARV discount +15.0/15.0
- 1% rule +10.0/10.0
- DSCR +10.0/10.0
- Schools +4.3/10.0
- Livability +4.3/5.0
- Rent growth +3.7/5.0
- Condition / age +2.5/5.0
- Appreciation +0.0/10.0
$75,000
🖨 Deal sheet 📄 Offer letter ✓ Due diligence
Listing remarks
Great investment property. Walking distance to FSU. CASH Buyer only. This property is very close to restaurants, shops, churches and many other facilities. Prime location to Florida State University.
Key facts
- Close to restaurants
- Investment property
- Close to shops
Tags
Property features AI
Exterior
- Parking: Other parking (specific type not specified)
- Utilities: Other water source; Other utilities
- Home design: Single-family residential property
- Exterior features: Not in a subdivision; Directions: North on Woodward Ave then right on W Brevard St
Interior
- Kitchen: Appliances present (details not specified)
- Bedrooms: 2 rooms total (bedroom configuration not specified)
- Bathrooms: 1 full bathroom
- Heating & cooling: Has heating (type not specified); Has cooling (type not specified)
- Interior features: Includes unspecified built-in appliances
Neighborhood map
What this means for you Summary
Snapshot
- This is a 3-bed/2.0-bath single-family listed at $75k.
Deal economics
- At list price, monthly cash flow is $565 ($7k/yr) — positive.
- The deal already cash-flows at list — no discount required.
- Meets the 1% rule at list price ($1k rent vs $75k).
- Recommended offer: $74k (1.5% below list) — sets the bar for market timing.
- Cap rate 15.3% vs local median 4.2% in Tallahassee — top-decile yield for the area; either an underpriced asset or a hidden risk that comps aren't pricing in. Stress-test before assuming the spread holds.
Location & tenants
- Location reads 86/100 on livability (#19 in FL, #429 nationally) — a professional / high-income tenant draw. Strengths: amenities A+, commute A+, health & safety A+; Watch: employment D.
- Leon (urban): math 48% / reading 53% proficiency, ranked #33 of 73 in FL (top 45%) — acceptable for families but not a draw, mixed tenant base, ~2y average lease.
- Market conditions: Rents rising fast (+4.7%/yr); 142 active listings in the ZIP; 35 comparable units currently listed for rent nearby; rentals at typical pace (median 21d on market — plan ~3-4 weeks tenant-placement turnaround); lower-income renter base — watch delinquency; 1,765 units permitted in Leon County in 2024 (975 in 5+ unit buildings).
- At $1,443/mo this rent would consume 54% of the median local household income ($32k/yr) (locally 6995% of renters already pay >50% of income on rent) — very limited rent-growth headroom before tenants either downsize or default.
Forward outlook
- Local home prices are declining (-3.0%/yr); year-one equity from $519 of loan paydown is wiped out by about $2k of value loss. Plan a longer hold.
- Leon County population projected at +23% by 2050 — long-run rental-demand tailwind backs the buy-and-hold thesis.
- At projected returns (-3.0% appreciation + 4.7% rent growth), your $21k cash investment doubles in ~4 years — after that, you're playing with house money.
Negotiation context
- It's been on market 15 days — a 2% lower offer ($74k) is reasonable based on typical stale-listing flexibility.
Risks & watch-outs
- Watch-outs: built in 1940 — expect roof / HVAC / electrical / plumbing capex.
- Climate carrying-cost: severe wind risk, 99% chance of damaging wind over 30y; extreme-heat days projected 7→21/yr by 2055 (HVAC capex compounding) — expect insurance premiums to compound above CPI over the hold.
Questions for the listing agent
- Built in 1940 — when were the roof, HVAC, electrical panel, plumbing, and water heater last replaced?
- Is there a deadline driving the sale (1031 exchange, divorce, estate, relocation)? That informs how much negotiation room exists.
- Schools are B-rated — typically a magnet for longer-tenancy family renters. What's the average tenant stay here, and is there a school-zone premium baked into asking?
- What's the average days-on-market for RENTAL listings here right now (not sales)? A rising rental-DOM trend means longer vacancies and softer asking-rent achievability than the comps imply.
- What's the recent tenant-quality profile in this submarket — average credit score on applications, eviction rate, late-payment / NSF rate, and stable-employment percentage? A property-management company in the area should have these aggregated.
- How much new for-sale + rental construction is in the pipeline within 1–3 miles? Heavy new supply typically softens prices + rents 12–24 months out; constrained supply supports both.
Investment metrics
- 1% rule
- 1.92% ✓
- Cap rate
- 15.33%
- Cash-on-cash
- 32.29%
- DSCR
- 2.44
- GRM
- 4.3
CMA / ARV
- ARV (on-the-fly)
- $142,128
- Comps found
- 4
Show comp detail 4 sales within ~0.75 mi
| Address | Dist | Beds/Ba | Sqft | Sold | Price | $/sf | Match |
|---|---|---|---|---|---|---|---|
| 812 W Georgia St | 0.05mi | 3/3.0 | 788 (+5%) | 18mo | $150,000 | $190 | 71 |
| 1124 Abraham St | 0.47mi | 2/1.0 (-1) | 758 (+1%) | 23mo | $141,000 | $186 | 49 |
| 618 Dover St | 0.37mi | 2/1.0 (-1) | 660 (-12%) | 8mo | $125,000 | $189 | 47 |
| 658 W 5th Ave | 0.50mi | 2/1.0 (-1) | 825 (+10%) | 21mo | $90,000 | $109 | 34 |
Match score weights: distance 35% · size 25% · config 20% · recency 20%. Top-matched comps best support the ARV.
Projected returns pro-forma
-3.0% appreciation · 4.69% rent growth · sell at horizon
- IRR
- 29.4%
- Equity multiple
- 2.26×
- Total profit
- $26,389
- Equity at exit
- $11,183
- IRR
- 37.7%
- Equity multiple
- 4.82×
- Total profit
- $80,148
- Equity at exit
- $6,485
Cash invested: $21,000 (down + closing). Projections, not guarantees.
Landlord ↔ Tenant lean methodology
- Overall (STATE)
- 87 Strongly Landlord-Friendly
- State Florida
- 87 Strongly Landlord-Friendly · R+3
- County
- — inherits STATE
- City
- — inherits STATE
ZIP-level market 32304
- Home prices YoY
- -21.2%
- Rents YoY
- 4.7%
- Active inventory
- 142
- Price-to-rent
- 4.3×
Monthly cashflow live
- Estimated rent
- $1,443 high interval (Pro) →
- Mortgage (P&I)
- −$393
- Tax from tax record
- −$150 /mo · $1,802/yr
- Insurance
- −$31
- HOA
- −$0
- Vacancy / Maint / Mgmt
- −$303
- Net cashflow
- $565
Break-even live
UW: 25.0% down · 7.5% · 30yr · 1.5% tax · 5.0% vac · 8.0% maint · 8.0% mgmt
Financing live
Cash to close
- Down payment
- $18,750
- Closing costs
- $2,250
- Reserves months
- —
- Total cash needed
- —
Loan-product check · same deal, 3 products live
Conventional
25% down · 7.5% · 30yr
- Down + closing
- —
- Monthly P&I
- —
- Monthly cashflow
- —
- DSCR
- —
- Eligible?
- —
Personal DTI + credit; lowest rate.
DSCR
20% down · 8.5% · 30yr
- Down + closing
- —
- Monthly P&I
- —
- Monthly cashflow
- —
- DSCR
- —
- Eligible?
- —
No personal income docs; deal must DSCR.
Hard money
10% down · 12.0% · 12mo
- Down + closing
- —
- Monthly P&I
- —
- Monthly cashflow
- —
- DSCR
- —
- Eligible?
- —
Short-term bridge; refi at stabilization.
Rent comps 35 comps
| Address | Beds | Baths | Sqft | Rent | $/sqft | DOM | Units | Dist |
|---|---|---|---|---|---|---|---|---|
| 916 N Woodward Ave #1 Tallahassee, FL | 2.0 | 1.0 | 794 | $1,000 | $1.26 | 13d | 1 | 0.26mi |
| 1410 Nylic St Unit B Tallahassee, FL | 2.0 | 1.0 | 550 | $900 | $1.64 | 13d | 1 | 0.56mi |
| 412 W Brevard St Unit 412 Tallahassee, FL | 3.0 | 2.0 | 900 | $800 | $0.89 | 21d | 1 | 0.66mi |
| 322 Conradi St Tallahassee, FL | 3.0 | 2.0 | 1100 | $1,950 | $1.77 | 21d | 4 | 0.70mi |
| 718 N Bronough St Tallahassee, FL | 2.0 | 1.0 | 798 | $1,100 | $1.38 | 21d | 1 | 0.74mi |
| 833 W Gaines St Tallahassee, FL | 2.0 | 2.0 | 1080 | $2,350 | $2.18 | 13d | 2 | 0.94mi |
| 440 N Monroe St Tallahassee, FL | 3.0 | 1.0–3.0 | 1311 | $3,850 | $2.94 | 13d | 15 | 0.96mi |
| 215 W College Ave Unit 706B Tallahassee, FL | 2.0 | 1.0 | 823 | $2,600 | $3.16 | 21d | 1 | 0.97mi |
| 1108 Greentree Ct Tallahassee, FL | 2.0 | 2.0 | 888 | $1,275 | $1.44 | 21d | 1 | 1.03mi |
| 1325 W Tharpe St Tallahassee, FL | 1.0–3.0 | 1.0–4.0 | 937 | $1,676 | $1.79 | 13d | 21 | 1.07mi |
| 1111 High Rd Tallahassee, FL | 2.0–3.0 | 2.0 | 1000 | $1,594 | $1.59 | 13d | 11 | 1.08mi |
| 220 Atkinson Dr Unit D Tallahassee, FL | 2.0 | 1.0 | 928 | $1,100 | $1.19 | 21d | 1 | 1.09mi |
| 1001 Ocala Rd Tallahassee, FL | 4.0 | 1.0–2.0 | 899 | $642 | $0.71 | 21d | 6 | 1.10mi |
| 2020 Continental Ave Tallahassee, FL | 1.0–2.0 | 1.0–1.5 | 850 | $1,300 | $1.53 | 21d | 3 | 1.14mi |
| 415 N Gadsden St Tallahassee, FL | 1.0–2.0 | 1.0–1.5 | 990 | $1,575 | $1.59 | 21d | 6 | 1.15mi |
| 1303 Airport Dr Unit A08 Tallahassee, FL | 2.0 | 2.5 | 1083 | $1,475 | $1.36 | 21d | 1 | 1.20mi |
| 1916 Nannette Dr Unit 1916 Tallahassee, FL | 2.0 | 1.0 | 1000 | $1,100 | $1.10 | 13d | 1 | 1.22mi |
| 1854 Belle Vue Way Tallahassee, FL | 2.0–4.0 | 1.0–2.0 | 1100 | $1,768 | $1.61 | 21d | 1 | 1.22mi |
| 420 E Park Ave Unit 50 Tallahassee, FL | 2.0 | 1.0 | 770 | $1,050 | $1.36 | 13d | 1 | 1.24mi |
| 1935 Dawsey St Unit 1935-2 Tallahassee, FL | 2.0 | 1.0 | 875 | $975 | $1.11 | 13d | 1 | 1.25mi |
| 1606 Airport Dr Tallahassee, FL | 3.0 | 2.0 | 1008 | $1,395 | $1.38 | 21d | 1 | 1.27mi |
| 2060 Continental Ave Tallahassee, FL | 1.0–3.0 | 1.0–2.5 | 1121 | $1,185 | $1.06 | 13d | 26 | 1.29mi |
| 301 S Lipona Rd #24 Tallahassee, FL | 2.0 | 1.5 | 896 | $1,350 | $1.51 | 21d | 1 | 1.29mi |
| 1303 Ocala Rd Tallahassee, FL | 1.0–4.0 | 1.0–2.0 | 1121 | $1,445 | $1.29 | 13d | 48 | 1.36mi |
| 717 Edgewood St Tallahassee, FL | 2.0 | 1.0 | 717 | $1,325 | $1.85 | 21d | 1 | 1.37mi |
| 1643 Sharkey St Tallahassee, FL | 3.0 | 1.0 | 912 | $1,350 | $1.48 | 21d | 1 | 1.40mi |
| 424 E 7th Ave Unit 15 Tallahassee, FL | 2.0 | 1.0 | 859 | $1,550 | $1.80 | 13d | 1 | 1.41mi |
| 1332 Cherry St Tallahassee, FL | 2.0 | 1.0 | 859 | $1,550 | $1.80 | 21d | 1 | 1.43mi |
| 1330 Cherry St Tallahassee, FL | 2.0 | 1.0 | 859 | $1,600 | $1.86 | 13d | 5 | 1.43mi |
| 1338 Cherry St Unit 5 Tallahassee, FL | 2.0 | 1.0 | 859 | $1,550 | $1.80 | 13d | 1 | 1.44mi |
| 850 S Gadsden St Tallahassee, FL | 2.0 | 1.0–2.0 | 828 | $3,549 | $4.29 | 13d | 34 | 1.44mi |
| 1340 Cherry St Unit 6 Tallahassee, FL | 2.0 | 1.0 | 859 | $1,649 | $1.92 | 21d | 1 | 1.44mi |
| 1426 Pepper Dr Tallahassee, FL | 2.0 | 1.0 | 858 | $1,250 | $1.46 | 21d | 1 | 1.44mi |
| 1360 Ocala Rd Tallahassee, FL | 2.0 | 1.0 | 800 | $1,000 | $1.25 | 21d | 1 | 1.46mi |
| 318 W Harrison St Unit 324 Tallahassee, FL | 2.0 | 1.0 | 525 | $1,000 | $1.90 | 21d | 1 | 1.46mi |
Listing history 13 events
-
2026-06-18price $75,000 Active 15 DOM
-
2026-06-18days on market $79,900 Active 15 DOM
-
2026-06-17price $79,900 Active 14 DOM
-
2026-06-17days on market $85,000 Active 14 DOM
-
2026-06-16days on market $85,000 Active 13 DOM
-
2026-06-15days on market $85,000 Active 12 DOM
-
2026-06-14pricedays on market $85,000 Active 10 DOM
-
2026-06-10days on market $89,900 Active 7 DOM
-
2026-06-09pricedays on market $89,900 Active 6 DOM
-
2026-06-08days on market $95,000 Active 5 DOM
-
2026-06-07days on market $95,000 Active 4 DOM
-
2026-06-03remarks 199-char remark
-
2026-06-03$95,000 Active 1 DOM
ⓘ Source: listings_history table (triggers on properties + properties_extension) + one-shot
backfill from property_details.listing_events for pre-trigger history.
Tax reassessment forecast FL · Resets to sale price
- Current annual tax
- $1,802 · $150/mo
- Projected year-2 tax
- $1,802 · $150/mo
- Expected delta
- $0/yr ($0/mo · 0.0%)
ⓘ Screening estimate from a state-policy table — verify with the county assessor before closing.
Climate risk First Street
- Flood 1/10 Low FEMA zone X (unshaded) · 0% chance over 30 yrs
- Wildfire 1/10 Low
- Heat 9/10 Extreme 7 d/yr ≥108°F today · 21 d/yr by 30 yrs out
- Wind 9/10 Extreme 99% chance of damaging wind over 30 yrs
- Air quality 4/10 Moderate 5 unhealthy d/yr today · 6 by 30 yrs out
Nearby sold comps map
Loading sold comps map…
Walkable amenities ~0.75 mi
Loading nearby amenities…
Taxation est. · year 1
- Rental income
- $17,314
- − Mortgage interest
- −$4,201
- − Property taxes
- −$1,802
- − Insurance
- −$375
- − Repairs & maintenance
- −$1,385
- − Management
- −$1,385
- − Depreciation
- −$2,182
- Taxable income
- $5,983
- Est. tax owed @ 24.0%
- −$1,436
- After-tax cash flow
- $5,345/yr
For passive investors: Depreciation is non-cash, so a rental often shows a tax loss while cash-flowing — sheltering income. Rental losses are passive: they offset passive income freely, and up to $25,000/yr can offset ordinary (W-2) income if you actively participate and your MAGI is under $100k (phasing out to $0 by $150k); unused losses carry forward. On sale, claimed depreciation is recaptured at up to 25%, and gains may owe capital-gains tax (a 1031 exchange can defer both). Figures are a year-1 estimate at your 24.0% rate — not tax advice; consult a CPA.
Schools (NCES district)
- District
- Leon
- NCES district ID
- 1201110
- Math proficiency
- 48% ▼ -13.00%
- Reading proficiency
- 53% ▼ -5.00%
- Median HH income
- $46,339
- Composite
- 42.84/100
- National rank
- #3131
- State rank
- #33 of 73 in FL
Livability — Tallahassee
- Score
- 86/100
- State rank
- #19
- US rank
- #429
Category grades
Schools grade is shown separately in the Schools card above.
Census & demographics
- Census place
- Tallahassee, FL
- County
- Leon County · 294,472 people
- City population
- 294,472
- Metro
- Tallahassee, FL
- Population (ZIP)
- 51,673
- Household income
- $32,348
- Rent vs Own
- Severe rent burden
- 6995.0
Population outlook (Leon County) Hauer SSP2
- Today (2025)
- 315,507 people
- By 2030
- 330,677 · +4.8%
- By 2040
- 358,465 · +13.6%
- By 2050
- 386,804 · +22.6%
- By 2075
- 465,480 · +47.5%
- By 2100
- 519,959 · +64.8%
Race, ethnicity, and origin ACS 2023
- Neighborhood character
- Diverse neighborhood (Simpson 0.65)
- Race & ethnicity
- White 45% Black 36% Hispanic / Latino 10% Two or more races 7% Asian 4%
- Hispanic origin (detail)
- Mexican 2% Puerto Rican 2% Cuban 2%
- Common ancestry
- Romanian 2% Lithuanian 1% Italian 1%
- Foreign-born
- 8% · Canada, China
- Languages at home
- 86% English-only · Spanish 7% Other Indo-European 2% French/Haitian/Cajun 1%
Political lean MEDSL · Leon
- 2024 margin
- Strong D (+21.8) · D 60.3% · R 38.5% · Other 1.2%
- 2008→2024 swing
- -2.5pp toward R · 2008: 24.3pp · 2024: 21.8pp
- All cycles
- 2024: D+21.8 2020: D+28.3 2016: D+25.1 2012: D+23.6 2008: D+24.3
Not yet ingested
- Civics
- —
Market trends
- HPI YoY
- ▼ -72.04%
- Current HPI
- 267.8426
- Rent YoY
- ▲ 4.69%
- Metro
- Tallahassee, FL
- State GDP YoY
- ▲ 3.28%
- F500 in state
- 36
Industry mix (Fortune 500 HQ in FL)
| Industry | F500 HQs | Revenue |
|---|---|---|
| Industrial Technology | 2 | $29B |
|
||
| Insurance | 2 | $17B |
|
||
| Retail | 1 | $60B |
|
||
| Technology Distribution | 1 | $58B |
|
||
| Homebuilding | 1 | $35B |
|
||
| Technology Manufacturing | 1 | $35B |
|
||
Price history
1 event — show timeline
- 2026-06-03 Listed $95,000 Daytona MLS
Property tax history
+4.1%/yrLatest (2025): $1,802 · +9.6% YoY. Source: county tax records.
Cash-flow waterfall
monthlySold comps — $/sqft
last 12 mo · ≤1 miLoading sold comps…