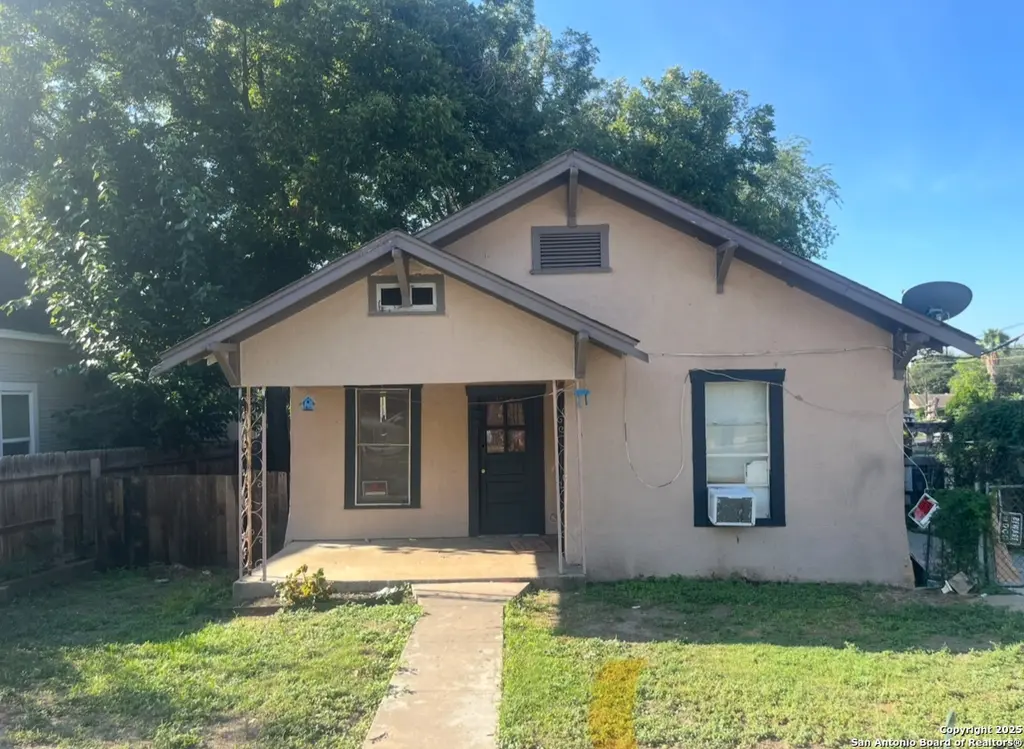
302 Regina · San Antonio, TX
Flood risk 1/10 · Minimal
- FEMA flood zone
- X (unshaded)
- Chance of flooding over 30 yrs
- 0.0%
- Est. flood insurance / yr
- $507 – $1,088
Fire risk 1/10 · Minimal
- Est. fire insurance / yr
- $1,222 – $2,270
Heat risk 8/10 · Major
- Hot days now (above 108°F)
- 7 days/yr
- Hot days in 30 yrs
- 20 days/yr
Wind risk 8/10 · Major
- Chance of severe wind over 30 yrs
- 80.0%
Air-quality risk 2/10 · Minimal
- Unhealthy air days now
- 1 days/yr
- Unhealthy air days in 30 yrs
- 2 days/yr
Risk factors via First Street. Map © Google.
Why this score? — see what drove the D grade
The composite is a weighted blend of 9 inputs, each scored 0–100. Each bar is that input's sub-score; the figure is the points it added to the 100-point composite (weight × sub-score).
- ARV discount +13.3/15.0
- Cash flow +12.9/30.0
- 1% rule +5.0/10.0
- Livability +4.0/5.0
- DSCR +3.9/10.0
- Condition / age +2.5/5.0
- Rent growth +1.7/5.0
- Schools +1.4/10.0
- Appreciation +0.0/10.0
$115,555
🖨 Deal sheet (PDF) 📄 Offer letter ✓ Due diligence
Listing remarks MLS
Multi Family Investment Opportunity in Southeast San Antonio! This property is the perfect opportunity for an investor or a first-time homebuyer. plenty of space to add a 3rd bedroom with a second full bath. The main home features 2 bedrooms and 1 bathroom - fully livable but ready for your personal touch and updates. In addition to the main house, there's a spacious garage with an apartment in the back, offering excellent rental or guest unit potential. Located in the growing Southeast San Antonio area, this property has tons of potential to become a beautiful and valuable home with the right improvements. Seller is open to all offers, so don't miss your chance to check it out!
Key facts
- Spacious garage
- 6,651 sq ft lot
- Garage
Tags
Neighborhood map
What this means for you Summary
Snapshot
- This is a 2-bed/1.0-bath single-family listed at $116k.
Deal economics
- At list price, monthly cash flow is $-9 ($-106/yr) — negative.
- To cash-flow at today's rent, offer at most $114k (1.3% below list).
- To meet the 1% rule (rent ≥ 1% of price), the offer needs to be $115k (0.1% below list).
- Recommended offer: $102k (12.0% below list) — sets the bar for market timing.
- Cap rate 6.2% vs local median 3.8% in San Antonio — top-decile yield for the area; either an underpriced asset or a hidden risk that comps aren't pricing in. Stress-test before assuming the spread holds.
Location & tenants
- Location reads 80/100 on livability (#31 in TX, #1,616 nationally) — a professional / high-income tenant draw. Strengths: amenities A+, commute A+, cost of living A+; Watch: crime F.
- San Antonio ISD (urban): math 12% / reading 22% proficiency, ranked #805 of 826 in TX (top 98%) — low school quality limits family demand, transient renter base, plan for 1-2y turnover; 80% free/reduced lunch — lower-income household profile, screen leases tightly.
- Zoned schools: Eloise Japhet Academy (math 9% / reading 18%, grade F, #4,138 of 4,322 statewide, top 96%, 770 students, 92% FRL); Highlands H S (math 18% / reading 27%, grade F, #1,354 of 1,632 statewide, top 83%, 1,651 students, 92% FRL).
- Market conditions: Rents falling (-3.4%/yr); 329 active listings in the ZIP; 40 comparable units currently listed for rent nearby; rentals at typical pace (median 24d on market — plan ~3-4 weeks tenant-placement turnaround); 8,308 units permitted in Bexar County in 2024 (2,506 in 5+ unit buildings).
Forward outlook
- Local home prices are declining (-3.0%/yr); year-one equity from $799 of loan paydown is wiped out by about $3k of value loss. Plan a longer hold.
- Bexar County population projected at +50% by 2050 — long-run rental-demand tailwind backs the buy-and-hold thesis.
Negotiation context
- It's been on market 252 days — a 12% lower offer ($102k) is reasonable based on typical stale-listing flexibility.
- 2 sale attempts with the ask held roughly flat each time — persistent listings suggest the price (not the market) is what's stuck; bring a comps-based counter.
Risks & watch-outs
- Watch-outs: property tax is 2.8% of price; built in 1928 — expect roof / HVAC / electrical / plumbing capex.
- Climate carrying-cost: severe wind risk, 80% chance of damaging wind over 30y; extreme-heat days projected 7→20/yr by 2055 (HVAC capex compounding) — expect insurance premiums to compound above CPI over the hold.
Questions for the listing agent
- What do current leases actually rent for vs. the listed asking? Can we see a recent rent roll and the last 12 months of T-12 income?
- It's been on market 252 days. Have you received any prior offers? Is the seller open to a 12% concession, seller financing, or rate buy-down credit?
- Built in 1928 — when were the roof, HVAC, electrical panel, plumbing, and water heater last replaced?
- Property tax is high relative to price — has the assessment been appealed recently, and will the sale trigger a re-assessment?
- Why hasn't it sold? Are there any deal-killer items the seller is aware of (foundation, flood, title, zoning, code violations)?
- Is there a deadline driving the sale (1031 exchange, divorce, estate, relocation)? That informs how much negotiation room exists.
- Crime grade is F in this area — have there been break-ins, vandalism, or insurance claims at this property in the last 3 years? What carrier currently insures it and at what premium?
- The area grade is low — what's the realistic commute time and amenity access for the typical tenant pool here? Any planned neighborhood developments (good or bad) we should know about?
- What's the average days-on-market for RENTAL listings here right now (not sales)? A rising rental-DOM trend means longer vacancies and softer asking-rent achievability than the comps imply.
- What's the recent tenant-quality profile in this submarket — average credit score on applications, eviction rate, late-payment / NSF rate, and stable-employment percentage? A property-management company in the area should have these aggregated.
- How much new for-sale + rental construction is in the pipeline within 1–3 miles? Heavy new supply typically softens prices + rents 12–24 months out; constrained supply supports both.
Investment metrics
- 1% rule
- 1.00% ✗
- Cap rate
- 6.20%
- Cash-on-cash
- -0.33%
- DSCR
- 0.99
- GRM
- 8.3
CMA / ARV
- ARV (median comp)
- $132,576
- List price
- $115,555
- Delta
- -12.84%
- Verdict
- UNDERPRICED
- Comps
- 20 within 1.0 mi
Show comp detail 12 sales within ~0.75 mi
| Address | Dist | Beds/Ba | Sqft | Sold | Price | $/sf | Match |
|---|---|---|---|---|---|---|---|
| 334 Fairview | 0.14mi | 2/1.0 | 832 (-3%) | 12mo | $130,000 | $156 | 78 |
| 442 Ward | 0.29mi | 2/1.0 | 934 (+9%) | 1mo | $143,800 | $154 | 71 |
| 3714 S Olive St | 0.17mi | 2/1.0 | 780 (-9%) | 12mo | $149,900 | $192 | 67 |
| 306 Monticello | 0.48mi | 2/1.0 | 848 (-1%) | 10mo | $90,000 | $106 | 67 |
| 203 Sandra Dr | 0.31mi | 3/1.0 (+1) | 868 (+1%) | 20mo | $79,000 | $91 | 62 |
| 919 Fair Ave | 0.68mi | 2/1.0 | 839 (-2%) | 4mo | $107,500 | $128 | 61 |
| 610 Mebane St | 0.18mi | 2/1.0 | 772 (-10%) | 20mo | $150,000 | $194 | 58 |
| 106 Regina St | 0.17mi | 3/2.0 (+1) | 924 (+8%) | 20mo | $120,000 | $130 | 53 |
| 414 Kathy | 0.59mi | 3/2.0 (+1) | 946 (+10%) | 2mo | $125,000 | $132 | 45 |
| 318 Uvalde | 0.64mi | 2/1.0 | 768 (-10%) | 11mo | $90,000 | $117 | 43 |
| 118 Maurine Dr | 0.60mi | 2/1.0 | 950 (+11%) | 15mo | $149,000 | $157 | 41 |
| 407 Wharton St | 0.75mi | 2/1.0 | 784 (-9%) | 16mo | $95,000 | $121 | 37 |
Match score weights: distance 35% · size 25% · config 20% · recency 20%. Top-matched comps best support the ARV.
Projected returns pro-forma
-3.0% appreciation · 0.0% rent growth · sell at horizon
- IRR
- -20.7%
- Equity multiple
- 0.30×
- Total profit
- $-22,575
- Equity at exit
- $17,230
- IRR
- -24.7%
- Equity multiple
- -0.02×
- Total profit
- $-33,075
- Equity at exit
- $9,991
Cash invested: $32,355 (down + closing). Projections, not guarantees.
Landlord ↔ Tenant lean methodology
- Overall (STATE)
- 87 Strongly Landlord-Friendly
- State Texas
- 87 Strongly Landlord-Friendly · R+5
- County
- — inherits STATE
- City
- — inherits STATE
ZIP-level market 78223
- Home prices YoY
- -16.4%
- Rents YoY
- -3.4%
- Active inventory
- 329
- Price-to-rent
- 8.3×
Monthly cashflow live
- Estimated rent
- $1,154 high interval (Pro) →
- Mortgage (P&I)
- −$606
- Tax from tax record
- −$266 /mo · $3,196/yr
- Insurance
- −$48
- HOA
- −$0
- Vacancy / Maint / Mgmt
- −$242
- Net cashflow
- $-9
Break-even live
Sensitivity live
| Price | -10% $57 | -5% $24 | +0% $-9 | +5% $-42 | +10% $-74 |
|---|---|---|---|---|---|
| Rent | -10% $-100 | -5% $-54 | +0% $-9 | +5% $37 | +10% $82 |
| Rate | -1.0pp $49 | -0.5pp $21 | base $-9 | +0.5pp $-39 | +1.0pp $-69 |
UW: 25.0% down · 7.5% · 30yr · 1.5% tax · 5.0% vac · 8.0% maint · 8.0% mgmt
Financing live
Cash to close
- Down payment
- $28,889
- Closing costs
- $3,467
- Reserves months
- —
- Total cash needed
- —
Loan-product check · same deal, 3 products live
Conventional
25% down · 7.5% · 30yr
- Down + closing
- —
- Monthly P&I
- —
- Monthly cashflow
- —
- DSCR
- —
- Eligible?
- —
Personal DTI + credit; lowest rate.
DSCR
20% down · 8.5% · 30yr
- Down + closing
- —
- Monthly P&I
- —
- Monthly cashflow
- —
- DSCR
- —
- Eligible?
- —
No personal income docs; deal must DSCR.
Hard money
10% down · 12.0% · 12mo
- Down + closing
- —
- Monthly P&I
- —
- Monthly cashflow
- —
- DSCR
- —
- Eligible?
- —
Short-term bridge; refi at stabilization.
Rent comps 40 comps
| Address | Beds | Baths | Sqft | Rent | $/sqft | DOM | Units | Dist |
|---|---|---|---|---|---|---|---|---|
| 232 Regina St Unit 1 San Antonio, TX | 2.0 | 1.0 | 1085 | $1,399 | $1.29 | 4d | 1 | 0.04mi |
| 134 Ward Ave San Antonio, TX | 2.0 | 1.0 | 1063 | $1,150 | $1.08 | 45d | 1 | 0.29mi |
| 4115 S Presa St San Antonio, TX | 1.0 | 1.0 | 700 | $795 | $1.14 | 45d | 1 | 0.36mi |
| 4115 S Presa St Unit 2 San Antonio, TX | 1.0 | 1.0 | 700 | $749 | $1.07 | 16d | 1 | 0.36mi |
| 116 Kathy Dr San Antonio, TX | 1.0 | 1.0 | 852 | $1,125 | $1.32 | 45d | 1 | 0.38mi |
| 2450 Roosevelt Ave San Antonio, TX | 1.0 | 1.0 | 645 | $1,442 | $2.23 | 45d | 8 | 0.45mi |
| 515 Stratford Ct Unit NA San Antonio, TX | 3.0 | 1.0 | 895 | $1,550 | $1.73 | 45d | 1 | 0.56mi |
| 656 Riverside Dr Unit 1 San Antonio, TX | 3.0 | 1.0 | 800 | $750 | $0.94 | 6d | 1 | 0.61mi |
| 927 VFW Blvd Unit 610 San Antonio, TX | 1.0 | 1.0 | 820 | $842 | $1.03 | 18d | 1 | 0.62mi |
| 927 VFW Blvd Unit 710 San Antonio, TX | 2.0 | 2.0 | 921 | $932 | $1.01 | 18d | 1 | 0.62mi |
| 927 Vfw Blvd San Antonio, TX | 1.0–3.0 | 1.0–2.0 | 937 | $1,090 | $1.16 | 0d | 29 | 0.64mi |
| 2914 Roosevelt Ave San Antonio, TX | 1.0–3.0 | 1.0–2.0 | 868 | $1,271 | $1.46 | 45d | 1 | 0.65mi |
| 114 Glenwood Ct Unit 2 San Antonio, TX | 1.0 | 1.0 | 600 | $1,200 | $2.00 | 0d | 1 | 0.67mi |
| 1528 Steves Ave Unit 1 San Antonio, TX | 2.0 | 1.0 | 940 | $1,025 | $1.09 | 45d | 1 | 0.80mi |
| 116 Hot Wells Blvd Unit 3 San Antonio, TX | 1.0 | 1.0 | 728 | $1,050 | $1.44 | 0d | 1 | 0.83mi |
| 1019 Steves Ave Unit 1 San Antonio, TX | 2.0 | 1.0 | 800 | $1,350 | $1.69 | 6d | 1 | 0.89mi |
| 1131 McKinley Ave San Antonio, TX | 2.0 | 1.0 | 1000 | $1,550 | $1.55 | 6d | 1 | 0.89mi |
| 2335 Nopal St Unit 108 San Antonio, TX | 2.0 | 1.0 | 805 | $975 | $1.21 | 6d | 1 | 0.91mi |
| 329 Hot Wells Blvd Unit FRONT UNIT San Antonio, TX | 2.0 | 1.0 | 756 | $1,150 | $1.52 | 0d | 1 | 0.92mi |
| 329 Hot Wells Blvd Unit R San Antonio, TX | 1.0 | 1.0 | 800 | $850 | $1.06 | 25d | 1 | 0.92mi |
| 204 E Dullnig Ct Unit 3 San Antonio, TX | 1.0 | 1.0 | 550 | $750 | $1.36 | 19d | 1 | 0.96mi |
| 204 E Dullnig Ct Unit 20 San Antonio, TX | 2.0 | 1.0 | 750 | $950 | $1.27 | 23d | 1 | 0.96mi |
| 236 E Dullnig Ct San Antonio, TX | 1.0 | 1.0 | 800 | $899 | $1.12 | 45d | 1 | 1.03mi |
| 236 E Dullnig Ct San Antonio, TX | 1.0 | 1.0 | 850 | $850 | $1.00 | 4d | 1 | 1.03mi |
| 142 Avant Ave Unit 3 San Antonio, TX | 1.0 | 1.0 | 700 | $950 | $1.36 | 45d | 1 | 1.04mi |
| 523 Bailey Ave San Antonio, TX | 2.0 | 2.0 | 960 | $1,500 | $1.56 | 25d | 1 | 1.12mi |
| 827 Steves Ave San Antonio, TX | 2.0 | 1.0 | 579 | $750 | $1.30 | 4d | 1 | 1.13mi |
| 827 Steves Ave #3 San Antonio, TX | 2.0 | 1.0 | 579 | $795 | $1.37 | 25d | 1 | 1.13mi |
| 510 Avant Ave San Antonio, TX | 1.0 | 1.0 | 956 | $700 | $0.73 | 5d | 1 | 1.14mi |
| 1506 Schley Ave San Antonio, TX | 1.0 | 1.0 | 725 | $850 | $1.17 | 45d | 1 | 1.17mi |
| 1914 S Pine St San Antonio, TX | 2.0 | 1.0 | 1025 | $1,250 | $1.22 | 45d | 1 | 1.18mi |
| 439 Dunning Ave San Antonio, TX | 2.0 | 2.0 | 1050 | $1,500 | $1.43 | 6d | 1 | 1.20mi |
| 1124 Vanderbilt St San Antonio, TX | 3.0 | 1.0 | 1095 | $1,350 | $1.23 | 45d | 1 | 1.24mi |
| 2407 S New Braunfels Ave Unit 3 San Antonio, TX | 2.0 | 1.0 | 800 | $825 | $1.03 | 45d | 1 | 1.25mi |
| 2407 S New Braunfels Ave Unit 3 San Antonio, TX | 2.0 | 1.0 | 800 | $825 | $1.03 | 25d | 1 | 1.25mi |
| 222 E Mitchell St San Antonio, TX | 1.0–2.0 | 1.0–2.0 | 954 | $1,825 | $1.91 | 0d | 17 | 1.29mi |
| 508 Kayton Ave San Antonio, TX | 2.0 | 1.0 | 1058 | $1,200 | $1.13 | 18d | 1 | 1.29mi |
| 311 Glamis Ave San Antonio, TX | 3.0 | 1.0 | 1100 | $1,195 | $1.09 | 0d | 1 | 1.29mi |
| 311 Glamis Ave Unit 2 San Antonio, TX | 3.0 | 1.0 | 900 | $1,395 | $1.55 | 45d | 1 | 1.29mi |
| 217 Castillo Ave Apt 3 San Antonio, TX | 1.0 | 1.0 | 749 | $1,000 | $1.34 | 45d | 1 | 1.29mi |
Listing history 21 events
-
2026-06-21days on market $115,555 Active 252 DOM
-
2026-06-18days on market $115,555 Active 249 DOM
-
2026-06-17days on market $115,555 Active 248 DOM
-
2026-06-16days on market $115,555 Active 247 DOM
-
2026-06-15days on market $115,555 Active 246 DOM
-
2026-06-13days on market $115,555 Active 244 DOM
-
2026-06-09days on market $115,555 Active 240 DOM
-
2026-06-08days on market $115,555 Active 239 DOM
-
2026-06-07days on market $115,555 Active 238 DOM
-
2026-06-04days on market $115,555 Active 235 DOM
-
2026-06-03days on market $115,555 Active 234 DOM
-
2026-06-02days on market $115,555 Active 233 DOM
-
2026-06-01days on market $115,555 Active 232 DOM
-
2026-05-31days on market $115,555 Active 231 DOM
-
2026-01-20$115,555 Back on Market 697-char remark
Show marketing remark (697 chars)
Multi Family Investment Opportunity in Southeast San Antonio! This property is the perfect opportunity for an investor or a first-time homebuyer. plenty of space to add a 3rd bedroom with a second full bath. The main home features 2 bedrooms and 1 bathroom - fully livable but ready for your personal touch and updates. In addition to the main house, there's a spacious garage with an apartment in the back, offering excellent rental or guest unit potential. Located in the growing Southeast San Antonio area, this property has tons of potential to become a beautiful and valuable home with the right improvements. Seller is open to all offers, so don't miss your chance to check it out!
-
2026-01-16soldstatus Sold 697-char remark
Show marketing remark (697 chars)
Multi Family Investment Opportunity in Southeast San Antonio! This property is the perfect opportunity for an investor or a first-time homebuyer. plenty of space to add a 3rd bedroom with a second full bath. The main home features 2 bedrooms and 1 bathroom - fully livable but ready for your personal touch and updates. In addition to the main house, there's a spacious garage with an apartment in the back, offering excellent rental or guest unit potential. Located in the growing Southeast San Antonio area, this property has tons of potential to become a beautiful and valuable home with the right improvements. Seller is open to all offers, so don't miss your chance to check it out!
-
2025-10-19price $115,555 697-char remark
Show marketing remark (697 chars)
Multi Family Investment Opportunity in Southeast San Antonio! This property is the perfect opportunity for an investor or a first-time homebuyer. plenty of space to add a 3rd bedroom with a second full bath. The main home features 2 bedrooms and 1 bathroom - fully livable but ready for your personal touch and updates. In addition to the main house, there's a spacious garage with an apartment in the back, offering excellent rental or guest unit potential. Located in the growing Southeast San Antonio area, this property has tons of potential to become a beautiful and valuable home with the right improvements. Seller is open to all offers, so don't miss your chance to check it out!
-
2025-10-10price $120,500 697-char remark
Show marketing remark (697 chars)
Multi Family Investment Opportunity in Southeast San Antonio! This property is the perfect opportunity for an investor or a first-time homebuyer. plenty of space to add a 3rd bedroom with a second full bath. The main home features 2 bedrooms and 1 bathroom - fully livable but ready for your personal touch and updates. In addition to the main house, there's a spacious garage with an apartment in the back, offering excellent rental or guest unit potential. Located in the growing Southeast San Antonio area, this property has tons of potential to become a beautiful and valuable home with the right improvements. Seller is open to all offers, so don't miss your chance to check it out!
-
2025-10-08$129,500 New 697-char remark
Show marketing remark (697 chars)
Multi Family Investment Opportunity in Southeast San Antonio! This property is the perfect opportunity for an investor or a first-time homebuyer. plenty of space to add a 3rd bedroom with a second full bath. The main home features 2 bedrooms and 1 bathroom - fully livable but ready for your personal touch and updates. In addition to the main house, there's a spacious garage with an apartment in the back, offering excellent rental or guest unit potential. Located in the growing Southeast San Antonio area, this property has tons of potential to become a beautiful and valuable home with the right improvements. Seller is open to all offers, so don't miss your chance to check it out!
-
2022-02-24soldstatus
-
1988-06-01soldstatus
ⓘ Source: listings_history table (triggers on properties + properties_extension) + one-shot
backfill from property_details.listing_events for pre-trigger history.
Tax reassessment forecast TX · Resets to sale price
- Current annual tax
- $3,196 · $266/mo
- Projected year-2 tax
- $3,196 · $266/mo
- Expected delta
- $0/yr ($0/mo · 0.0%)
ⓘ Screening estimate from a state-policy table — verify with the county assessor before closing.
Climate risk First Street
- Flood 1/10 Low FEMA zone X (unshaded) · 0% chance over 30 yrs
- Wildfire 1/10 Low
- Heat 8/10 Severe 7 d/yr ≥108°F today · 20 d/yr by 30 yrs out
- Wind 8/10 Severe 80% chance of damaging wind over 30 yrs
- Air quality 2/10 Low 1 unhealthy d/yr today · 2 by 30 yrs out
Nearby sold comps map
Loading sold comps map…
Walkable amenities ~0.75 mi
Loading nearby amenities…
Taxation est. · year 1
- Rental income
- $13,848
- − Mortgage interest
- −$6,473
- − Property taxes
- −$3,196
- − Insurance
- −$578
- − Repairs & maintenance
- −$1,108
- − Management
- −$1,108
- − Depreciation
- −$3,362
- Taxable loss
- −$1,976
- Est. tax savings @ 24.0%
- +$474
- After-tax cash flow
- $369/yr
For passive investors: Depreciation is non-cash, so a rental often shows a tax loss while cash-flowing — sheltering income. Rental losses are passive: they offset passive income freely, and up to $25,000/yr can offset ordinary (W-2) income if you actively participate and your MAGI is under $100k (phasing out to $0 by $150k); unused losses carry forward. On sale, claimed depreciation is recaptured at up to 25%, and gains may owe capital-gains tax (a 1031 exchange can defer both). Figures are a year-1 estimate at your 24.0% rate — not tax advice; consult a CPA.
Schools (NCES district)
- District
- San Antonio ISD
- NCES district ID
- 4838730
- Math proficiency
- 12% ▼ -21.00%
- Reading proficiency
- 22% ▼ -7.00%
- Median HH income
- $30,952
- Composite
- 13.57/100
- National rank
- #9512
- State rank
- #805 of 826 in TX
Livability — San Antonio
- Score
- 80/100
- State rank
- #31
- US rank
- #1616
Category grades
Schools grade is shown separately in the Schools card above.
Census & demographics
- Census place
- San Antonio, TX
- County
- Bexar County · 1,990,555 people
- City population
- 1,806,925
- Metro
- San Antonio-New Braunfels, TX
- Population (ZIP)
- 58,983
- Household income
- $52,088
- Rent vs Own
- Severe rent burden
- 2809.0
Population outlook (Bexar County) Hauer SSP2
- Today (2025)
- 2,336,851 people
- By 2030
- 2,560,728 · +9.6%
- By 2040
- 3,020,569 · +29.3%
- By 2050
- 3,493,522 · +49.5%
- By 2075
- 4,668,459 · +99.8%
- By 2100
- 5,533,242 · +136.8%
Race, ethnicity, and origin ACS 2023
- Neighborhood character
- Predominantly Hispanic (76%)
- Race & ethnicity
- Hispanic / Latino 76% Two or more races 28% White 16% Black 5% Asian 2% Native American 1%
- Hispanic origin (detail)
- Mexican 67%
- Common ancestry
- Lithuanian 2% Romanian 1% Slovak 1%
- Foreign-born
- 10% · Canada, Vietnam
- Languages at home
- 63% English-only · Spanish 36%
Political lean MEDSL · Bexar
- 2024 margin
- Lean D (+9.8) · D 54.3% · R 44.6% · Other 1.1%
- 2008→2024 swing
- +4.2pp toward D · 2008: 5.6pp · 2024: 9.8pp
- All cycles
- 2024: D+9.8 2020: D+18.2 2016: D+13.5 2012: D+4.6 2008: D+5.6
Not yet ingested
- Civics
- —
Market trends
- HPI YoY
- ▼ -52.06%
- Current HPI
- 265.2235
- Rent YoY
- ▼ -3.36%
- Metro
- San Antonio-New Braunfels, TX
- State GDP YoY
- ▲ 3.95%
- F500 in state
- 110
Industry mix (Fortune 500 HQ in TX)
| Industry | F500 HQs | Revenue |
|---|---|---|
| Energy | 16 | $1,198B |
|
||
| Technology | 5 | $198B |
|
||
| Engineering / Construction | 4 | $72B |
|
||
| Energy Services | 3 | $60B |
|
||
| Utilities | 3 | $41B |
|
||
| Healthcare | 2 | $330B |
|
||
Price history
-10.8% since first listed7 events — show timeline
- 2026-01-20 Listed $115,555 LERA
- 2026-01-16 Sold (MLS) — LERA
- 2025-10-19 Price Changed $115,555 LERA
- 2025-10-10 Price Changed $120,500 LERA
- 2025-10-08 Listed $129,500 LERA
- 2022-02-24 Sold (Public Records) — Public Records
- 1988-06-01 Sold (Public Records) — Public Records
Property tax history
+6.8%/yrLatest (2025): $3,196 · +0.0% YoY. Source: county tax records.
Cash-flow waterfall
monthlySold comps — $/sqft
last 12 mo · ≤1 miLoading sold comps…