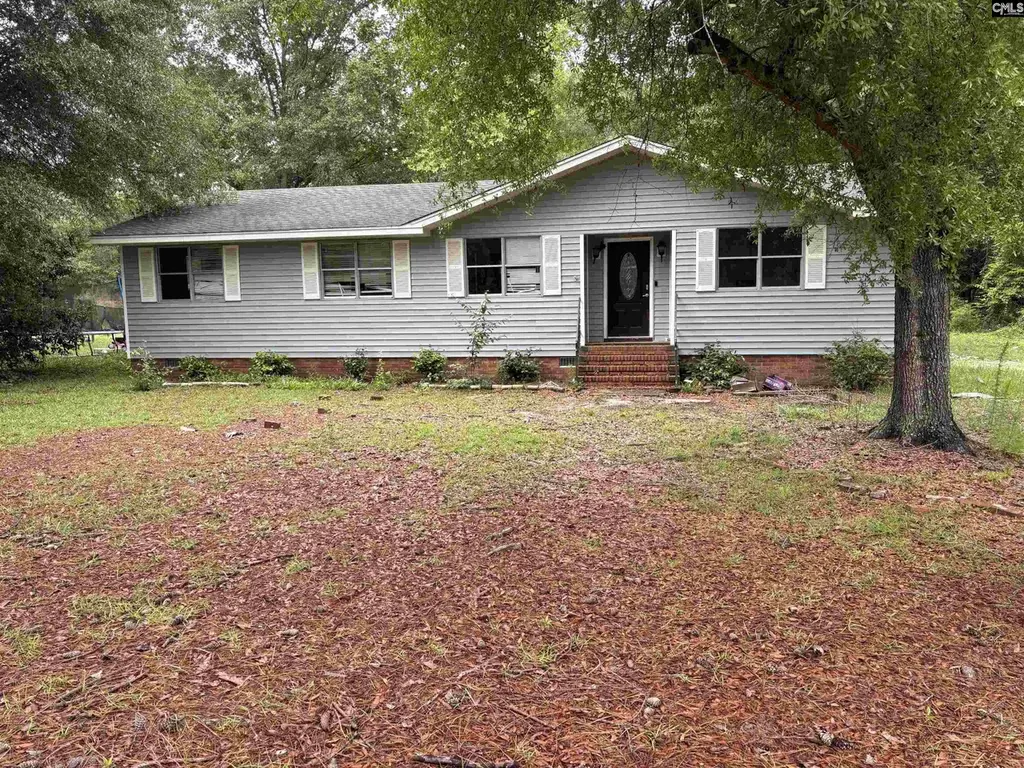
2137 Bull Swamp Rd · North, SC
Flood risk 1/10 · Minimal
- FEMA flood zone
- X (unshaded)
- Chance of flooding over 30 yrs
- 0.0%
- Est. flood insurance / yr
- $507 – $1,088
Fire risk 6/10 · Moderate
- Est. fire insurance / yr
- $783 – $1,453
Heat risk 6/10 · Moderate
- Hot days now (above 107°F)
- 7 days/yr
- Hot days in 30 yrs
- 16 days/yr
Wind risk 8/10 · Major
- Chance of severe wind over 30 yrs
- 80.0%
Air-quality risk 3/10 · Minor
- Unhealthy air days now
- 3 days/yr
- Unhealthy air days in 30 yrs
- 3 days/yr
Risk factors via First Street. Map © Google.
Why this score? — see what drove the D+ grade
The composite is a weighted blend of 9 inputs, each scored 0–100. Each bar is that input's sub-score; the figure is the points it added to the 100-point composite (weight × sub-score).
- Cash flow +12.0/30.0
- Appreciation +10.0/10.0
- ARV discount +7.5/15.0
- Schools +5.0/10.0
- DSCR +3.6/10.0
- 1% rule +3.4/10.0
- Livability +2.9/5.0
- Rent growth +2.5/5.0
- Condition / age +1.0/5.0
$165,000
🖨 Deal sheet 📄 Offer letter ✓ Due diligence
Listing remarks MLS
Country Living very close to Calhoun County, St Matthews, and Orangeburg! Look at this lovely updated 4 bedroom 2 bath home! It sits off of the road on almost 5 acres with beautiful trees, trails, and a large rear deck. The entire home has newer plank flooring, newer paint, updated kitchen, updated bathrooms, a large mudroom/laundry room, and a very cool rustic fireplace. Lots of love to be had in this perfect private home. It shows amazing and will not last long! Call today for a showing!
Key facts
- Nearly 5 acres
- 4.9 acre lot
- Built 1984
Tags
Property features AI
Finance
- Other: Property sits on approximately 4.9 acres
Exterior
- Utilities: Well water; Septic sewer
- Home design: Single-story home
- Construction: Crawlspace foundation
- Exterior features: Vinyl exterior finish; Paved road access
Interior
- Kitchen: Wood-natural cabinets; Convection range
- Bedrooms: Master bedroom with private bath and ceiling fan (main level); Bedroom 2 with vinyl flooring (main level); Bedroom 3 with shared bath and vinyl flooring (main level); Bedroom 4 with shared bath and vinyl flooring (main level)
- Flooring: Vinyl flooring throughout main living areas and bedrooms
- Bathrooms: Two full bathrooms
- Heating & cooling: Heat pump on first level; Central cooling
- Interior features: One fireplace; Convection range
- Laundry & utility: Main-level utility/laundry room
Neighborhood map
What this means for you Summary
Snapshot
- This is a 4-bed/2.0-bath single-family listed at $165k. Condition is rated poor.
Deal economics
- At list price, monthly cash flow is $-39 ($-467/yr) — negative.
- To cash-flow at today's rent, offer at most $159k (3.4% below list).
- To meet the 1% rule (rent ≥ 1% of price), the offer needs to be $139k (15.5% below list).
- Recommended offer: $139k (15.5% below list) — sets the bar for 1% rule.
Location & tenants
- Location reads 57/100 on livability (#280 in SC) — a working-class tenant base; expect higher turnover. Strengths: cost of living A+, housing B; Watch: schools F, amenities F, commute F.
- Market conditions: 33 active listings in the ZIP; 87 units permitted in Orangeburg County in 2024 (0 in 5+ unit buildings).
Forward outlook
- In year one you build about $18k of equity ($1k loan paydown + $16k appreciation (10.0% local appreciation)).
- Orangeburg County population projected at -27% by 2050 — secular population decline; favor cash flow + early exit over multi-decade hold.
- At projected returns (10.0% appreciation + 3.0% rent growth), your $46k cash investment doubles in ~3 years — after that, you're playing with house money.
- By year 3, paydown + projected appreciation supports a ~$45k cash-out refi (75% LTV) — recoverable capital for the next deal without selling this one.
Negotiation context
- It's been on market 16 days — a 2% lower offer ($163k) is reasonable based on typical stale-listing flexibility.
Risks & watch-outs
- Climate carrying-cost: severe wind risk, 80% chance of damaging wind over 30y; major wildfire risk; extreme-heat days projected 7→16/yr by 2055 (HVAC capex compounding) — expect insurance premiums to compound above CPI over the hold.
Questions for the listing agent
- What do current leases actually rent for vs. the listed asking? Can we see a recent rent roll and the last 12 months of T-12 income?
- Have any recent inspections been done? Can we get a copy of the seller's disclosures and any deferred-maintenance estimates?
- Is there a deadline driving the sale (1031 exchange, divorce, estate, relocation)? That informs how much negotiation room exists.
- Schools are F-rated, which usually means shorter tenancies and higher turnover. Who's the typical renter profile here, and what's been the actual vacancy rate?
- The area grade is low — what's the realistic commute time and amenity access for the typical tenant pool here? Any planned neighborhood developments (good or bad) we should know about?
- What's the average days-on-market for RENTAL listings here right now (not sales)? A rising rental-DOM trend means longer vacancies and softer asking-rent achievability than the comps imply.
- What's the recent tenant-quality profile in this submarket — average credit score on applications, eviction rate, late-payment / NSF rate, and stable-employment percentage? A property-management company in the area should have these aggregated.
- How much new for-sale + rental construction is in the pipeline within 1–3 miles? Heavy new supply typically softens prices + rents 12–24 months out; constrained supply supports both.
Investment metrics
- 1% rule
- 0.84% ✗
- Cap rate
- 6.01%
- Cash-on-cash
- -1.01%
- DSCR
- 0.96
- GRM
- 9.9
CMA / ARV
No comps found within radius.
Projected returns pro-forma
10.0% appreciation · 3.0% rent growth · sell at horizon
- IRR
- 23.6%
- Equity multiple
- 2.89×
- Total profit
- $87,408
- Equity at exit
- $148,645
- IRR
- 21.0%
- Equity multiple
- 6.61×
- Total profit
- $259,392
- Equity at exit
- $320,559
Cash invested: $46,200 (down + closing). Projections, not guarantees.
Landlord ↔ Tenant lean methodology
- Overall (STATE)
- 90 Strongly Landlord-Friendly
- State South Carolina
- 90 Strongly Landlord-Friendly · R+6
- County
- — inherits STATE
- City
- — inherits STATE
ZIP-level market 29112
- Home prices YoY
- 11.7%
- Active inventory
- 33
- Price-to-rent
- 9.9×
Monthly cashflow live
- Estimated rent
- $1,394 medium interval (Pro) →
- Mortgage (P&I)
- −$865
- Tax est. 1.5%
- −$206 /mo · $2,475/yr
- Insurance
- −$69
- HOA
- −$0
- Vacancy / Maint / Mgmt
- −$293
- Net cashflow
- $-39
Break-even live
UW: 25.0% down · 7.5% · 30yr · 1.5% tax · 5.0% vac · 8.0% maint · 8.0% mgmt
Financing live
Cash to close
- Down payment
- $41,250
- Closing costs
- $4,950
- Reserves months
- —
- Total cash needed
- —
Loan-product check · same deal, 3 products live
Conventional
25% down · 7.5% · 30yr
- Down + closing
- —
- Monthly P&I
- —
- Monthly cashflow
- —
- DSCR
- —
- Eligible?
- —
Personal DTI + credit; lowest rate.
DSCR
20% down · 8.5% · 30yr
- Down + closing
- —
- Monthly P&I
- —
- Monthly cashflow
- —
- DSCR
- —
- Eligible?
- —
No personal income docs; deal must DSCR.
Hard money
10% down · 12.0% · 12mo
- Down + closing
- —
- Monthly P&I
- —
- Monthly cashflow
- —
- DSCR
- —
- Eligible?
- —
Short-term bridge; refi at stabilization.
Listing history 13 events
-
2026-06-19days on market $165,000 Active 16 DOM
-
2026-06-18days on market $165,000 Active 15 DOM
-
2026-06-17days on market $165,000 Active 14 DOM
-
2026-06-16days on market $165,000 Active 13 DOM
-
2026-06-15days on market $165,000 Active 12 DOM
-
2026-06-14days on market $165,000 Active 10 DOM
-
2026-06-12days on market $165,000 Active 9 DOM
-
2026-06-09days on market $165,000 Active 6 DOM
-
2026-06-08days on market $165,000 Active 5 DOM
-
2026-06-07days on market $165,000 Active 4 DOM
-
2026-06-07days on market $165,000 Active 3 DOM
-
2026-06-04remarks 658-char remark
-
2026-06-04$165,000 Active 1 DOM
ⓘ Source: listings_history table (triggers on properties + properties_extension) + one-shot
backfill from property_details.listing_events for pre-trigger history.
Climate risk First Street
- Flood 1/10 Low FEMA zone X (unshaded) · 0% chance over 30 yrs
- Wildfire 6/10 Major
- Heat 6/10 Major 7 d/yr ≥107°F today · 16 d/yr by 30 yrs out
- Wind 8/10 Severe 80% chance of damaging wind over 30 yrs
- Air quality 3/10 Moderate 3 unhealthy d/yr today · 3 by 30 yrs out
Nearby sold comps map
Loading sold comps map…
Walkable amenities ~0.75 mi
Loading nearby amenities…
Taxation est. · year 1
- Rental income
- $16,730
- − Mortgage interest
- −$9,243
- − Property taxes
- −$2,475
- − Insurance
- −$825
- − Repairs & maintenance
- −$1,338
- − Management
- −$1,338
- − Depreciation
- −$4,800
- Taxable loss
- −$3,289
- Est. tax savings @ 24.0%
- +$789
- After-tax cash flow
- $323/yr
For passive investors: Depreciation is non-cash, so a rental often shows a tax loss while cash-flowing — sheltering income. Rental losses are passive: they offset passive income freely, and up to $25,000/yr can offset ordinary (W-2) income if you actively participate and your MAGI is under $100k (phasing out to $0 by $150k); unused losses carry forward. On sale, claimed depreciation is recaptured at up to 25%, and gains may owe capital-gains tax (a 1031 exchange can defer both). Figures are a year-1 estimate at your 24.0% rate — not tax advice; consult a CPA.
Condition & rehab AI · 4 photos
This property presents a significant opportunity for extensive renovation, with major repairs needed to the exterior siding, roof, and landscaping. Improvements in these areas will significantly boost its resale and rental value.
Repairs flagged
- Major exterior siding — The siding is visibly weathered and stained, indicating significant damage and the need for replacement.
- Major roof — The roof appears aged and may need replacement, as indicated by the overall poor condition of the exterior.
- Major landscaping — The landscaping is overgrown and debris is scattered around the foundation, indicating a need for significant maintenance and improvement.
Value-add opportunities
- Resale exterior siding replacement — Replacing the weathered siding will significantly improve the home's curb appeal and overall appearance, making it more attractive to potential buyers.
- Both landscaping and debris removal — A well-maintained exterior and clear of debris will enhance both the resale and rental value by presenting the property in a more appealing and professional manner.
Renovation cost estimate screening
| Repair item | Severity | Est. cost |
|---|---|---|
| exterior siding · The siding is visibly weathered and stained, indicating significant damage and the need for replacement. | Major | $15,000–50,000 |
| roof · The roof appears aged and may need replacement, as indicated by the overall poor condition of the exterior. | Major | $15,000–50,000 |
| landscaping · The landscaping is overgrown and debris is scattered around the foundation, indicating a need for significant maintenance and improvement. | Major | $15,000–50,000 |
| Total estimated repair cost · 3 items | $45,000–150,000 |
Value-add ROI direction
- Resale exterior siding replacement — Replacing the weathered siding will significantly improve the home's curb appeal and overall appearance, making it more attractive to potential buyers. ↑
- Both landscaping and debris removal — A well-maintained exterior and clear of debris will enhance both the resale and rental value by presenting the property in a more appealing and professional manner. ↑
ⓘ Cost ranges are severity-bucket heuristics (US national rule-of-thumb). Get contractor quotes + a written scope before underwriting a rehab budget.
Schools (NCES district)
No district data.
Livability — North
- Score
- 57/100
- State rank
- #280
- US rank
- #21976
Category grades
Schools grade is shown separately in the Schools card above.
Census & demographics
- Population (ZIP)
- 3,718
Population outlook (Orangeburg County) Hauer SSP2
- Today (2025)
- 82,698 people
- By 2030
- 78,615 · -4.9%
- By 2040
- 69,308 · -16.2%
- By 2050
- 60,629 · -26.7%
- By 2075
- 42,678 · -48.4%
- By 2100
- 28,136 · -66.0%
Race, ethnicity, and origin ACS 2023
- Neighborhood character
- Majority White (50%)
- Race & ethnicity
- White 50% Black 45% Two or more races 3% Hispanic / Latino 1% Native American 1%
- Common ancestry
- Lithuanian 2%
- Foreign-born
- 0%
- Languages at home
- 97% English-only · Spanish 2% Arabic 1%
Political lean MEDSL · Orangeburg
- 2024 margin
- Strong D (+24.6) · D 61.8% · R 37.2% · Other 1.1%
- 2008→2024 swing
- -13.5pp toward R · 2008: 38.1pp · 2024: 24.6pp
- All cycles
- 2024: D+24.6 2020: D+33.2 2016: D+37.0 2012: D+43.5 2008: D+38.1
Not yet ingested
- Civics
- —
Market trends
- HPI YoY
- ▲ 24.57%
- Current HPI
- 234.04
- Rent YoY
- —
- Metro
- —
- State GDP YoY
- ▲ 4.51%
- F500 in state
- 2
Industry mix (Fortune 500 HQ in SC)
| Industry | F500 HQs | Revenue |
|---|---|---|
| Packaging | 1 | $7B |
|
||
Price history
+2.5% since first listed2 events — show timeline
- 2026-06-03 Listed $165,000 Consolidated MLS
- 2020-04-20 Sold (MLS) $161,000 Charleston Trident MLS
Cash-flow waterfall
monthlySold comps — $/sqft
last 12 mo · ≤1 miLoading sold comps…