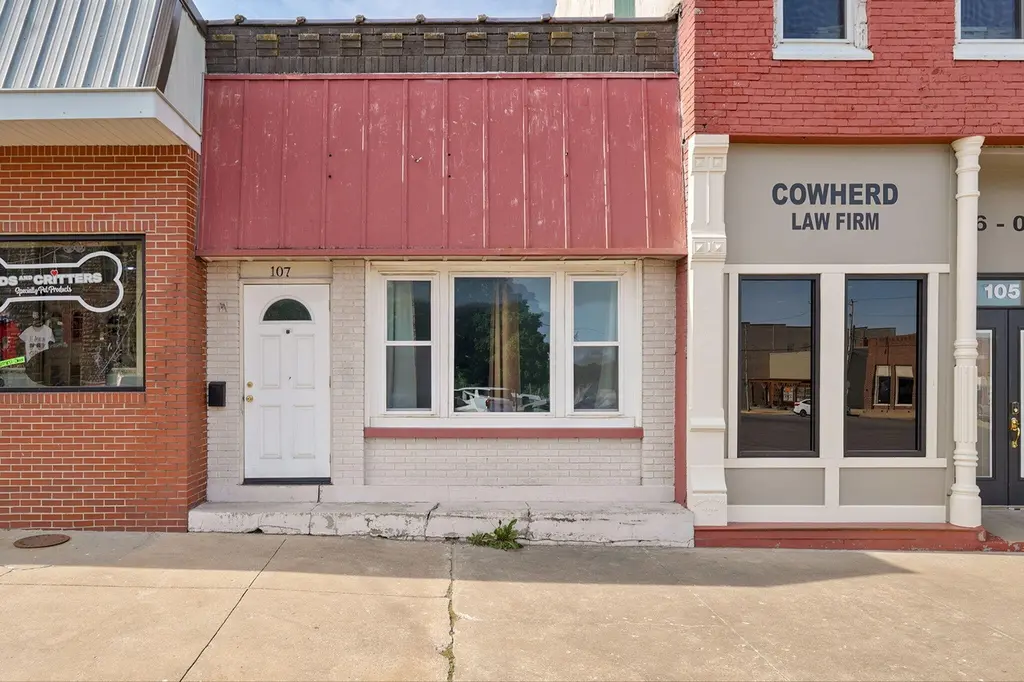
107 E Dallas St · Mount Vernon, MO
Flood risk 1/10 · Minimal
- FEMA flood zone
- X (unshaded)
- Chance of flooding over 30 yrs
- 0.0%
- Est. flood insurance / yr
- $507 – $1,088
Fire risk 4/10 · Minor
- Est. fire insurance / yr
- $1,054 – $1,958
Heat risk 5/10 · Moderate
- Hot days now (above 105°F)
- 7 days/yr
- Hot days in 30 yrs
- 20 days/yr
Wind risk 2/10 · Minimal
- Chance of severe wind over 30 yrs
- 1.0%
Air-quality risk 2/10 · Minimal
- Unhealthy air days now
- 1 days/yr
- Unhealthy air days in 30 yrs
- 2 days/yr
Risk factors via First Street. Map © Google.
Why this score? — see what drove the C grade
The composite is a weighted blend of 9 inputs, each scored 0–100. Each bar is that input's sub-score; the figure is the points it added to the 100-point composite (weight × sub-score).
- Cash flow +25.9/30.0
- DSCR +8.7/10.0
- ARV discount +7.5/15.0
- 1% rule +5.7/10.0
- Livability +3.6/5.0
- Schools +3.5/10.0
- Rent growth +2.5/5.0
- Condition / age +2.5/5.0
- Appreciation +0.0/10.0
$125,000
🖨 Deal sheet (PDF) 📄 Offer letter ✓ Due diligence
Listing remarks
Unique property overlooking the historic Lawrence County Courthouse in downtown Mt. Vernon! Currently configured as a 2-bedroom residence, this former commercial building offers a variety of potential uses. Continue using it as a home, convert it back to office space, or explore a live-work opportunity. Interior features include a section of the original exposed brick wall, adding character and charm. Property was extensively updated in 2013, with a new stove installed in 2026. Enjoy the convenience of being within walking distance of restaurants, shopping, and city parks. A rare opportunity with endless possibilities in a prime location. Live here, work here or do both!
Key facts
- Extensively updated
- Prime location
- 1,742 sq ft lot
Tags
Property features AI
Exterior
- Parking: Unassigned paved parking
- Utilities: Public water; Public sewer
- Home design: Single-family residence; One story
- Construction: Brick and block construction
- Exterior features: Asphalt road frontage on a city street; Publicly maintained road
Interior
- Kitchen: Electric oven; Free-standing electric oven; Dishwasher; Refrigerator; Exhaust fan
- Flooring: Carpet; Vinyl
- Bathrooms: 1 full bathroom
- Heating & cooling: Central heating (forced air); Natural gas heating; Exhaust fan for ventilation; Central air conditioning; Ceiling fan(s)
- Interior features: High ceilings; Has a view
- Laundry & utility: Laundry on main level
Neighborhood map
What this means for you Summary
Snapshot
- This is a 1-bed/2.0-bath other listed at $125k.
Deal economics
- At list price, monthly cash flow is $307 ($4k/yr) — positive.
- The deal already cash-flows at list — no discount required.
- Meets the 1% rule at list price ($1k rent vs $125k).
- Cap rate 9.2% vs local median 4.3% in Mount Vernon — top-decile yield for the area; either an underpriced asset or a hidden risk that comps aren't pricing in. Stress-test before assuming the spread holds.
Location & tenants
- Location reads 72/100 on livability (#98 in MO) — a middle-class / working-renter tenant base. Strengths: crime A+, cost of living A+, housing A+; Watch: amenities F, commute F, employment F.
- Mt. Vernon R-V (town): math 35% / reading 48% proficiency, ranked #129 of 324 in MO (top 40%) — families likely to look elsewhere, expect single-tenant / working-renter base with shorter leases.
- Zoned schools: Mt. Vernon Elem. (308 students, 53% FRL); Mt. Vernon Middle (math 36% / reading 43%, grade F, #189 of 391 statewide, top 51%, 361 students, 48% FRL); Mt. Vernon High (math 17% / reading 52%, grade F, #321 of 521 statewide, top 67%, 458 students, 37% FRL) — zoned schools at 46% FRL track the district average.
- Market conditions: 91 active listings in the ZIP; 67 units permitted in Lawrence County in 2024 (35 in 5+ unit buildings).
Forward outlook
- Local home prices are declining (-3.0%/yr); year-one equity from $864 of loan paydown is wiped out by about $4k of value loss. Plan a longer hold.
- Lawrence County population projected at -15% by 2050 — secular population decline; favor cash flow + early exit over multi-decade hold.
Negotiation context
- Only 11 days on market — expect competitive offers; lowballing is unlikely to land.
Risks & watch-outs
- Watch-outs: built in 1940 — expect roof / HVAC / electrical / plumbing capex.
- Climate carrying-cost: extreme-heat days projected 7→20/yr by 2055 (HVAC capex compounding) — expect insurance premiums to compound above CPI over the hold.
Questions for the listing agent
- Built in 1940 — when were the roof, HVAC, electrical panel, plumbing, and water heater last replaced?
- Is there a deadline driving the sale (1031 exchange, divorce, estate, relocation)? That informs how much negotiation room exists.
- What's the average days-on-market for RENTAL listings here right now (not sales)? A rising rental-DOM trend means longer vacancies and softer asking-rent achievability than the comps imply.
- What's the recent tenant-quality profile in this submarket — average credit score on applications, eviction rate, late-payment / NSF rate, and stable-employment percentage? A property-management company in the area should have these aggregated.
- How much new for-sale + rental construction is in the pipeline within 1–3 miles? Heavy new supply typically softens prices + rents 12–24 months out; constrained supply supports both.
Investment metrics
- 1% rule
- 1.07% ✓
- Cap rate
- 9.24%
- Cash-on-cash
- 10.53%
- DSCR
- 1.47
- GRM
- 7.8
CMA / ARV
No comps found within radius.
Projected returns pro-forma
-3.0% appreciation · 3.0% rent growth · sell at horizon
- IRR
- -0.6%
- Equity multiple
- 0.98×
- Total profit
- $-740
- Equity at exit
- $18,638
- IRR
- 9.1%
- Equity multiple
- 1.70×
- Total profit
- $24,340
- Equity at exit
- $10,808
Cash invested: $35,000 (down + closing). Projections, not guarantees.
Landlord ↔ Tenant lean methodology
- Overall (STATE)
- 81 Strongly Landlord-Friendly
- State Missouri
- 81 Strongly Landlord-Friendly · R+10
- County
- — inherits STATE
- City
- — inherits STATE
ZIP-level market 65712
- Home prices YoY
- -17.5%
- Active inventory
- 91
- Price-to-rent
- 7.8×
Monthly cashflow live
- Estimated rent
- $1,334 medium interval (Pro) →
- Mortgage (P&I)
- −$656
- Tax from tax record
- −$39 /mo · $465/yr
- Insurance
- −$52
- HOA
- −$0
- Vacancy / Maint / Mgmt
- −$280
- Net cashflow
- $307
Break-even live
Sensitivity live
| Price | -10% $378 | -5% $343 | +0% $307 | +5% $272 | +10% $236 |
|---|---|---|---|---|---|
| Rent | -10% $202 | -5% $255 | +0% $307 | +5% $360 | +10% $413 |
| Rate | -1.0pp $370 | -0.5pp $339 | base $307 | +0.5pp $275 | +1.0pp $242 |
UW: 25.0% down · 7.5% · 30yr · 1.5% tax · 5.0% vac · 8.0% maint · 8.0% mgmt
Financing live
Cash to close
- Down payment
- $31,250
- Closing costs
- $3,750
- Reserves months
- —
- Total cash needed
- —
Loan-product check · same deal, 3 products live
Conventional
25% down · 7.5% · 30yr
- Down + closing
- —
- Monthly P&I
- —
- Monthly cashflow
- —
- DSCR
- —
- Eligible?
- —
Personal DTI + credit; lowest rate.
DSCR
20% down · 8.5% · 30yr
- Down + closing
- —
- Monthly P&I
- —
- Monthly cashflow
- —
- DSCR
- —
- Eligible?
- —
No personal income docs; deal must DSCR.
Hard money
10% down · 12.0% · 12mo
- Down + closing
- —
- Monthly P&I
- —
- Monthly cashflow
- —
- DSCR
- —
- Eligible?
- —
Short-term bridge; refi at stabilization.
Listing history 10 events
-
2026-06-10status $125,000 Pending 11 DOM
-
2026-06-09days on market $125,000 Active 11 DOM
-
2026-06-08days on market $125,000 Active 10 DOM
-
2026-06-07days on market $125,000 Active 9 DOM
-
2026-06-03days on market $125,000 Active 5 DOM
-
2026-06-02days on market $125,000 Active 4 DOM
-
2026-06-01days on market $125,000 Active 3 DOM
-
2026-05-31days on market $125,000 Active 2 DOM
-
2026-05-30remarks 679-char remark
-
2026-05-30$125,000 Active 1 DOM
ⓘ Source: listings_history table (triggers on properties + properties_extension) + one-shot
backfill from property_details.listing_events for pre-trigger history.
Tax reassessment forecast MO · Resets to sale price
- Current annual tax
- $465 · $39/mo
- Projected year-2 tax
- $1,212 · $101/mo
- Expected delta
- +$748/yr (+$62/mo · 160.8%)
ⓘ Screening estimate from a state-policy table — verify with the county assessor before closing.
Climate risk First Street
- Flood 1/10 Low FEMA zone X (unshaded) · 0% chance over 30 yrs
- Wildfire 4/10 Moderate
- Heat 5/10 Major 7 d/yr ≥105°F today · 20 d/yr by 30 yrs out
- Wind 2/10 Low 100% chance of damaging wind over 30 yrs
- Air quality 2/10 Low 1 unhealthy d/yr today · 2 by 30 yrs out
Nearby sold comps map
Loading sold comps map…
Walkable amenities ~0.75 mi
Loading nearby amenities…
Taxation est. · year 1
- Rental income
- $16,004
- − Mortgage interest
- −$7,002
- − Property taxes
- −$465
- − Insurance
- −$625
- − Repairs & maintenance
- −$1,280
- − Management
- −$1,280
- − Depreciation
- −$3,636
- Taxable income
- $1,715
- Est. tax owed @ 24.0%
- −$412
- After-tax cash flow
- $3,275/yr
For passive investors: Depreciation is non-cash, so a rental often shows a tax loss while cash-flowing — sheltering income. Rental losses are passive: they offset passive income freely, and up to $25,000/yr can offset ordinary (W-2) income if you actively participate and your MAGI is under $100k (phasing out to $0 by $150k); unused losses carry forward. On sale, claimed depreciation is recaptured at up to 25%, and gains may owe capital-gains tax (a 1031 exchange can defer both). Figures are a year-1 estimate at your 24.0% rate — not tax advice; consult a CPA.
Schools (NCES district)
- District
- Mt. Vernon R-V
- NCES district ID
- 2921600
- Math proficiency
- 35% ▼ -4.00%
- Reading proficiency
- 48% ▼ -1.00%
- Median HH income
- $43,114
- Composite
- 35.03/100
- National rank
- #5040
- State rank
- #129 of 324 in MO
Livability — Mount Vernon
- Score
- 72/100
- State rank
- #98
- US rank
- #6475
Category grades
Schools grade is shown separately in the Schools card above.
Census & demographics
- Census place
- Mount Vernon, MO
- Population (ZIP)
- 8,910
Population outlook (Lawrence County) Hauer SSP2
- Today (2025)
- 37,142 people
- By 2030
- 36,212 · -2.5%
- By 2040
- 34,080 · -8.2%
- By 2050
- 31,621 · -14.9%
- By 2075
- 25,987 · -30.0%
- By 2100
- 20,151 · -45.7%
Race, ethnicity, and origin ACS 2023
- Neighborhood character
- Predominantly White (94%)
- Race & ethnicity
- White 94% Two or more races 4% Hispanic / Latino 2%
- Common ancestry
- Lithuanian 3% Slovak 2% Iranian 2%
- Foreign-born
- 2% · Canada
- Languages at home
- 95% English-only · Other Indo-European 2% Spanish 2% German/W. Germanic 1%
Political lean MEDSL · Lawrence
- 2024 margin
- Solid R (+63.8) · D 17.6% · R 81.5%
- 2008→2024 swing
- -26.8pp toward R · 2008: -37.1pp · 2024: -63.8pp
- All cycles
- 2024: R+63.8 2020: R+62.6 2016: R+61.1 2012: R+47.0 2008: R+37.1
Not yet ingested
- Civics
- —
Market trends
- HPI YoY
- ▼ -51.55%
- Current HPI
- 243.6185
- Rent YoY
- —
- Metro
- —
- State GDP YoY
- ▲ 1.84%
- F500 in state
- 20
Industry mix (Fortune 500 HQ in MO)
| Industry | F500 HQs | Revenue |
|---|---|---|
| Healthcare | 1 | $163B |
|
||
| Insurance | 1 | $21B |
|
||
| Industrial Technology | 1 | $17B |
|
||
| Retail | 1 | $16B |
|
||
| Industrial Distribution | 1 | $10B |
|
||
| Utilities | 1 | $9B |
|
||
Price history
1 event — show timeline
- 2026-05-29 Listed $125,000 SOMO
Property tax history
-1.6%/yrLatest (2025): $465 · +8.9% YoY. Source: county tax records.
Cash-flow waterfall
monthlySold comps — $/sqft
last 12 mo · ≤1 miLoading sold comps…