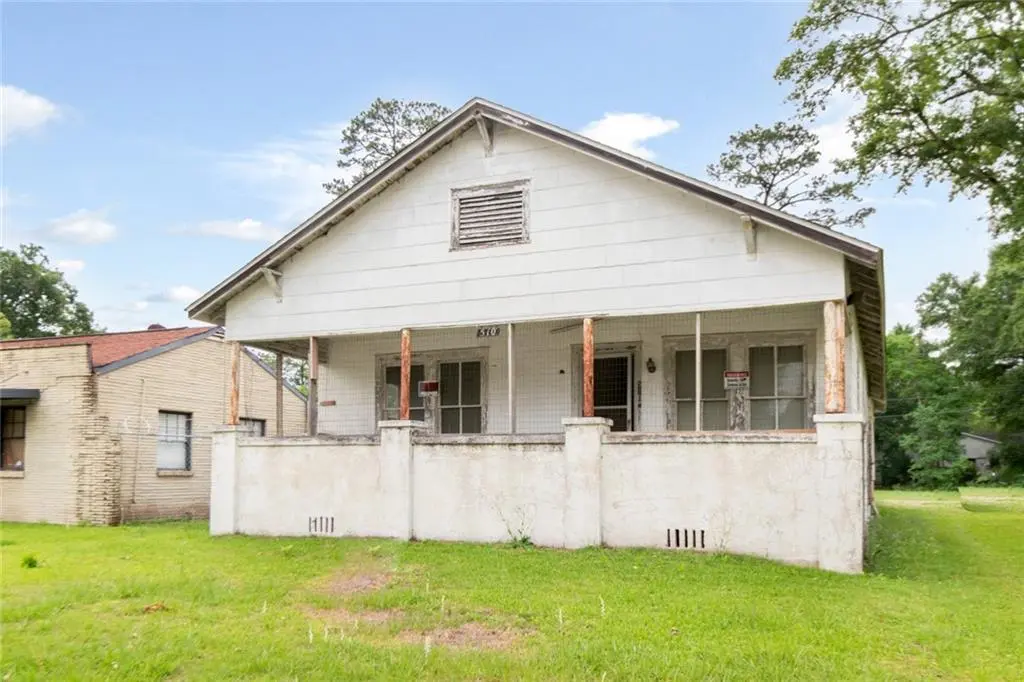
510 Holcombe Ave · Mobile, AL
Flood risk No data
- FEMA flood zone
- —
- Chance of flooding over 30 yrs
- —
- Est. flood insurance / yr
- —
Fire risk No data
- Est. fire insurance / yr
- —
Heat risk No data
- Hot days now (above threshold)
- —
- Hot days in 30 yrs
- —
Wind risk No data
- Chance of severe wind over 30 yrs
- —
Air-quality risk No data
- Unhealthy air days now
- —
- Unhealthy air days in 30 yrs
- —
Risk factors via First Street. Map © Google.
Why this score? — see what drove the C+ grade
The composite is a weighted blend of 9 inputs, each scored 0–100. Each bar is that input's sub-score; the figure is the points it added to the 100-point composite (weight × sub-score).
- Cash flow +30.0/30.0
- DSCR +10.0/10.0
- 1% rule +8.9/10.0
- Rent growth +3.8/5.0
- Livability +3.8/5.0
- Condition / age +2.5/5.0
- Schools +2.3/10.0
- ARV discount +0.0/15.0
- Appreciation +0.0/10.0
$100,000
🖨 Deal sheet 📄 Offer letter ✓ Due diligence
Listing remarks
Live, work, and create — all under one roof! 510 Holcombe offers a rare chance to own a property that supports both your business ambitions and your home lifestyle. Situated in a HUBZone and noted by the seller as B2 zoning, this space is full of possibility. The interior features a welcoming living room, separate dining area, and an eat-in kitchen. Three additional rooms can easily function as bedrooms, offices, or studio space, plus a full bathroom. Need more room to grow? The unfinished bonus area at the back is a blank canvas — perfect for a dedicated business entrance, workshop, or even a future studio apartment. With local lenders offering strong renovation/rehab loan prog
Key facts
- Workshop
- B2 zoning
- Current termite bond
Tags
Property features AI
Finance
- Other: No additional financial or community amenities listed
- Financial info: No financial details to display
- HOA & community: Located in the Bon Air Estates subdivision
Exterior
- Parking: Parking for 4 vehicles; Driveway with level access; On-street parking
- Security: No accessibility or security features listed
- Utilities: Electricity available (110V and 220V); Public sewer; Water available
- Home design: Single family residence; Residential property; View available
- Construction: Built in 1965; Asbestos construction materials; Shingle roof; Pillar/post/pier foundation
- Exterior features: No exterior features listed; No fencing
Interior
- Kitchen: No specific kitchen features listed; Appliances: Other
- Bedrooms: 3 bedrooms
- Flooring: Hardwood flooring; Vinyl flooring
- Bathrooms: 1 full bathroom
- Heating & cooling: Central heating; Central air conditioning
- Interior features: Other interior features; Brick decorative fireplace in the living room
- Laundry & utility: No specific laundry features listed
Neighborhood map
What this means for you Summary
Snapshot
- This is a 3-bed/1.0-bath single-family listed at $100k.
Deal economics
- At list price, monthly cash flow is $506 ($6k/yr) — positive.
- The deal already cash-flows at list — no discount required.
- Meets the 1% rule at list price ($1k rent vs $100k).
- Recommended offer: $97k (3.0% below list) — sets the bar for market timing.
- Cap rate 12.4% vs local median 4.9% in Mobile — top-decile yield for the area; either an underpriced asset or a hidden risk that comps aren't pricing in. Stress-test before assuming the spread holds.
Location & tenants
- Location reads 75/100 on livability (#20 in AL, #4,262 nationally) — a middle-class / working-renter tenant base. Strengths: commute A+, cost of living A+, housing A+; Watch: crime F, employment D-.
- Mobile County (urban): math 15% / reading 39% proficiency, ranked #81 of 129 in AL (top 63%) — low school quality limits family demand, transient renter base, plan for 1-2y turnover; 67% free/reduced lunch — lower-income household profile, screen leases tightly.
- Zoned schools: Leinkauf Elementary School (math 8% / reading 26%, grade F, #499 of 627 statewide, top 80%, 538 students, 91% FRL); Lillie B Williamson High School (math 2% / reading 12%, grade F, #273 of 305 statewide, top 89%, 956 students, 94% FRL) — zoned schools average 93% FRL vs 67% district-wide (26 pts higher); higher-poverty schools than district average — tighter screening recommended.
- Zoned-school proficiency averages 12% at this address vs 27% district-wide (-15 pts) — the specific schools serving this property underperform the Mobile County average; the district grade overstates school quality for this exact location.
- Market conditions: Rents rising fast (+5.1%/yr); 174 active listings in the ZIP; 40 comparable units currently listed for rent nearby; rentals lingering (median 44d on market — plan ~5-8 weeks vacancy on turnover, expect pricing pressure); 52% of comp listings sitting > 30 days — soft ceiling on asking rent; 1,678 units permitted in Mobile County in 2024 (264 in 5+ unit buildings).
- This rent runs 33% of the median local income ($51k/yr) — at the standard rent-burdened threshold; future hikes will face affordability resistance.
Forward outlook
- Local home prices are declining (-3.0%/yr); year-one equity from $691 of loan paydown is wiped out by about $3k of value loss. Plan a longer hold.
- Mobile County population projected to shrink 8% by 2050 — rents likely to lag national; underwrite the cash flow, not the appreciation.
- At projected returns (-3.0% appreciation + 5.1% rent growth), your $28k cash investment doubles in ~6 years — after that, you're playing with house money.
Negotiation context
- It's been on market 34 days — a 3% lower offer ($97k) is reasonable based on typical stale-listing flexibility.
Questions for the listing agent
- It's been on market 34 days. Have you received any prior offers? Is the seller open to a 3% concession, seller financing, or rate buy-down credit?
- Built in 1965 — when were the roof, HVAC, electrical panel, plumbing, and water heater last replaced?
- Is there a deadline driving the sale (1031 exchange, divorce, estate, relocation)? That informs how much negotiation room exists.
- Schools are D-rated, which usually means shorter tenancies and higher turnover. Who's the typical renter profile here, and what's been the actual vacancy rate?
- Crime grade is F in this area — have there been break-ins, vandalism, or insurance claims at this property in the last 3 years? What carrier currently insures it and at what premium?
- What's the average days-on-market for RENTAL listings here right now (not sales)? A rising rental-DOM trend means longer vacancies and softer asking-rent achievability than the comps imply.
- What's the recent tenant-quality profile in this submarket — average credit score on applications, eviction rate, late-payment / NSF rate, and stable-employment percentage? A property-management company in the area should have these aggregated.
- How much new for-sale + rental construction is in the pipeline within 1–3 miles? Heavy new supply typically softens prices + rents 12–24 months out; constrained supply supports both.
Investment metrics
- 1% rule
- 1.39% ✓
- Cap rate
- 12.36%
- Cash-on-cash
- 21.68%
- DSCR
- 1.96
- GRM
- 6.0
CMA / ARV
- ARV (median comp)
- $79,085
- List price
- $100,000
- Delta
- 26.45%
- Verdict
- OVERPRICED
- Comps
- 20 within 1.0 mi
Show comp detail 12 sales within ~0.75 mi
| Address | Dist | Beds/Ba | Sqft | Sold | Price | $/sf | Match |
|---|---|---|---|---|---|---|---|
| 603 Glenwood St | 0.18mi | 3/1.0 | 1,400 (+9%) | 4mo | $137,000 | $98 | 74 |
| 503 Dauphin Island Pkwy | 0.18mi | 2/1.0 (-1) | 1,159 (-10%) | 3mo | $40,500 | $35 | 68 |
| 417 Crenshaw St | 0.16mi | 4/1.0 (+1) | 1,426 (+11%) | 3mo | $48,000 | $34 | 68 |
| 710 Euclid Ave | 0.43mi | 3/2.0 | 1,222 (-5%) | 4mo | $139,000 | $114 | 64 |
| 2258 Howell Ave | 0.67mi | 3/1.0 | 1,264 (-2%) | 2mo | $145,000 | $115 | 64 |
| 1805 Woodcock Pl | 0.52mi | 3/2.0 | 1,233 (-4%) | 4mo | $195,000 | $158 | 62 |
| 258 W Mount Island Dr | 0.59mi | 2/1.0 (-1) | 1,350 (+5%) | 2mo | $263,500 | $195 | 58 |
| 616 Morgan Ave | 0.40mi | 3/2.0 | 1,150 (-11%) | 3mo | $42,000 | $37 | 57 |
| 1809 Calmes St | 0.45mi | 4/2.0 (+1) | 1,420 (+10%) | 0mo | $45,000 | $32 | 53 |
| 210 Houston St | 0.63mi | 2/1.0 (-1) | 1,182 (-8%) | 2mo | $155,000 | $131 | 50 |
| 1017 Houston St | 0.60mi | 3/2.0 | 1,435 (+11%) | 3mo | $24,900 | $17 | 46 |
| 1910 Hunter Ave | 0.55mi | 3/2.5 | 1,462 (+14%) | 4mo | $310,000 | $212 | 43 |
Match score weights: distance 35% · size 25% · config 20% · recency 20%. Top-matched comps best support the ARV.
Projected returns pro-forma
-3.0% appreciation · 5.06% rent growth · sell at horizon
- IRR
- 16.4%
- Equity multiple
- 1.68×
- Total profit
- $18,917
- Equity at exit
- $14,910
- IRR
- 26.3%
- Equity multiple
- 3.51×
- Total profit
- $70,396
- Equity at exit
- $8,646
Cash invested: $28,000 (down + closing). Projections, not guarantees.
Landlord ↔ Tenant lean methodology
- Overall (STATE)
- 90 Strongly Landlord-Friendly
- State Alabama
- 90 Strongly Landlord-Friendly · R+15
- County
- — inherits STATE
- City
- — inherits STATE
ZIP-level market 36606
- Rents YoY
- 5.1%
- Active inventory
- 174
- Price-to-rent
- 6.0×
Monthly cashflow live
- Estimated rent
- $1,391 high interval (Pro) →
- Mortgage (P&I)
- −$524
- Tax from tax record
- −$27 /mo · $327/yr
- Insurance
- −$42
- HOA
- −$0
- Vacancy / Maint / Mgmt
- −$292
- Net cashflow
- $506
Break-even live
UW: 25.0% down · 7.5% · 30yr · 1.5% tax · 5.0% vac · 8.0% maint · 8.0% mgmt
Financing live
Cash to close
- Down payment
- $25,000
- Closing costs
- $3,000
- Reserves months
- —
- Total cash needed
- —
Loan-product check · same deal, 3 products live
Conventional
25% down · 7.5% · 30yr
- Down + closing
- —
- Monthly P&I
- —
- Monthly cashflow
- —
- DSCR
- —
- Eligible?
- —
Personal DTI + credit; lowest rate.
DSCR
20% down · 8.5% · 30yr
- Down + closing
- —
- Monthly P&I
- —
- Monthly cashflow
- —
- DSCR
- —
- Eligible?
- —
No personal income docs; deal must DSCR.
Hard money
10% down · 12.0% · 12mo
- Down + closing
- —
- Monthly P&I
- —
- Monthly cashflow
- —
- DSCR
- —
- Eligible?
- —
Short-term bridge; refi at stabilization.
Rent comps 40 comps
| Address | Beds | Baths | Sqft | Rent | $/sqft | DOM | Units | Dist |
|---|---|---|---|---|---|---|---|---|
| 562 Clarke St Mobile, AL | 2.0 | 1.0 | 1061 | $1,025 | $0.97 | 43d | 1 | 0.11mi |
| 561 Dauphin Island Pkwy Mobile, AL | 4.0 | 2.0 | 1389 | $1,050 | $0.76 | 43d | 1 | 0.20mi |
| 611 Dauphin Island Pkwy Mobile, AL | 3.0 | 2.0 | 1450 | $1,300 | $0.90 | 43d | 1 | 0.25mi |
| 615 Mohawk St Mobile, AL | 3.0 | 1.0 | 1172 | $1,500 | $1.28 | 43d | 1 | 0.25mi |
| 618 Clarke St Mobile, AL | 3.0 | 1.0 | 1427 | $1,200 | $0.84 | 43d | 1 | 0.26mi |
| 706 Cherokee St Mobile, AL | 3.0 | 1.0 | 1260 | $1,375 | $1.09 | 21d | 1 | 0.47mi |
| 209 S Fulton St Mobile, AL | 2.0 | 1.5 | 1255 | $1,750 | $1.39 | 21d | 1 | 0.52mi |
| 182 Williams St Unit 1043570P Mobile, AL | 3.0 | 1.0 | 1399 | $2,476 | $1.77 | 13d | 1 | 0.55mi |
| 2008 W Victory Dr Mobile, AL | 3.0 | 1.0 | 1011 | $1,200 | $1.19 | 43d | 1 | 0.63mi |
| 713 Iris Ave Mobile, AL | 3.0 | 1.0 | 1617 | $1,300 | $0.80 | 21d | 1 | 0.69mi |
| 122 Demouy Ave Unit 1/2 Mobile, AL | 2.0 | 1.0 | 1300 | $1,530 | $1.18 | 43d | 1 | 0.72mi |
| 2068 Victory Ct Mobile, AL | 4.0 | 1.0 | 1259 | $1,225 | $0.97 | 43d | 1 | 0.73mi |
| 2503 Richard Ave Mobile, AL | 2.0 | 1.0 | 928 | $805 | $0.87 | 13d | 1 | 0.78mi |
| 817 Hawkins St Mobile, AL | 3.0 | 1.0 | 1217 | $1,200 | $0.99 | 43d | 1 | 0.79mi |
| 2507 Taylor Ave Mobile, AL | 3.0 | 1.0 | 1230 | $1,495 | $1.22 | 13d | 1 | 0.84mi |
| 104 Ellinor St Mobile, AL | 2.0 | 1.0 | 896 | $1,275 | $1.42 | 21d | 1 | 0.85mi |
| 2656 Pathway Pl Mobile, AL | 2.0–3.0 | 1.0 | 778 | $1,261 | $1.62 | 13d | 9 | 0.87mi |
| 200 S Florida St Unit 101 Mobile, AL | 2.0 | 2.0 | 1150 | $1,375 | $1.20 | 21d | 1 | 0.91mi |
| 900 Courtney St Mobile, AL | 2.0 | 1.0 | 1020 | $1,200 | $1.18 | 43d | 1 | 0.92mi |
| 418 Durande Dr Mobile, AL | 3.0 | 2.0 | 1456 | $1,350 | $0.93 | 13d | 1 | 0.94mi |
| 1660 Laurel St Mobile, AL | 3.0 | 2.0 | 1768 | $2,200 | $1.24 | 13d | 1 | 0.98mi |
| 1704 McGill Ave Unit B Mobile, AL | 3.0 | 2.5 | 1500 | $1,750 | $1.17 | 43d | 1 | 1.09mi |
| 107 Macy Pl Mobile, AL | 3.0 | 2.0 | 1800 | $2,250 | $1.25 | 43d | 1 | 1.15mi |
| 955 Cloverdale Dr Mobile, AL | 3.0 | 1.5 | 1128 | $1,125 | $1.00 | 43d | 1 | 1.19mi |
| 461 Magnolia Rd Unit A Mobile, AL | 2.0 | 1.0 | 989 | $825 | $0.83 | 43d | 1 | 1.20mi |
| 315 Hadrian St Mobile, AL | 3.0 | 2.0 | 1843 | $1,800 | $0.98 | 43d | 1 | 1.23mi |
| 111 S Catherine St Mobile, AL | 2.0 | 1.0 | 891 | $899 | $1.01 | 43d | 1 | 1.27mi |
| 84 S Lafayette St Unit 1043577P Mobile, AL | 3.0 | 2.0 | 1496 | $3,116 | $2.08 | 13d | 1 | 1.28mi |
| 168 W Collins St Mobile, AL | 3.0 | 1.0 | 968 | $725 | $0.75 | 21d | 1 | 1.30mi |
| 1417 Monroe St Mobile, AL | 2.0 | 1.0 | 1064 | $1,350 | $1.27 | 43d | 1 | 1.30mi |
| 107 Grand Blvd Mobile, AL | 2.0 | 2.0 | 1200 | $1,295 | $1.08 | 21d | 1 | 1.31mi |
| 129 Shell Road Pl Unit 1043713P Mobile, AL | 4.0 | 2.0 | 1496 | $3,389 | $2.27 | 21d | 1 | 1.32mi |
| 2604 Dauphin St Mobile, AL | 2.0 | 1.0 | 950 | $1,072 | $1.13 | 43d | 2 | 1.35mi |
| 2604 Dauphin St #210 Mobile, AL | 2.0 | 1.0 | 950 | $1,150 | $1.21 | 21d | 1 | 1.35mi |
| 2859 Brierwood Dr Mobile, AL | 3.0 | 1.0 | 1057 | $1,500 | $1.42 | 13d | 1 | 1.35mi |
| 1566 Dauphin St Unit Back Carriage House Mobile, AL | 3.0 | 1.0 | 1300 | $1,200 | $0.92 | 43d | 1 | 1.39mi |
| 150 Dunn Ave Mobile, AL | 3.0 | 2.0 | 1455 | $1,250 | $0.86 | 21d | 1 | 1.42mi |
| 2861 Ralston Rd Mobile, AL | 3.0 | 2.0 | 1617 | $1,650 | $1.02 | 43d | 1 | 1.42mi |
| 2855 Potter Dr Mobile, AL | 2.0 | 1.0 | 1127 | $1,050 | $0.93 | 43d | 1 | 1.42mi |
| 2500 Dauphinwood Dr Mobile, AL | 2.0–3.0 | 1.0–2.0 | 1250 | $1,395 | $1.12 | 13d | 19 | 1.44mi |
Listing history 17 events
-
2026-06-18days on market $100,000 Active 34 DOM
-
2026-06-17days on market $100,000 Active 33 DOM
-
2026-06-16days on market $100,000 Active 32 DOM
-
2026-06-15days on market $100,000 Active 31 DOM
-
2026-06-14days on market $100,000 Active 29 DOM
-
2026-06-13days on market $100,000 Active 28 DOM
-
2026-06-10days on market $100,000 Active 26 DOM
-
2026-06-09days on market $100,000 Active 25 DOM
-
2026-06-08days on market $100,000 Active 24 DOM
-
2026-06-07days on market $100,000 Active 23 DOM
-
2026-06-05days on market $100,000 Active 20 DOM
-
2026-06-03days on market $100,000 Active 19 DOM
-
2026-06-02days on market $100,000 Active 18 DOM
-
2026-06-01days on market $100,000 Active 17 DOM
-
2026-05-31days on market $100,000 Active 16 DOM
-
2026-05-30days on market $100,000 Active 15 DOM
-
2026-05-15$89,000 Active 967-char remark
ⓘ Source: listings_history table (triggers on properties + properties_extension) + one-shot
backfill from property_details.listing_events for pre-trigger history.
Tax reassessment forecast AL · Resets to sale price
- Current annual tax
- $327 · $27/mo
- Projected year-2 tax
- $410 · $34/mo
- Expected delta
- +$83/yr (+$7/mo · 25.4%)
ⓘ Screening estimate from a state-policy table — verify with the county assessor before closing.
Nearby sold comps map
Loading sold comps map…
Walkable amenities ~0.75 mi
Loading nearby amenities…
Taxation est. · year 1
- Rental income
- $16,696
- − Mortgage interest
- −$5,602
- − Property taxes
- −$327
- − Insurance
- −$500
- − Repairs & maintenance
- −$1,336
- − Management
- −$1,336
- − Depreciation
- −$2,909
- Taxable income
- $4,687
- Est. tax owed @ 24.0%
- −$1,125
- After-tax cash flow
- $4,945/yr
For passive investors: Depreciation is non-cash, so a rental often shows a tax loss while cash-flowing — sheltering income. Rental losses are passive: they offset passive income freely, and up to $25,000/yr can offset ordinary (W-2) income if you actively participate and your MAGI is under $100k (phasing out to $0 by $150k); unused losses carry forward. On sale, claimed depreciation is recaptured at up to 25%, and gains may owe capital-gains tax (a 1031 exchange can defer both). Figures are a year-1 estimate at your 24.0% rate — not tax advice; consult a CPA.
Schools (NCES district)
- District
- Mobile County
- NCES district ID
- 0102370
- Math proficiency
- 15% ▼ -28.00%
- Reading proficiency
- 39% ▬ 0.00%
- Median HH income
- $42,455
- Composite
- 22.9/100
- National rank
- #8002
- State rank
- #81 of 129 in AL
Livability — Mobile
- Score
- 75/100
- State rank
- #20
- US rank
- #4262
Category grades
Schools grade is shown separately in the Schools card above.
Census & demographics
- Census place
- Mobile, AL
- County
- Mobile County · 246,577 people
- City population
- 205,729
- Metro
- Mobile, AL
- Population (ZIP)
- 18,728
- Household income
- $51,303
- Rent vs Own
- Severe rent burden
- 999.0
Population outlook (Mobile County) Hauer SSP2
- Today (2025)
- 415,303 people
- By 2030
- 411,755 · -0.9%
- By 2040
- 399,670 · -3.8%
- By 2050
- 382,616 · -7.9%
- By 2075
- 337,353 · -18.8%
- By 2100
- 283,391 · -31.8%
Race, ethnicity, and origin ACS 2023
- Neighborhood character
- Majority Black (56%)
- Race & ethnicity
- Black 56% White 37% Two or more races 5% Hispanic / Latino 4%
- Common ancestry
- Italian 2% Scottish 2% Lithuanian 1%
- Foreign-born
- 3% · Canada
- Languages at home
- 96% English-only · Spanish 3%
Political lean MEDSL · Mobile
- 2024 margin
- R (+16.4) · D 41.3% · R 57.7%
- 2008→2024 swing
- -7.7pp toward R · 2008: -8.7pp · 2024: -16.4pp
- All cycles
- 2024: R+16.4 2020: R+11.9 2016: R+13.9 2012: R+9.3 2008: R+8.7
Not yet ingested
- Civics
- —
Market trends
- HPI YoY
- ▼ -232.19%
- Current HPI
- 145.9025
- Rent YoY
- ▲ 5.06%
- Metro
- Mobile, AL
- State GDP YoY
- ▲ 2.94%
- F500 in state
- 4
Industry mix (Fortune 500 HQ in AL)
| Industry | F500 HQs | Revenue |
|---|---|---|
| Financial Services | 1 | $8B |
|
||
| Healthcare | 1 | $5B |
|
||
Price history
+12.4% since first listed2 events — show timeline
- 2026-05-26 Price Changed $100,000 GCMLS AL
- 2026-05-15 Listed $89,000 GCMLS AL
Property tax history
+1.8%/yrLatest (2018): $327 · +0.0% YoY. Source: county tax records.
Cash-flow waterfall
monthlySold comps — $/sqft
last 12 mo · ≤1 miLoading sold comps…