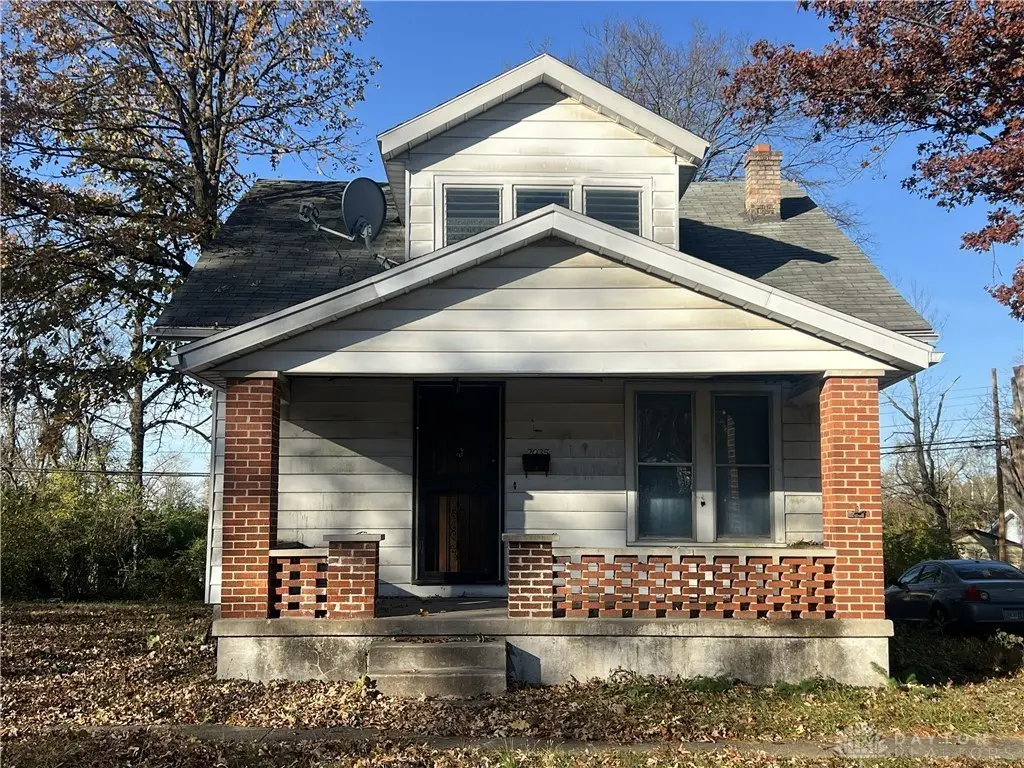
2035 Wesleyan Rd · Dayton, OH
Flood risk 1/10 · Minimal
- FEMA flood zone
- X (unshaded)
- Chance of flooding over 30 yrs
- 0.0%
- Est. flood insurance / yr
- $473 – $860
Fire risk 1/10 · Minimal
- Est. fire insurance / yr
- $713 – $1,323
Heat risk 3/10 · Minor
- Hot days now (above 103°F)
- 7 days/yr
- Hot days in 30 yrs
- 18 days/yr
Wind risk 2/10 · Minimal
- Chance of severe wind over 30 yrs
- 0.0%
Air-quality risk 3/10 · Minor
- Unhealthy air days now
- 2 days/yr
- Unhealthy air days in 30 yrs
- 4 days/yr
Risk factors via First Street. Map © Google.
Why this score? — see what drove the B- grade
The composite is a weighted blend of 9 inputs, each scored 0–100. Each bar is that input's sub-score; the figure is the points it added to the 100-point composite (weight × sub-score).
- Cash flow +30.0/30.0
- 1% rule +10.0/10.0
- DSCR +10.0/10.0
- ARV discount +7.5/15.0
- Rent growth +3.3/5.0
- Livability +3.2/5.0
- Condition / age +2.5/5.0
- Schools +1.3/10.0
- Appreciation +0.0/10.0
$35,000
🖨 Deal sheet (PDF) 📄 Offer letter ✓ Due diligence
Listing remarks MLS
Welcome to 2035 Wesleyan Rd. Dayton, OH 45406 a solid 3-bedroom, 2-bath Cape Cod offering great potential for investors or savvy buyers looking to build equity. This property features a classic layout and a full basement for storage or future finishing. With some updates and vision, this home can shine again. Conveniently located near schools, parks, and local amenities, this is a strong opportunity to add value to your portfolio.
Key facts
- Near schools
- Full basement
- Near parks
Tags
Neighborhood map
What this means for you Summary
Snapshot
- This is a 4-bed/1.0-bath single-family listed at $35k.
Deal economics
- At list price, monthly cash flow is $699 ($8k/yr) — positive.
- The deal already cash-flows at list — no discount required.
- Meets the 1% rule at list price ($1k rent vs $35k).
- Recommended offer: $31k (12.0% below list) — sets the bar for market timing.
- Cap rate 30.3% vs local median 7.4% in Dayton — top-decile yield for the area; either an underpriced asset or a hidden risk that comps aren't pricing in. Stress-test before assuming the spread holds.
Location & tenants
- Location reads 65/100 on livability (#716 in OH) — a middle-class / working-renter tenant base. Strengths: cost of living A+, housing A+, health & safety A; Watch: schools C-, amenities C-, crime F.
- Dayton City (urban): math 12% / reading 21% proficiency, ranked #641 of 656 in OH (top 98%) — low school quality limits family demand, transient renter base, plan for 1-2y turnover; 74% free/reduced lunch — lower-income household profile, screen leases tightly.
- Market conditions: Rents rising (+3.0%/yr); 156 active listings in the ZIP; 20 comparable units currently listed for rent nearby; rentals at typical pace (median 22d on market — plan ~3-4 weeks tenant-placement turnaround); 40% of comp listings sitting > 30 days — soft ceiling on asking rent; lower-income renter base — watch delinquency; 907 units permitted in Montgomery County in 2024 (416 in 5+ unit buildings).
- This rent runs 36% of the median local income ($42k/yr) — at the standard rent-burdened threshold; future hikes will face affordability resistance.
Forward outlook
- Local home prices are declining (-3.0%/yr); year-one equity from $242 of loan paydown is wiped out by about $1k of value loss. Plan a longer hold.
- Montgomery County population projected at -10% by 2050 — secular population decline; favor cash flow + early exit over multi-decade hold.
- At projected returns (-3.0% appreciation + 3.0% rent growth), your $10k cash investment doubles in ~2 years — after that, you're playing with house money.
Negotiation context
- It's been on market 147 days — a 12% lower offer ($31k) is reasonable based on typical stale-listing flexibility.
- 3 sale attempts since 14y ago; this cycle's ask has dropped $13k (27%) from the opening price — seller is motivated, your offer sets the floor, not the list.
Risks & watch-outs
- Watch-outs: property tax is 3.6% of price; built in 1930 — expect roof / HVAC / electrical / plumbing capex.
Questions for the listing agent
- It's been on market 147 days. Have you received any prior offers? Is the seller open to a 12% concession, seller financing, or rate buy-down credit?
- Built in 1930 — when were the roof, HVAC, electrical panel, plumbing, and water heater last replaced?
- Property tax is high relative to price — has the assessment been appealed recently, and will the sale trigger a re-assessment?
- Why hasn't it sold? Are there any deal-killer items the seller is aware of (foundation, flood, title, zoning, code violations)?
- Is there a deadline driving the sale (1031 exchange, divorce, estate, relocation)? That informs how much negotiation room exists.
- Crime grade is F in this area — have there been break-ins, vandalism, or insurance claims at this property in the last 3 years? What carrier currently insures it and at what premium?
- What's the average days-on-market for RENTAL listings here right now (not sales)? A rising rental-DOM trend means longer vacancies and softer asking-rent achievability than the comps imply.
- What's the recent tenant-quality profile in this submarket — average credit score on applications, eviction rate, late-payment / NSF rate, and stable-employment percentage? A property-management company in the area should have these aggregated.
- How much new for-sale + rental construction is in the pipeline within 1–3 miles? Heavy new supply typically softens prices + rents 12–24 months out; constrained supply supports both.
Investment metrics
- 1% rule
- 3.62% ✓
- Cap rate
- 30.27%
- Cash-on-cash
- 85.65%
- DSCR
- 4.81
- GRM
- 2.3
CMA / ARV
- ARV (median comp)
- $74,063
- List price
- $35,000
- Delta
- -52.74%
- Verdict
- UNDERPRICED
- Comps
- 20 within 1.0 mi
Show comp detail 12 sales within ~0.75 mi
| Address | Dist | Beds/Ba | Sqft | Sold | Price | $/sf | Match |
|---|---|---|---|---|---|---|---|
| 4076 Prescott Ave | 0.39mi | 4/1.0 | 1,129 (-8%) | 6mo | $65,000 | $58 | 64 |
| 2247 Esmeralda Ave | 0.42mi | 4/1.0 | 1,406 (+15%) | 2mo | $68,000 | $48 | 54 |
| 1680 Wesleyan Rd | 0.51mi | 3/1.0 (-1) | 1,114 (-9%) | 5mo | $110,000 | $99 | 52 |
| 3231 Harvard Blvd | 0.48mi | 3/1.0 (-1) | 1,383 (+13%) | 2mo | $130,000 | $94 | 49 |
| 1579 Sundale Ave | 0.50mi | 3/1.5 (-1) | 1,109 (-9%) | 7mo | $48,000 | $43 | 48 |
| 1656 Tennyson Ave | 0.63mi | 3/1.5 (-1) | 1,290 (+5%) | 8mo | $160,000 | $124 | 48 |
| 3108 Campus Dr | 0.71mi | 3/1.5 (-1) | 1,176 (-4%) | 7mo | $155,000 | $132 | 48 |
| 2504 Grant Ave | 0.62mi | 4/1.0 | 1,056 (-14%) | 1mo | $95,000 | $90 | 47 |
| 2822 W Hillcrest Ave | 0.48mi | 3/1.5 (-1) | 1,056 (-14%) | 2mo | $135,400 | $128 | 46 |
| 1034 Bertram Ave | 0.62mi | 3/3.0 (-1) | 1,326 (+8%) | 2mo | $178,000 | $134 | 43 |
| 1641 Kipling Dr | 0.61mi | 3/2.0 (-1) | 1,114 (-9%) | 7mo | $144,500 | $130 | 42 |
| 2451 Grant Ave | 0.63mi | 3/1.0 (-1) | 1,056 (-14%) | 3mo | $75,000 | $71 | 41 |
Match score weights: distance 35% · size 25% · config 20% · recency 20%. Top-matched comps best support the ARV.
Projected returns pro-forma
-3.0% appreciation · 3.03% rent growth · sell at horizon
- IRR
- 86.2%
- Equity multiple
- 4.98×
- Total profit
- $38,971
- Equity at exit
- $5,219
- IRR
- 89.3%
- Equity multiple
- 10.36×
- Total profit
- $91,685
- Equity at exit
- $3,026
Cash invested: $9,800 (down + closing). Projections, not guarantees.
Landlord ↔ Tenant lean methodology
- Overall (STATE)
- 73 Landlord-Friendly
- State Ohio
- 73 Landlord-Friendly · R+6
- County
- — inherits STATE
- City
- — inherits STATE
ZIP-level market 45406
- Rents YoY
- 3.0%
- Active inventory
- 156
- Price-to-rent
- 2.3×
Monthly cashflow live
- Estimated rent
- $1,268 high interval (Pro) →
- Mortgage (P&I)
- −$184
- Tax from tax record
- −$104 /mo · $1,254/yr
- Insurance
- −$15
- HOA
- −$0
- Vacancy / Maint / Mgmt
- −$266
- Net cashflow
- $699
Break-even live
Sensitivity live
| Price | -10% $719 | -5% $709 | +0% $699 | +5% $690 | +10% $680 |
|---|---|---|---|---|---|
| Rent | -10% $599 | -5% $649 | +0% $699 | +5% $750 | +10% $800 |
| Rate | -1.0pp $717 | -0.5pp $708 | base $699 | +0.5pp $690 | +1.0pp $681 |
UW: 25.0% down · 7.5% · 30yr · 1.5% tax · 5.0% vac · 8.0% maint · 8.0% mgmt
Financing live
Cash to close
- Down payment
- $8,750
- Closing costs
- $1,050
- Reserves months
- —
- Total cash needed
- —
Loan-product check · same deal, 3 products live
Conventional
25% down · 7.5% · 30yr
- Down + closing
- —
- Monthly P&I
- —
- Monthly cashflow
- —
- DSCR
- —
- Eligible?
- —
Personal DTI + credit; lowest rate.
DSCR
20% down · 8.5% · 30yr
- Down + closing
- —
- Monthly P&I
- —
- Monthly cashflow
- —
- DSCR
- —
- Eligible?
- —
No personal income docs; deal must DSCR.
Hard money
10% down · 12.0% · 12mo
- Down + closing
- —
- Monthly P&I
- —
- Monthly cashflow
- —
- DSCR
- —
- Eligible?
- —
Short-term bridge; refi at stabilization.
Rent comps 20 comps
| Address | Beds | Baths | Sqft | Rent | $/sqft | DOM | Units | Dist |
|---|---|---|---|---|---|---|---|---|
| 3311 Otterbein Ave Dayton, OH | 3.0 | 1.5 | 1004 | $1,300 | $1.29 | 11d | 1 | 0.34mi |
| 2609 Fairport Ave Dayton, OH | 3.0 | 1.0 | 1000 | $1,025 | $1.02 | 3d | 1 | 0.53mi |
| 3207 Cornell Dr Dayton, OH | 3.0 | 1.0 | 1168 | $1,000 | $0.86 | 3d | 1 | 0.67mi |
| 4446 Waymire Ave Dayton, OH | 3.0 | 1.0 | 1100 | $1,100 | $1.00 | 21d | 1 | 0.68mi |
| 1927 Burroughs Dr Dayton, OH | 3.0 | 2.0 | 1409 | $1,245 | $0.88 | 14d | 1 | 0.68mi |
| 2247 Salem Ave Unit 2249 Dayton, OH | 3.0 | 1.5 | 1300 | $1,400 | $1.08 | 44d | 1 | 0.82mi |
| 2247 Salem Ave Unit 2247 Dayton, OH | 3.0 | 1.5 | 1300 | $1,350 | $1.04 | 3d | 1 | 0.82mi |
| 2232 Salem Ave Dayton, OH | 3.0 | 1.0 | 1250 | $1,200 | $0.96 | 3d | 1 | 0.83mi |
| 3220 Princeton Dr Dayton, OH | 3.0 | 1.0 | 900 | $1,000 | $1.11 | 44d | 1 | 0.94mi |
| 1019 Cherry Dr Dayton, OH | 4.0 | 1.0 | 1057 | $1,125 | $1.06 | 44d | 1 | 0.95mi |
| 2002 Val Vista Ct Dayton, OH | 3.0 | 1.0 | 975 | $1,095 | $1.12 | 21d | 1 | 1.08mi |
| 1816 N James H McGee Blvd Unit C Dayton, OH | 3.0 | 1.0 | 950 | $1,150 | $1.21 | 3d | 1 | 1.19mi |
| 1816 N James H McGee Blvd Apt B Dayton, OH | 3.0 | 1.0 | 950 | $1,150 | $1.21 | 44d | 1 | 1.19mi |
| 1816 N James H McGee Blvd Apt A Dayton, OH | 3.0 | 1.0 | 950 | $1,200 | $1.26 | 3d | 1 | 1.19mi |
| 5112 W Hillcrest Ave Unit 1 Dayton, OH | 3.0 | 1.0 | 972 | $700 | $0.72 | 24d | 1 | 1.25mi |
| 439 W Fairview Ave Dayton, OH | 3.0 | 1.0 | 1500 | $1,200 | $0.80 | 44d | 1 | 1.28mi |
| 1045 Shakespeare Ave Dayton, OH | 3.0 | 1.0 | 1435 | $1,275 | $0.89 | 44d | 1 | 1.30mi |
| 660 Gramont Ave Dayton, OH | 3.0 | 1.0 | 1142 | $1,050 | $0.92 | 3d | 1 | 1.46mi |
| 201 W Norman Ave Dayton, OH | 3.0 | 1.0 | 1424 | $1,200 | $0.84 | 44d | 1 | 1.46mi |
| 181 W Norman Ave Dayton, OH | 3.0 | 2.0 | 1228 | $1,150 | $0.94 | 44d | 1 | 1.49mi |
Listing history 9 events
-
2026-05-06status Pending 434-char remark
Show marketing remark (434 chars)
Welcome to 2035 Wesleyan Rd. Dayton, OH 45406 a solid 3-bedroom, 2-bath Cape Cod offering great potential for investors or savvy buyers looking to build equity. This property features a classic layout and a full basement for storage or future finishing. With some updates and vision, this home can shine again. Conveniently located near schools, parks, and local amenities, this is a strong opportunity to add value to your portfolio.
-
2026-03-16price $35,000 434-char remark
Show marketing remark (434 chars)
Welcome to 2035 Wesleyan Rd. Dayton, OH 45406 a solid 3-bedroom, 2-bath Cape Cod offering great potential for investors or savvy buyers looking to build equity. This property features a classic layout and a full basement for storage or future finishing. With some updates and vision, this home can shine again. Conveniently located near schools, parks, and local amenities, this is a strong opportunity to add value to your portfolio.
-
2026-02-02price $39,900 434-char remark
Show marketing remark (434 chars)
Welcome to 2035 Wesleyan Rd. Dayton, OH 45406 a solid 3-bedroom, 2-bath Cape Cod offering great potential for investors or savvy buyers looking to build equity. This property features a classic layout and a full basement for storage or future finishing. With some updates and vision, this home can shine again. Conveniently located near schools, parks, and local amenities, this is a strong opportunity to add value to your portfolio.
-
2025-12-10$48,000 Active 434-char remark
Show marketing remark (434 chars)
Welcome to 2035 Wesleyan Rd. Dayton, OH 45406 a solid 3-bedroom, 2-bath Cape Cod offering great potential for investors or savvy buyers looking to build equity. This property features a classic layout and a full basement for storage or future finishing. With some updates and vision, this home can shine again. Conveniently located near schools, parks, and local amenities, this is a strong opportunity to add value to your portfolio.
-
2013-12-30historical
-
2013-08-14$17,900
-
2012-11-26historical
-
2012-08-07$17,900
-
2006-12-05soldstatus $32,000
ⓘ Source: listings_history table (triggers on properties + properties_extension) + one-shot
backfill from property_details.listing_events for pre-trigger history.
Tax reassessment forecast OH · Partial reset (capped growth)
- Current annual tax
- $1,254 · $104/mo
- Projected year-2 tax
- $1,254 · $104/mo
- Expected delta
- $0/yr ($0/mo · 0.0%)
ⓘ Screening estimate from a state-policy table — verify with the county assessor before closing.
Climate risk First Street
- Flood 1/10 Low FEMA zone X (unshaded) · 0% chance over 30 yrs
- Wildfire 1/10 Low
- Heat 3/10 Moderate 7 d/yr ≥103°F today · 18 d/yr by 30 yrs out
- Wind 2/10 Low 0% chance of damaging wind over 30 yrs
- Air quality 3/10 Moderate 2 unhealthy d/yr today · 4 by 30 yrs out
Nearby sold comps map
Loading sold comps map…
Walkable amenities ~0.75 mi
Loading nearby amenities…
Taxation est. · year 1
- Rental income
- $15,221
- − Mortgage interest
- −$1,961
- − Property taxes
- −$1,254
- − Insurance
- −$175
- − Repairs & maintenance
- −$1,218
- − Management
- −$1,218
- − Depreciation
- −$1,018
- Taxable income
- $8,378
- Est. tax owed @ 24.0%
- −$2,011
- After-tax cash flow
- $6,383/yr
For passive investors: Depreciation is non-cash, so a rental often shows a tax loss while cash-flowing — sheltering income. Rental losses are passive: they offset passive income freely, and up to $25,000/yr can offset ordinary (W-2) income if you actively participate and your MAGI is under $100k (phasing out to $0 by $150k); unused losses carry forward. On sale, claimed depreciation is recaptured at up to 25%, and gains may owe capital-gains tax (a 1031 exchange can defer both). Figures are a year-1 estimate at your 24.0% rate — not tax advice; consult a CPA.
Schools (NCES district)
- District
- Dayton City
- NCES district ID
- 3904384
- Math proficiency
- 12% ▼ -12.00%
- Reading proficiency
- 21% ▼ -11.00%
- Median HH income
- $28,688
- Composite
- 12.94/100
- National rank
- #9579
- State rank
- #641 of 656 in OH
Livability — Dayton
- Score
- 65/100
- State rank
- #716
- US rank
- #12895
Category grades
Schools grade is shown separately in the Schools card above.
Census & demographics
- Census place
- Dayton, OH
- County
- Montgomery County · 459,541 people
- City population
- 164,387
- Metro
- Dayton-Kettering, OH
- Population (ZIP)
- 19,991
- Household income
- $41,796
- Rent vs Own
- Severe rent burden
- 1504.0
Population outlook (Montgomery County) Hauer SSP2
- Today (2025)
- 523,241 people
- By 2030
- 514,948 · -1.6%
- By 2040
- 493,378 · -5.7%
- By 2050
- 469,639 · -10.2%
- By 2075
- 418,360 · -20.0%
- By 2100
- 353,315 · -32.5%
Race, ethnicity, and origin ACS 2023
- Neighborhood character
- Predominantly Black (75%)
- Race & ethnicity
- Black 75% White 16% Two or more races 7% Hispanic / Latino 3%
- Common ancestry
- Italian 2% Lithuanian 1% Slovak 1%
- Foreign-born
- 2% · Canada
- Languages at home
- 97% English-only · Spanish 1%
Political lean MEDSL · Montgomery
- 2024 margin
- Toss-up / Even · D 49.8% · R 49.3%
- 2008→2024 swing
- -5.8pp toward R · 2008: 6.2pp · 2024: 0.5pp
- All cycles
- 2024: D+0.5 2020: D+2.2 2016: R+1.2 2012: D+3.1 2008: D+6.2
Not yet ingested
- Civics
- —
Market trends
- HPI YoY
- ▼ -113.75%
- Current HPI
- 197.1302
- Rent YoY
- ▲ 3.03%
- Metro
- Dayton-Kettering, OH
- State GDP YoY
- ▲ 1.98%
- F500 in state
- 48
Industry mix (Fortune 500 HQ in OH)
| Industry | F500 HQs | Revenue |
|---|---|---|
| Insurance | 3 | $145B |
|
||
| Industrial Machinery | 3 | $49B |
|
||
| Financial Services | 3 | $24B |
|
||
| Consumer Goods | 2 | $93B |
|
||
| Aerospace / Defense | 2 | $47B |
|
||
| Utilities | 2 | $33B |
|
||
Price history
+9.4% since first listed9 events — show timeline
- 2026-05-06 Pending — Dayton MLS
- 2026-03-16 Price Changed $35,000 Dayton MLS
- 2026-02-02 Price Changed $39,900 Dayton MLS
- 2025-12-10 Listed $48,000 Dayton MLS
- 2013-12-30 Listing Removed — Dayton MLS
- 2013-08-14 Listed $17,900 Dayton MLS
- 2012-11-26 Listing Removed — Dayton MLS
- 2012-08-07 Listed $17,900 Dayton MLS
- 2006-12-05 Sold (Public Records) $32,000 Public Records
Property tax history
-3.3%/yrLatest (2025): $1,254 · -0.0% YoY. Source: county tax records.
Cash-flow waterfall
monthlySold comps — $/sqft
last 12 mo · ≤1 miLoading sold comps…