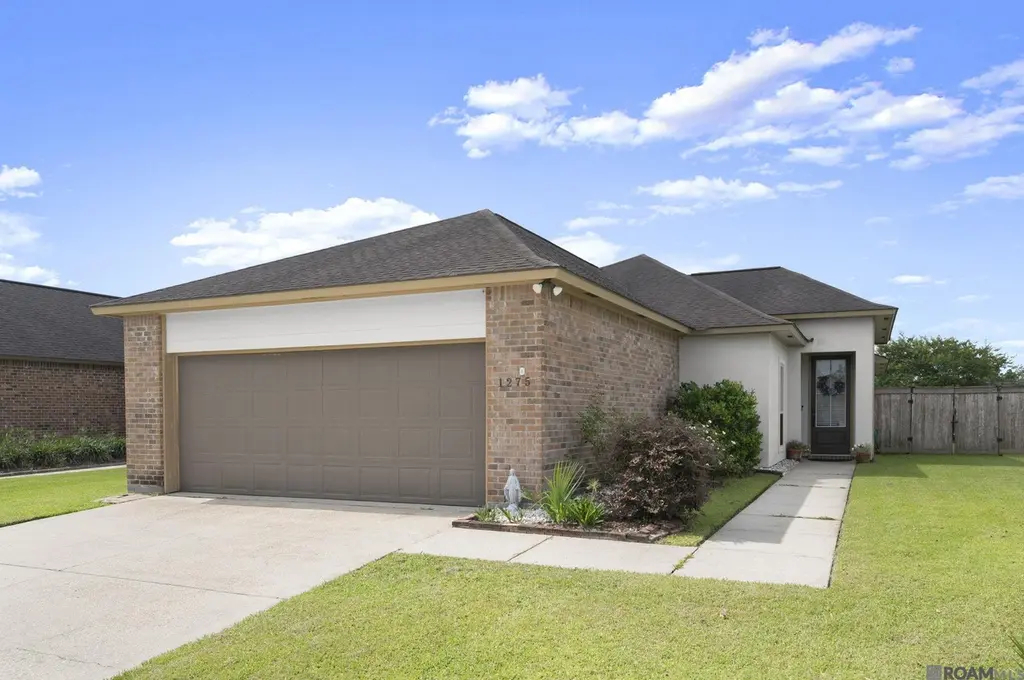
1275 Madrid Ave · St. Gabriel, LA
Flood risk 1/10 · Minimal
- FEMA flood zone
- X
- Chance of flooding over 30 yrs
- 0.0%
- Est. flood insurance / yr
- $507 – $1,088
Fire risk 1/10 · Minimal
- Est. fire insurance / yr
- $1,269 – $2,357
Heat risk 8/10 · Major
- Hot days now (above 108°F)
- 7 days/yr
- Hot days in 30 yrs
- 22 days/yr
Wind risk 9/10 · Severe
- Chance of severe wind over 30 yrs
- 99.0%
Air-quality risk 2/10 · Minimal
- Unhealthy air days now
- 1 days/yr
- Unhealthy air days in 30 yrs
- 2 days/yr
Risk factors via First Street. Map © Google.
Why this score? — see what drove the D grade
The composite is a weighted blend of 9 inputs, each scored 0–100. Each bar is that input's sub-score; the figure is the points it added to the 100-point composite (weight × sub-score).
- Cash flow +11.7/30.0
- ARV discount +7.7/15.0
- Appreciation +5.8/10.0
- DSCR +3.4/10.0
- 1% rule +3.0/10.0
- Rent growth +2.5/5.0
- Livability +2.5/5.0
- Condition / age +2.5/5.0
- Schools +2.4/10.0
$295,000
🖨 Deal sheet (PDF) 📄 Offer letter ✓ Due diligence
Listing remarks MLS
Welcome home to this beautifully maintained waterfront retreat in the gated community of Spanish Lakes in St. Gabriel. Perfectly positioned on a scenic lake lot, this 3-bedroom, 2-bath home combines comfort, functionality, and stunning views with convenient access to Baton Rouge, LSU, and Prairieville. Step inside to an inviting open-concept layout where the living room, dining area, and kitchen seamlessly flow together, creating the ideal space for everyday living and entertaining. Rich wood flooring adds warmth and character throughout the main living areas, while the upgraded kitchen impresses with granite countertops, stainless steel appliances, abundant cabinetry, and generous prep space for the home chef. Need extra flexibility? The bright sunroom just off the kitchen offers endless possibilities and can be closed off with charming sliding barn doors, making it perfect for a home office, playroom, homeschool space, or private retreat. An additional built-in workspace in the hallway provides even more room to stay organized and productive. The spacious primary suite offers a relaxing escape with a walk-in closet, dual vanities, soaking tub, and separate shower. Two additional bedrooms and a full bath provide comfortable accommodations for family and guests. Outside, you'll love unwinding on the covered patio while taking in peaceful lake views and enjoying the privacy of the fenced backyard. With ample storage throughout the home and garage, plus move-in-ready condition, this property checks all the boxes. If you've been searching for a waterfront home with space, versatility, and a prime location, this is one you won't want to miss. Schedule your private showing today!
Key facts
- Gated community
- Rich wood flooring
- Upgraded kitchen
Tags
Property features AI
Finance
- Other: Located in the Spanish Lakes subdivision
- HOA & community: Homeowners association with $400 annual fee (approx. $33.33/month)
Exterior
- Parking: 2 parking spaces; Garage with garage door opener
- Security: Smoke detector(s)
- Utilities: Public water; Public sewer; Cable connected
- Home design: Single family residence (detached); Residential property
- Construction: Built with vinyl siding, frame, and brick; Slab foundation
- Exterior features: Patio; Wood and wrought iron fencing
Interior
- Kitchen: Electric cooktop; Dishwasher; Disposal; Microwave
- Flooring: Tile; Wood; Carpet; Ceramic tile
- Bathrooms: 2 full bathrooms
- Heating & cooling: Central heating; Central air; Ceiling fans
- Interior features: Crown molding; High ceilings; Lighting
- Laundry & utility: Laundry room inside
Neighborhood map
What this means for you Summary
Snapshot
- This is a 3-bed/2.0-bath single-family listed at $295k.
Deal economics
- At list price, monthly cash flow is $-89 ($-1k/yr) — negative.
- To cash-flow at today's rent, offer at most $279k (5.3% below list).
- To meet the 1% rule (rent ≥ 1% of price), the offer needs to be $236k (20.1% below list).
- Recommended offer: $236k (20.1% below list) — sets the bar for 1% rule.
- Cap rate 5.9% vs local median 4.1% in St. Gabriel — top-decile yield for the area; either an underpriced asset or a hidden risk that comps aren't pricing in. Stress-test before assuming the spread holds.
Location & tenants
- Location reads: area grade D — affects rentability + tenant quality, not the cash-flow math above.
- Iberville Parish (rural): math 23% / reading 34% proficiency, ranked #45 of 98 in LA (top 46%) — low school quality limits family demand, transient renter base, plan for 1-2y turnover; 76% free/reduced lunch — lower-income household profile, screen leases tightly.
- Market conditions: 41 active listings in the ZIP; 2 comparable units currently listed for rent nearby; 117 units permitted in Iberville Parish in 2024 (0 in 5+ unit buildings).
Forward outlook
- In year one you build about $7k of equity ($2k loan paydown + $5k appreciation (1.6% local appreciation)).
- Iberville County population projected to shrink 6% by 2050 — rents likely to lag national; underwrite the cash flow, not the appreciation.
- By year 5, paydown + projected appreciation supports a ~$30k cash-out refi (75% LTV) — recoverable capital for the next deal without selling this one.
Negotiation context
- Only 9 days on market — expect competitive offers; lowballing is unlikely to land.
- 11 sale attempts since 14y ago with the ask held roughly flat each time — persistent listings suggest the price (not the market) is what's stuck; bring a comps-based counter.
- Current owner paid $254k; 16% above their basis — modest negotiation headroom, anchor on the comps not their cost.
Risks & watch-outs
- Climate carrying-cost: severe wind risk, 99% chance of damaging wind over 30y; extreme-heat days projected 7→22/yr by 2055 (HVAC capex compounding) — expect insurance premiums to compound above CPI over the hold.
Questions for the listing agent
- What do current leases actually rent for vs. the listed asking? Can we see a recent rent roll and the last 12 months of T-12 income?
- What does the HOA fee cover, when was the last increase, and are there any pending special assessments or reserve-fund shortfalls?
- Is there a deadline driving the sale (1031 exchange, divorce, estate, relocation)? That informs how much negotiation room exists.
- The area grade is low — what's the realistic commute time and amenity access for the typical tenant pool here? Any planned neighborhood developments (good or bad) we should know about?
- What's the average days-on-market for RENTAL listings here right now (not sales)? A rising rental-DOM trend means longer vacancies and softer asking-rent achievability than the comps imply.
- What's the recent tenant-quality profile in this submarket — average credit score on applications, eviction rate, late-payment / NSF rate, and stable-employment percentage? A property-management company in the area should have these aggregated.
- How much new for-sale + rental construction is in the pipeline within 1–3 miles? Heavy new supply typically softens prices + rents 12–24 months out; constrained supply supports both.
Investment metrics
- 1% rule
- 0.80% ✗
- Cap rate
- 5.93%
- Cash-on-cash
- -1.29%
- DSCR
- 0.94
- GRM
- 10.4
CMA / ARV
- ARV (on-the-fly)
- $296,000
- Comps found
- 12
Show comp detail 12 sales within ~0.75 mi
| Address | Dist | Beds/Ba | Sqft | Sold | Price | $/sf | Match |
|---|---|---|---|---|---|---|---|
| 1265 Madrid Ave | 0.01mi | 3/2.0 | 1,678 (-9%) | 1mo | $285,000 | $170 | 83 |
| 1160 Madrid Ave | 0.11mi | 3/2.0 | 1,632 (-12%) | 4mo | $278,500 | $171 | 72 |
| 1102 Madrid Ave | 0.17mi | 3/2.0 | 1,643 (-11%) | 4mo | $277,500 | $169 | 70 |
| 1829 Meadow Oak Dr | 0.23mi | 4/2.5 (+1) | 1,799 (-3%) | 9mo | $277,500 | $154 | 70 |
| 1103 Madrid Ave | 0.17mi | 4/2.0 (+1) | 1,659 (-10%) | 6mo | $245,000 | $148 | 65 |
| 1950 Pineglen Dr | 0.56mi | 3/2.0 | 1,825 (-1%) | 10mo | $284,900 | $156 | 64 |
| 1310 Madrid Ave | 0.05mi | 3/2.0 | 1,581 (-14%) | 12mo | $275,000 | $174 | 63 |
| 1860 Rollingwood Dr | 0.49mi | 3/2.0 | 1,825 (-1%) | 15mo | $285,000 | $156 | 63 |
| 1748 Shadowbrush Way | 0.27mi | 3/2.0 | 1,613 (-13%) | 9mo | $249,999 | $155 | 58 |
| 1900 Willow Bend Rd | 0.29mi | 3/2.0 | 1,659 (-10%) | 13mo | $260,000 | $157 | 58 |
| 1845 Pineglen Dr | 0.57mi | 3/2.0 | 1,625 (-12%) | 4mo | $260,000 | $160 | 50 |
| 1905 Pineglen Dr | 0.56mi | 3/2.0 | 1,612 (-13%) | 9mo | $259,900 | $161 | 45 |
Match score weights: distance 35% · size 25% · config 20% · recency 20%. Top-matched comps best support the ARV.
Projected returns pro-forma
1.6% appreciation · 3.0% rent growth · sell at horizon
- IRR
- 2.0%
- Equity multiple
- 1.10×
- Total profit
- $8,532
- Equity at exit
- $109,959
- IRR
- 6.2%
- Equity multiple
- 1.80×
- Total profit
- $66,438
- Equity at exit
- $153,567
Cash invested: $82,600 (down + closing). Projections, not guarantees.
Landlord ↔ Tenant lean methodology
- Overall (STATE)
- 90 Strongly Landlord-Friendly
- State Louisiana
- 90 Strongly Landlord-Friendly · R+12
- County
- — inherits STATE
- City
- — inherits STATE
ZIP-level market 70776
- Home prices YoY
- 1.1%
- Active inventory
- 41
- Price-to-rent
- 10.4×
Monthly cashflow live
- Estimated rent
- $2,356 medium interval (Pro) →
- Mortgage (P&I)
- −$1,547
- Tax from tax record
- −$247 /mo · $2,963/yr
- Insurance
- −$123
- HOA
- −$33
- Vacancy / Maint / Mgmt
- −$495
- Net cashflow
- $-89
Break-even live
Sensitivity live
| Price | -10% $78 | -5% $-5 | +0% $-89 | +5% $-172 | +10% $-256 |
|---|---|---|---|---|---|
| Rent | -10% $-275 | -5% $-182 | +0% $-89 | +5% $4 | +10% $97 |
| Rate | -1.0pp $60 | -0.5pp $-14 | base $-89 | +0.5pp $-165 | +1.0pp $-243 |
UW: 25.0% down · 7.5% · 30yr · 1.5% tax · 5.0% vac · 8.0% maint · 8.0% mgmt
Financing live
Cash to close
- Down payment
- $73,750
- Closing costs
- $8,850
- Reserves months
- —
- Total cash needed
- —
Loan-product check · same deal, 3 products live
Conventional
25% down · 7.5% · 30yr
- Down + closing
- —
- Monthly P&I
- —
- Monthly cashflow
- —
- DSCR
- —
- Eligible?
- —
Personal DTI + credit; lowest rate.
DSCR
20% down · 8.5% · 30yr
- Down + closing
- —
- Monthly P&I
- —
- Monthly cashflow
- —
- DSCR
- —
- Eligible?
- —
No personal income docs; deal must DSCR.
Hard money
10% down · 12.0% · 12mo
- Down + closing
- —
- Monthly P&I
- —
- Monthly cashflow
- —
- DSCR
- —
- Eligible?
- —
Short-term bridge; refi at stabilization.
Rent comps 2 comps
| Address | Beds | Baths | Sqft | Rent | $/sqft | DOM | Units | Dist |
|---|---|---|---|---|---|---|---|---|
| 1501 Ravier Ln Sunshine, LA | 3.0 | 2.0 | 1237 | $1,575 | $1.27 | 45d | 1 | 0.82mi |
| 2904 Rue Dauphine Baton Rouge, LA | 4.0 | 3.0 | 2622 | $3,700 | $1.41 | 45d | 1 | 1.49mi |
HOA detail
- Monthly dues
- $33 · $396/yr
- Likely covers
- watersecurity
Listing history 7 events
-
2026-06-21days on market $295,000 Active 9 DOM
-
2026-06-18days on market $295,000 Active 6 DOM
-
2026-06-17days on market $295,000 Active 5 DOM
-
2026-06-16days on market $295,000 Active 4 DOM
-
2026-06-15days on market $295,000 Active 3 DOM
-
2026-06-13remarks 699-char remark
-
2026-06-13$295,000 Active 1 DOM
ⓘ Source: listings_history table (triggers on properties + properties_extension) + one-shot
backfill from property_details.listing_events for pre-trigger history.
Tax reassessment forecast LA · Resets to sale price
- Current annual tax
- $2,963 · $247/mo
- Projected year-2 tax
- $2,963 · $247/mo
- Expected delta
- $0/yr ($0/mo · 0.0%)
ⓘ Screening estimate from a state-policy table — verify with the county assessor before closing.
Climate risk First Street
- Flood 1/10 Low FEMA zone X · 0% chance over 30 yrs
- Wildfire 1/10 Low
- Heat 8/10 Severe 7 d/yr ≥108°F today · 22 d/yr by 30 yrs out
- Wind 9/10 Extreme 99% chance of damaging wind over 30 yrs
- Air quality 2/10 Low 1 unhealthy d/yr today · 2 by 30 yrs out
Nearby sold comps map
Loading sold comps map…
Walkable amenities ~0.75 mi
Loading nearby amenities…
Taxation est. · year 1
- Rental income
- $28,268
- − Mortgage interest
- −$16,525
- − Property taxes
- −$2,963
- − Insurance
- −$1,475
- − Repairs & maintenance
- −$2,261
- − Management
- −$2,261
- − HOA
- −$396
- − Depreciation
- −$8,582
- Taxable loss
- −$6,196
- Est. tax savings @ 24.0%
- +$1,487
- After-tax cash flow
- $420/yr
For passive investors: Depreciation is non-cash, so a rental often shows a tax loss while cash-flowing — sheltering income. Rental losses are passive: they offset passive income freely, and up to $25,000/yr can offset ordinary (W-2) income if you actively participate and your MAGI is under $100k (phasing out to $0 by $150k); unused losses carry forward. On sale, claimed depreciation is recaptured at up to 25%, and gains may owe capital-gains tax (a 1031 exchange can defer both). Figures are a year-1 estimate at your 24.0% rate — not tax advice; consult a CPA.
Schools (NCES district)
- District
- Iberville Parish
- NCES district ID
- 2200750
- Math proficiency
- 23% ▼ -43.00%
- Reading proficiency
- 34% ▼ -35.00%
- Median HH income
- $44,386
- Composite
- 24.38/100
- National rank
- #7690
- State rank
- #45 of 98 in LA
Livability — St. Gabriel
No livability data for this city. (Only ~50 U.S. cities are tracked.)
Census & demographics
- Census place
- St. Gabriel, LA
- City population
- 6,672
- Population (ZIP)
- 6,304
Population outlook (Iberville County) Hauer SSP2
- Today (2025)
- 33,056 people
- By 2030
- 32,819 · -0.7%
- By 2040
- 32,043 · -3.1%
- By 2050
- 30,956 · -6.4%
- By 2075
- 28,314 · -14.3%
- By 2100
- 23,559 · -28.7%
Race, ethnicity, and origin ACS 2023
- Neighborhood character
- Diverse neighborhood (Simpson 0.60)
- Race & ethnicity
- Black 48% White 39% Hispanic / Latino 10% Two or more races 8%
- Hispanic origin (detail)
- Puerto Rican 2% Cuban 1%
- Common ancestry
- Lithuanian 7% Serbian 1% Italian 1%
- Foreign-born
- 9% · Canada, Jamaica
- Languages at home
- 85% English-only · Spanish 12% French/Haitian/Cajun 2%
Political lean MEDSL · Iberville
- 2024 margin
- Toss-up / Even · D 48.9% · R 49.6% · Other 1.5%
- 2008→2024 swing
- -11.9pp toward R · 2008: 11.2pp · 2024: -0.7pp
- All cycles
- 2024: R+0.7 2020: D+3.7 2016: D+6.3 2012: D+13.4 2008: D+11.2
Not yet ingested
- Civics
- —
Market trends
- HPI YoY
- ▲ 1.60%
- Current HPI
- 149.6923
- Rent YoY
- —
- Metro
- —
- State GDP YoY
- ▲ 3.29%
- F500 in state
- 10
Industry mix (Fortune 500 HQ in LA)
| Industry | F500 HQs | Revenue |
|---|---|---|
| Telecommunications | 2 | $23B |
|
||
| Utilities | 1 | $12B |
|
||
| Wholesale / Distribution | 1 | $5B |
|
||
| Advertising | 1 | $2B |
|
||
Price history
+55.3% since first listed21 events — show timeline
- 2026-06-12 Listed $295,000 AcadianaMLS
- 2026-06-12 Listed $295,000 GBRMLS
- 2021-03-15 Sold (Public Records) $254,000 Public Records
- 2021-03-12 Sold (MLS) — GBRMLS
- 2021-02-11 Pending — GBRMLS
- 2020-12-18 Price Changed $255,000 GBRMLS
- 2020-11-18 Listed $255,000 AcadianaMLS
- 2020-11-18 Listed $259,900 GBRMLS
- 2020-11-12 Delisted — GBRMLS
- 2020-10-26 Relisted — GBRMLS
- 2020-10-14 Contingent — GBRMLS
- 2020-10-14 Pending — GBRMLS
- 2020-07-19 Contingent — GBRMLS
- 2020-07-08 Listed $259,900 AcadianaMLS
- 2020-07-08 Listed $259,900 GBRMLS
- 2017-02-01 Sold (Public Records) $237,000 Public Records
- 2014-11-14 Sold (MLS) — GBRMLS
- 2014-05-22 Listed $224,900 AcadianaMLS
- 2014-05-22 Listed $224,900 GBRMLS
- 2012-10-15 Listed $189,900 AcadianaMLS
- 2012-10-15 Listed $189,900 GBRMLS
Property tax history
+16.4%/yrLatest (2024): $2,963 · +0.3% YoY. Source: county tax records.
Cash-flow waterfall
monthlySold comps — $/sqft
last 12 mo · ≤1 miLoading sold comps…