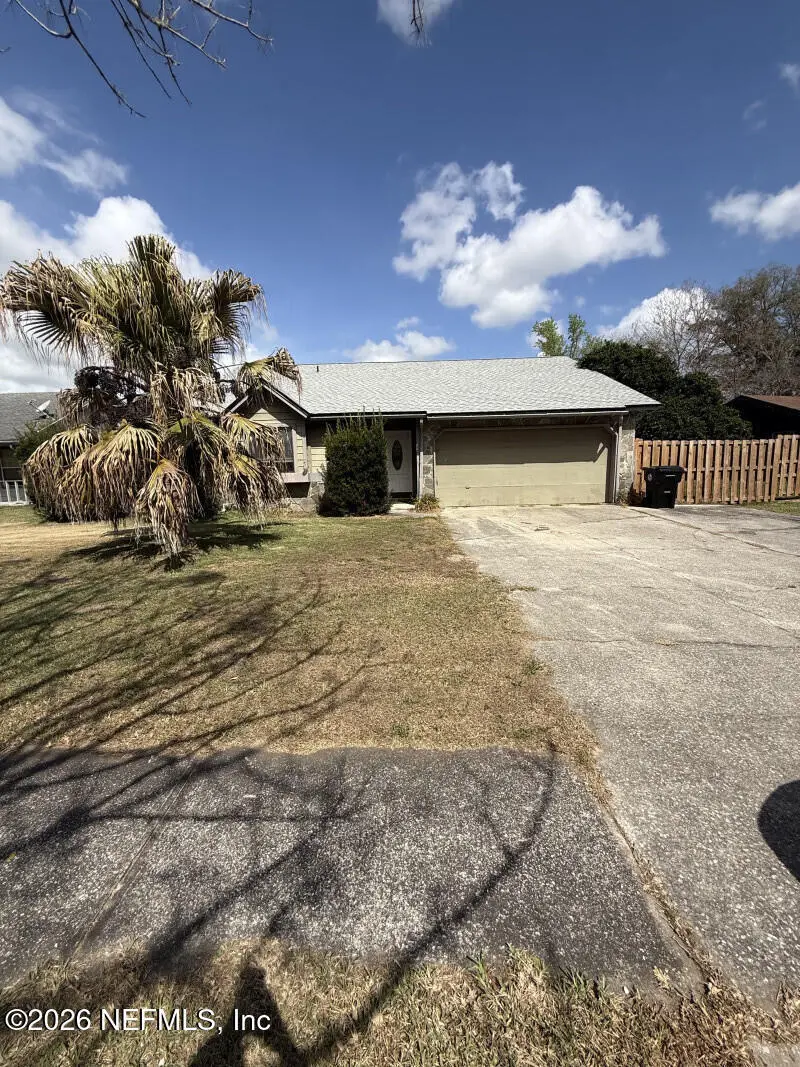
1862 Farm Way · Fleming Island, FL
Flood risk 3/10 · Minor
- FEMA flood zone
- X (unshaded)
- Chance of flooding over 30 yrs
- 0.12%
- Est. flood insurance / yr
- $507 – $1,088
Fire risk 3/10 · Minor
- Est. fire insurance / yr
- $947 – $1,759
Heat risk 9/10 · Severe
- Hot days now (above 107°F)
- 7 days/yr
- Hot days in 30 yrs
- 19 days/yr
Wind risk 9/10 · Severe
- Chance of severe wind over 30 yrs
- 99.0%
Air-quality risk 3/10 · Minor
- Unhealthy air days now
- 3 days/yr
- Unhealthy air days in 30 yrs
- 3 days/yr
Risk factors via First Street. Map © Google.
Why this score? — see what drove the C+ grade
The composite is a weighted blend of 9 inputs, each scored 0–100. Each bar is that input's sub-score; the figure is the points it added to the 100-point composite (weight × sub-score).
- Cash flow +20.3/30.0
- ARV discount +15.0/15.0
- DSCR +6.4/10.0
- Schools +5.1/10.0
- 1% rule +4.4/10.0
- Livability +4.1/5.0
- Rent growth +3.3/5.0
- Condition / age +2.5/5.0
- Appreciation +0.0/10.0
$215,000
🖨 Deal sheet 📄 Offer letter ✓ Due diligence
Listing remarks MLS
Welcome to this 3-bedroom, 2-bath home in the established Orange Park South neighborhood of Middleburg. Featuring a spacious layout with a combined living and dining area, wood-burning fireplace, and 2-car garage, this home offers a great foundation for comfortable living. Set on a generous lot with no HOA, there's plenty of room to make it your own. The home could use some TLC, making it a great opportunity for buyers looking to customize and add value. Conveniently located near everyday amenities and zoned for well-rated Clay County schools, this property is ideal for families or investors alike.
Key facts
- 9,020 sq ft lot
- 2 garage spots
- Built 1988
Property features AI
Exterior
- Parking: Attached 2-car garage; Driveway; Two covered parking spaces
- Security: Smoke detector(s)
- Utilities: Public water; Public sewer; Electricity connected; Cable available; Water available
- Home design: Single-family residence; One story; East-facing; Resale condition
- Construction: Frame construction with wood siding; Shingle roof; 1,311 living area (public records); Built as a single-story structure
- Exterior features: Not waterfront
Interior
- Kitchen: Dishwasher; Electric range; Microwave; Refrigerator
- Bedrooms: Three main-level bedrooms
- Flooring: Carpet; Concrete; Tile
- Bathrooms: Two full bathrooms on the main level
- Heating & cooling: Central heating; Central air conditioning; Ceiling fans
- Interior features: Built-in features; Wood-burning fireplace; Smoke detectors
- Laundry & utility: Laundry area in the garage
Neighborhood map
What this means for you Summary
Snapshot
- This is a 3-bed/2.0-bath single-family listed at $215k.
Deal economics
- At list price, monthly cash flow is $276 ($3k/yr) — positive.
- The deal already cash-flows at list — no discount required.
- To meet the 1% rule (rent ≥ 1% of price), the offer needs to be $203k (5.6% below list).
- Recommended offer: $203k (5.6% below list) — sets the bar for 1% rule.
- Cap rate 7.8% vs local median 3.0% in Fleming Island — top-decile yield for the area; either an underpriced asset or a hidden risk that comps aren't pricing in. Stress-test before assuming the spread holds.
Location & tenants
- Location reads 82/100 on livability (#74 in FL, #1,239 nationally) — a professional / high-income tenant draw. Strengths: crime A+, employment A+, housing A+; Watch: amenities D-, commute F.
- Clay (suburban): math 58% / reading 59% proficiency, ranked #14 of 73 in FL (top 19%) — acceptable for families but not a draw, mixed tenant base, ~2y average lease.
- Market conditions: Rents rising (+3.4%/yr); 601 active listings in the ZIP; 1 comparable units currently listed for rent nearby; solid renter incomes; 1,876 units permitted in Clay County in 2024 (14 in 5+ unit buildings).
Forward outlook
- Local home prices are declining (-3.0%/yr); year-one equity from $1k of loan paydown is wiped out by about $6k of value loss. Plan a longer hold.
- Clay County population projected at +19% by 2050 — long-run rental-demand tailwind backs the buy-and-hold thesis.
Negotiation context
- It's been on market 32 days — a 3% lower offer ($209k) is reasonable based on typical stale-listing flexibility.
- 3 sale attempts since 21y ago with the ask held roughly flat each time — persistent listings suggest the price (not the market) is what's stuck; bring a comps-based counter.
- Current owner paid $154k; 40% above their basis — modest negotiation headroom, anchor on the comps not their cost.
Risks & watch-outs
- Climate carrying-cost: severe wind risk, 99% chance of damaging wind over 30y; extreme-heat days projected 7→19/yr by 2055 (HVAC capex compounding) — expect insurance premiums to compound above CPI over the hold.
Questions for the listing agent
- It's been on market 32 days. Have you received any prior offers? Is the seller open to a 6% concession, seller financing, or rate buy-down credit?
- Is there a deadline driving the sale (1031 exchange, divorce, estate, relocation)? That informs how much negotiation room exists.
- Schools are A-rated — typically a magnet for longer-tenancy family renters. What's the average tenant stay here, and is there a school-zone premium baked into asking?
- What's the average days-on-market for RENTAL listings here right now (not sales)? A rising rental-DOM trend means longer vacancies and softer asking-rent achievability than the comps imply.
- What's the recent tenant-quality profile in this submarket — average credit score on applications, eviction rate, late-payment / NSF rate, and stable-employment percentage? A property-management company in the area should have these aggregated.
- How much new for-sale + rental construction is in the pipeline within 1–3 miles? Heavy new supply typically softens prices + rents 12–24 months out; constrained supply supports both.
Investment metrics
- 1% rule
- 0.94% ✗
- Cap rate
- 7.83%
- Cash-on-cash
- 5.50%
- DSCR
- 1.24
- GRM
- 8.8
CMA / ARV
- ARV (on-the-fly)
- $259,578
- Comps found
- 12
Show comp detail 12 sales within ~0.75 mi
| Address | Dist | Beds/Ba | Sqft | Sold | Price | $/sf | Match |
|---|---|---|---|---|---|---|---|
| 2237 Alderney Ct | 0.10mi | 3/2.0 | 1,333 (+2%) | 1mo | $147,000 | $110 | 92 |
| 2070 Tickford St | 0.09mi | 3/2.0 | 1,372 (+5%) | 3mo | $282,000 | $206 | 86 |
| 2410 Cashmere Ct | 0.53mi | 3/2.0 | 1,302 (-1%) | 0mo | $230,000 | $177 | 74 |
| 2372 Tigress Ln | 0.40mi | 3/2.0 | 1,364 (+4%) | 1mo | $270,000 | $198 | 74 |
| 2482 Aloha Ln | 0.43mi | 3/2.0 | 1,330 (+1%) | 6mo | $284,000 | $214 | 72 |
| 2185 Khaki Ct | 0.44mi | 3/2.0 | 1,248 (-5%) | 1mo | $274,000 | $220 | 70 |
| 2500 Ambrosia Dr | 0.47mi | 3/2.0 | 1,297 (-1%) | 7mo | $255,000 | $197 | 70 |
| 2268 Felucca Dr | 0.34mi | 3/2.0 | 1,431 (+9%) | 1mo | $275,000 | $192 | 68 |
| 2246 Botany St | 0.47mi | 3/2.0 | 1,212 (-8%) | 2mo | $285,000 | $235 | 64 |
| 1709 Ashwood Cir | 0.62mi | 3/2.0 | 1,359 (+4%) | 6mo | $280,000 | $206 | 60 |
| 1994 Apopka Dr | 0.74mi | 3/2.0 | 1,458 (+11%) | 1mo | $275,000 | $189 | 46 |
| 2432 Ambrosia Dr | 0.53mi | 4/2.0 (+1) | 1,506 (+15%) | 5mo | $280,000 | $186 | 41 |
Match score weights: distance 35% · size 25% · config 20% · recency 20%. Top-matched comps best support the ARV.
Projected returns pro-forma
-3.0% appreciation · 3.35% rent growth · sell at horizon
- IRR
- -7.5%
- Equity multiple
- 0.72×
- Total profit
- $-16,616
- Equity at exit
- $32,057
- IRR
- 2.5%
- Equity multiple
- 1.18×
- Total profit
- $10,851
- Equity at exit
- $18,589
Cash invested: $60,200 (down + closing). Projections, not guarantees.
Landlord ↔ Tenant lean methodology
- Overall (STATE)
- 87 Strongly Landlord-Friendly
- State Florida
- 87 Strongly Landlord-Friendly · R+3
- County
- — inherits STATE
- City
- — inherits STATE
ZIP-level market 32068
- Home prices YoY
- -27.5%
- Rents YoY
- 3.4%
- Active inventory
- 601
- Price-to-rent
- 8.8×
Monthly cashflow live
- Estimated rent
- $2,029 medium interval (Pro) →
- Mortgage (P&I)
- −$1,127
- Tax from tax record
- −$110 /mo · $1,318/yr
- Insurance
- −$90
- HOA
- −$0
- Vacancy / Maint / Mgmt
- −$426
- Net cashflow
- $276
Break-even live
UW: 25.0% down · 7.5% · 30yr · 1.5% tax · 5.0% vac · 8.0% maint · 8.0% mgmt
Financing live
Cash to close
- Down payment
- $53,750
- Closing costs
- $6,450
- Reserves months
- —
- Total cash needed
- —
Loan-product check · same deal, 3 products live
Conventional
25% down · 7.5% · 30yr
- Down + closing
- —
- Monthly P&I
- —
- Monthly cashflow
- —
- DSCR
- —
- Eligible?
- —
Personal DTI + credit; lowest rate.
DSCR
20% down · 8.5% · 30yr
- Down + closing
- —
- Monthly P&I
- —
- Monthly cashflow
- —
- DSCR
- —
- Eligible?
- —
No personal income docs; deal must DSCR.
Hard money
10% down · 12.0% · 12mo
- Down + closing
- —
- Monthly P&I
- —
- Monthly cashflow
- —
- DSCR
- —
- Eligible?
- —
Short-term bridge; refi at stabilization.
Rent comps 1 comps
| Address | Beds | Baths | Sqft | Rent | $/sqft | DOM | Units | Dist |
|---|---|---|---|---|---|---|---|---|
| 1715 Farm Way Middleburg, FL | 3.0 | 2.0 | 1208 | $1,899 | $1.57 | 7d | 1 | 0.52mi |
Listing history 12 events
-
2026-06-02status $215,000 Pending 32 DOM
-
2026-06-01days on market $215,000 Active 32 DOM
-
2026-05-31days on market $215,000 Active 31 DOM
-
2026-05-21price $210,000 608-char remark
Show marketing remark (608 chars)
Welcome to this 3-bedroom, 2-bath home in the established Orange Park South neighborhood of Middleburg. Featuring a spacious layout with a combined living and dining area, wood-burning fireplace, and 2-car garage, this home offers a great foundation for comfortable living. Set on a generous lot with no HOA, there's plenty of room to make it your own. The home could use some TLC, making it a great opportunity for buyers looking to customize and add value. Conveniently located near everyday amenities and zoned for well-rated Clay County schools, this property is ideal for families or investors alike.
-
2026-05-08$215,000 Active 608-char remark
Show marketing remark (608 chars)
Welcome to this 3-bedroom, 2-bath home in the established Orange Park South neighborhood of Middleburg. Featuring a spacious layout with a combined living and dining area, wood-burning fireplace, and 2-car garage, this home offers a great foundation for comfortable living. Set on a generous lot with no HOA, there's plenty of room to make it your own. The home could use some TLC, making it a great opportunity for buyers looking to customize and add value. Conveniently located near everyday amenities and zoned for well-rated Clay County schools, this property is ideal for families or investors alike.
-
2026-04-30$215,000 Active
-
2005-09-13soldstatus $153,900
-
2005-08-30historical 295-char remark
Show marketing remark (295 chars)
Very nice 3 bedroom, 2 bath home in popular Orange Park South features vaulted ceiling in great room, tiled floors in common areas, carpet in bedrooms, large closets and fireplace. The screened patio overlooks a well maintained fenced yard with irrigation system. Wide lot provides great space.
-
2005-08-29soldstatus $153,900 295-char remark
Show marketing remark (295 chars)
Very nice 3 bedroom, 2 bath home in popular Orange Park South features vaulted ceiling in great room, tiled floors in common areas, carpet in bedrooms, large closets and fireplace. The screened patio overlooks a well maintained fenced yard with irrigation system. Wide lot provides great space.
-
2005-07-27$149,900 295-char remark
Show marketing remark (295 chars)
Very nice 3 bedroom, 2 bath home in popular Orange Park South features vaulted ceiling in great room, tiled floors in common areas, carpet in bedrooms, large closets and fireplace. The screened patio overlooks a well maintained fenced yard with irrigation system. Wide lot provides great space.
-
1998-07-24soldstatus $87,500
-
1993-04-16soldstatus $72,900
ⓘ Source: listings_history table (triggers on properties + properties_extension) + one-shot
backfill from property_details.listing_events for pre-trigger history.
Tax reassessment forecast FL · Resets to sale price
- Current annual tax
- $1,318 · $110/mo
- Projected year-2 tax
- $1,784 · $149/mo
- Expected delta
- +$466/yr (+$39/mo · 35.4%)
ⓘ Screening estimate from a state-policy table — verify with the county assessor before closing.
Climate risk First Street
- Flood 3/10 Moderate FEMA zone X (unshaded) · 12% chance over 30 yrs
- Wildfire 3/10 Moderate
- Heat 9/10 Extreme 7 d/yr ≥107°F today · 19 d/yr by 30 yrs out
- Wind 9/10 Extreme 99% chance of damaging wind over 30 yrs
- Air quality 3/10 Moderate 3 unhealthy d/yr today · 3 by 30 yrs out
Nearby sold comps map
Loading sold comps map…
Walkable amenities ~0.75 mi
Loading nearby amenities…
Taxation est. · year 1
- Rental income
- $24,347
- − Mortgage interest
- −$12,043
- − Property taxes
- −$1,318
- − Insurance
- −$1,075
- − Repairs & maintenance
- −$1,948
- − Management
- −$1,948
- − Depreciation
- −$6,255
- Taxable loss
- −$240
- Est. tax savings @ 24.0%
- +$58
- After-tax cash flow
- $3,369/yr
For passive investors: Depreciation is non-cash, so a rental often shows a tax loss while cash-flowing — sheltering income. Rental losses are passive: they offset passive income freely, and up to $25,000/yr can offset ordinary (W-2) income if you actively participate and your MAGI is under $100k (phasing out to $0 by $150k); unused losses carry forward. On sale, claimed depreciation is recaptured at up to 25%, and gains may owe capital-gains tax (a 1031 exchange can defer both). Figures are a year-1 estimate at your 24.0% rate — not tax advice; consult a CPA.
Schools (NCES district)
- District
- Clay
- NCES district ID
- 1200300
- Math proficiency
- 58% ▼ -8.00%
- Reading proficiency
- 59% ▼ -3.00%
- Median HH income
- $59,379
- Composite
- 50.73/100
- National rank
- #1815
- State rank
- #14 of 73 in FL
Livability — Fleming Island
- Score
- 82/100
- State rank
- #74
- US rank
- #1239
Category grades
Schools grade is shown separately in the Schools card above.
Census & demographics
- County
- Clay County · 208,450 people
- City population
- 29,766
- Metro
- Jacksonville, FL
- Population (ZIP)
- 58,983
- Household income
- $84,431
- Rent vs Own
- Severe rent burden
- 975.0
Population outlook (Clay County) Hauer SSP2
- Today (2025)
- 230,495 people
- By 2030
- 242,427 · +5.2%
- By 2040
- 262,244 · +13.8%
- By 2050
- 275,148 · +19.4%
- By 2075
- 295,397 · +28.2%
- By 2100
- 287,592 · +24.8%
Race, ethnicity, and origin ACS 2023
- Neighborhood character
- Predominantly White (74%)
- Race & ethnicity
- White 74% Hispanic / Latino 13% Two or more races 10% Black 7%
- Hispanic origin (detail)
- Mexican 2% Puerto Rican 5%
- Common ancestry
- Slovak 2% Romanian 2% Lithuanian 2%
- Foreign-born
- 7% · Canada, Jamaica
- Languages at home
- 87% English-only · Spanish 9% Arabic 1% German/W. Germanic 1%
Political lean MEDSL · Clay
- 2024 margin
- Solid R (+39.3) · D 29.9% · R 69.2%
- 2008→2024 swing
- +3.6pp toward D · 2008: -42.8pp · 2024: -39.3pp
- All cycles
- 2024: R+39.3 2020: R+37.1 2016: R+44.3 2012: R+45.8 2008: R+42.8
Not yet ingested
- Civics
- —
Market trends
- HPI YoY
- ▼ -115.99%
- Current HPI
- 305.2531
- Rent YoY
- ▲ 3.35%
- Metro
- Jacksonville, FL
- State GDP YoY
- ▲ 3.28%
- F500 in state
- 36
Industry mix (Fortune 500 HQ in FL)
| Industry | F500 HQs | Revenue |
|---|---|---|
| Industrial Technology | 2 | $29B |
|
||
| Insurance | 2 | $17B |
|
||
| Retail | 1 | $60B |
|
||
| Technology Distribution | 1 | $58B |
|
||
| Homebuilding | 1 | $35B |
|
||
| Technology Manufacturing | 1 | $35B |
|
||
Price history
+188.1% since first listed9 events — show timeline
- 2026-05-21 Price Changed $210,000 realMLS
- 2026-05-08 Listed $215,000 realMLS
- 2026-04-30 Listed $215,000 Beaches MLS
- 2005-09-13 Sold (Public Records) $153,900 Public Records
- 2005-08-30 Listing Removed — realMLS
- 2005-08-29 Sold (MLS) $153,900 realMLS
- 2005-07-27 Listed $149,900 realMLS
- 1998-07-24 Sold (Public Records) $87,500 Public Records
- 1993-04-16 Sold (Public Records) $72,900 Public Records
Property tax history
+3.4%/yrLatest (2025): $1,318 · +4.0% YoY. Source: county tax records.
Cash-flow waterfall
monthlySold comps — $/sqft
last 12 mo · ≤1 miLoading sold comps…