 Duplex
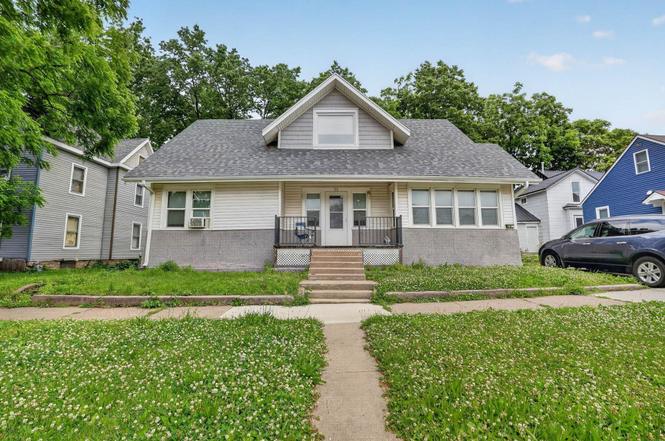
723 Randolph St · Waterloo, IA
Flood risk 1/10 · Minimal
- FEMA flood zone
- X (unshaded)
- Chance of flooding over 30 yrs
- 0.0%
- Est. flood insurance / yr
- $473 – $860
Fire risk 1/10 · Minimal
- Est. fire insurance / yr
- $902 – $1,676
Heat risk 3/10 · Minor
- Hot days now (above 101°F)
- 7 days/yr
- Hot days in 30 yrs
- 16 days/yr
Wind risk 2/10 · Minimal
- Chance of severe wind over 30 yrs
- —
Air-quality risk 1/10 · Minimal
- Unhealthy air days now
- 0 days/yr
- Unhealthy air days in 30 yrs
- 0 days/yr
Risk factors via First Street. Map © Google.
Why this score? — see what drove the B- grade
The composite is a weighted blend of 9 inputs, each scored 0–100. Each bar is that input's sub-score; the figure is the points it added to the 100-point composite (weight × sub-score).
- Cash flow +30.0/30.0
- 1% rule +10.0/10.0
- DSCR +10.0/10.0
- Schools +4.4/10.0
- Livability +4.0/5.0
- ARV discount +3.3/15.0
- Rent growth +3.2/5.0
- Condition / age +2.5/5.0
- Appreciation +0.0/10.0
$100,000
🖨 Deal sheet (PDF) 📄 Offer letter ✓ Due diligence
Multi-family units
County records classify this as Multi-Family (2-4 Unit). Listing-text estimate: 2 units. confirmed
Listing remarks MLS
Calling all investors!!! Price Reduced and Ready to Sell!! Location is perfect and price is right! Duplex with 3 Bedrooms down and 1 Bedroom up. Both units have their own kitchens and come with appliances. Call your favorite Realtor today!
Key facts
- 4,200 sq ft lot
- 4 parking spots
- Built 1896
Property features AI
Finance
- Other: Property listed as residential income (duplex)
- Financial info: Actual rent: $585 for the 1-bedroom unit; Actual rent: $760 for the 3-bedroom unit
Exterior
- Parking: Four open on-street parking spaces
- Utilities: Public water; Public sewer; Other utilities
- Home design: Duplex (residential income property)
- Construction: Vinyl siding and stucco exterior; About 1,000 sq ft finished above grade and 1,000 sq ft finished below grade
- Exterior features: Asphalt roof; Lot approximately 60 x 70 (about 0.1 acre); R-1 zoning
Interior
- Bedrooms: One 1-bedroom unit; One 3-bedroom unit
- Heating & cooling: Natural gas heating; Window cooling units
- Interior features: Lower-level laundry
- Laundry & utility: Laundry located on lower level
Neighborhood map
What this means for you Summary
Snapshot
- This is a 1×2bd/1.0ba + 1×1bd/?ba units multifamily listed at $100k.
Deal economics
- At list price, monthly cash flow is $537 ($6k/yr) — positive. Per door: $268/mo.
- The deal already cash-flows at list — no discount required.
- Meets the 1% rule at list price ($2k rent vs $100k).
- Cap rate 12.7% vs local median 4.2% in Waterloo — top-decile yield for the area; either an underpriced asset or a hidden risk that comps aren't pricing in. Stress-test before assuming the spread holds.
Location & tenants
- Location reads 81/100 on livability (#74 in IA, #1,589 nationally) — a professional / high-income tenant draw. Strengths: commute A+, cost of living A+, housing A+; Watch: crime F, employment D-.
- Waterloo Community School District (urban): math 50% / reading 54% proficiency, ranked #276 of 289 in IA (top 96%) — acceptable for families but not a draw, mixed tenant base, ~2y average lease.
- Zoned schools: Lowell Elementary School (math 42% / reading 42%, grade F, #563 of 616 statewide, top 93%, 513 students, 74% FRL); Bunger Middle School (math 48% / reading 47%, grade C-, #226 of 246 statewide, top 92%, 431 students, 75% FRL); West High School (math 55% / reading 63%, grade C+, #273 of 336 statewide, top 81%, 1,652 students, 62% FRL).
- Market conditions: Rents rising (+2.7%/yr); 126 active listings in the ZIP; 10 comparable units currently listed for rent nearby; rentals lingering (median 45d on market — plan ~5-8 weeks vacancy on turnover, expect pricing pressure); 80% of comp listings sitting > 30 days — soft ceiling on asking rent; 287 units permitted in Black Hawk County in 2024 (67 in 5+ unit buildings).
- This rent runs 30% of the median local income ($62k/yr) — at the standard rent-burdened threshold; future hikes will face affordability resistance.
Forward outlook
- Local home prices are declining (-3.0%/yr); year-one equity from $691 of loan paydown is wiped out by about $3k of value loss. Plan a longer hold.
- Black Hawk County population projected at +10% by 2050 — modest demand growth; plan on rents tracking national, not racing it.
- At projected returns (-3.0% appreciation + 2.7% rent growth), your $28k cash investment doubles in ~6 years — after that, you're playing with house money.
Negotiation context
- Only 10 days on market — expect competitive offers; lowballing is unlikely to land.
- 2 sale attempts since 10y ago with the ask held roughly flat each time — persistent listings suggest the price (not the market) is what's stuck; bring a comps-based counter.
- Current owner paid $36k; list at $100k implies a 178% gain — meaningful room to come down on a strong offer.
Risks & watch-outs
- Watch-outs: built in 1896 — expect roof / HVAC / electrical / plumbing capex.
Questions for the listing agent
- Can we see the unit-by-unit rent roll, current vacancy, and any below-market leases? What's the average tenancy length?
- What capital expenditures (roof, boiler, parking lot, exteriors) have been made in the last 5 years, and what's planned in the next 2?
- Built in 1896 — when were the roof, HVAC, electrical panel, plumbing, and water heater last replaced?
- Is there a deadline driving the sale (1031 exchange, divorce, estate, relocation)? That informs how much negotiation room exists.
- Crime grade is F in this area — have there been break-ins, vandalism, or insurance claims at this property in the last 3 years? What carrier currently insures it and at what premium?
- What's the average days-on-market for RENTAL listings here right now (not sales)? A rising rental-DOM trend means longer vacancies and softer asking-rent achievability than the comps imply.
- What's the recent tenant-quality profile in this submarket — average credit score on applications, eviction rate, late-payment / NSF rate, and stable-employment percentage? A property-management company in the area should have these aggregated.
- How much new apartment / multifamily construction is in the pipeline within 1–3 miles? Heavy new supply (>2% of stock underway) typically softens rents 12–24 months out; light construction supports rent growth.
Investment metrics
- 1% rule
- 1.55% ✓
- Cap rate
- 12.73%
- Cash-on-cash
- 23.00%
- DSCR
- 2.02
- GRM
- 5.4
CMA / ARV
- ARV (on-the-fly)
- $91,434
- Comps found
- 3
Show comp detail 3 sales within ~0.75 mi
| Address | Dist | Beds/Ba | Sqft | Sold | Price | $/sf | Match |
|---|---|---|---|---|---|---|---|
| 1424 Grant Ave | 0.45mi | 3/2.0 | 1,824 (-2%) | 13mo | $89,000 | $49 | 63 |
| 258 Western Ave | 0.53mi | 3/2.0 | 1,950 (+4%) | 6mo | $65,000 | $33 | 61 |
| 622 W 2nd St | 0.36mi | 4/2.0 (+1) | 1,976 (+6%) | 19mo | $105,000 | $53 | 51 |
Match score weights: distance 35% · size 25% · config 20% · recency 20%. Top-matched comps best support the ARV.
Projected returns pro-forma
-3.0% appreciation · 2.7% rent growth · sell at horizon
- IRR
- 15.6%
- Equity multiple
- 1.63×
- Total profit
- $17,529
- Equity at exit
- $14,910
- IRR
- 24.1%
- Equity multiple
- 3.05×
- Total profit
- $57,461
- Equity at exit
- $8,646
Cash invested: $28,000 (down + closing). Projections, not guarantees.
Landlord ↔ Tenant lean methodology
- Overall (STATE)
- 83 Strongly Landlord-Friendly
- State Iowa
- 83 Strongly Landlord-Friendly · R+6
- County
- — inherits STATE
- City
- — inherits STATE
ZIP-level market 50702
- Rents YoY
- 2.7%
- Active inventory
- 126
- Price-to-rent
- 10.4×
Monthly cashflow live
- Estimated rent
- $1,553 high interval (Pro) →
- Mortgage (P&I)
- −$524
- Tax from tax record
- −$124 /mo · $1,490/yr
- Insurance
- −$42
- HOA
- −$0
- Vacancy / Maint / Mgmt
- −$326
- Net cashflow
- $537
Break-even live
Sensitivity live
| Price | -10% $593 | -5% $565 | +0% $537 | +5% $508 | +10% $480 |
|---|---|---|---|---|---|
| Rent | -10% $414 | -5% $475 | +0% $537 | +5% $598 | +10% $659 |
| Rate | -1.0pp $587 | -0.5pp $562 | base $537 | +0.5pp $511 | +1.0pp $484 |
2-unit breakdown (identical units grouped — click to expand)
| Units | Beds | Baths | Est. rent |
|---|---|---|---|
| 1× unit | 2 | 1 | $798 |
| 1× unit | 1 | 0 | $755 |
| Total (2 units) | $1,553 | ||
UW: 25.0% down · 7.5% · 30yr · 1.5% tax · 5.0% vac · 8.0% maint · 8.0% mgmt
Financing live
Cash to close
- Down payment
- $25,000
- Closing costs
- $3,000
- Reserves months
- —
- Total cash needed
- —
Loan-product check · same deal, 3 products live
Conventional
25% down · 7.5% · 30yr
- Down + closing
- —
- Monthly P&I
- —
- Monthly cashflow
- —
- DSCR
- —
- Eligible?
- —
Personal DTI + credit; lowest rate.
DSCR
20% down · 8.5% · 30yr
- Down + closing
- —
- Monthly P&I
- —
- Monthly cashflow
- —
- DSCR
- —
- Eligible?
- —
No personal income docs; deal must DSCR.
Hard money
10% down · 12.0% · 12mo
- Down + closing
- —
- Monthly P&I
- —
- Monthly cashflow
- —
- DSCR
- —
- Eligible?
- —
Short-term bridge; refi at stabilization.
Rent comps 10 comps
| Address | Beds | Baths | Sqft | Rent | $/sqft | DOM | Units | Dist |
|---|---|---|---|---|---|---|---|---|
| 223 W 4th St Ste 203 Waterloo, IA | 2.0 | 1.5 | 1466 | $1,250 | $0.85 | 45d | 1 | 0.34mi |
| 702 Western Ave Waterloo, IA | 2.0 | 1.5 | 1500 | $1,100 | $0.73 | 22d | 1 | 0.42mi |
| 905 Baltimore St Waterloo, IA | 3.0 | 1.5 | 1392 | $1,025 | $0.74 | 45d | 1 | 0.61mi |
| 1427 W 2nd St Waterloo, IA | 3.0 | 1.0 | 1248 | $1,250 | $1.00 | 45d | 1 | 0.73mi |
| 616 Kimball Ave Waterloo, IA | 3.0 | 1.0 | 1302 | $1,100 | $0.84 | 45d | 1 | 0.81mi |
| 1107 Mulberry St Waterloo, IA | 3.0 | 1.0 | 1248 | $950 | $0.76 | 22d | 1 | 0.87mi |
| 1840 W 3rd St Waterloo, IA | 2.0 | 1.0 | 1770 | $700 | $0.40 | 46d | 1 | 0.97mi |
| 1720 Franklin St Waterloo, IA | 4.0 | 1.5 | 1392 | $1,000 | $0.72 | 45d | 1 | 1.23mi |
| 1014 Fletcher Ave Waterloo, IA | 4.0 | 3.5 | 2123 | $2,450 | $1.15 | 45d | 1 | 1.36mi |
| 1702 Hammond Ave Waterloo, IA | 3.0 | 2.0 | 1337 | $1,500 | $1.12 | 45d | 1 | 1.40mi |
Listing history 9 events
-
2026-06-21days on market $100,000 Active 10 DOM
-
2026-06-19days on market $100,000 Active 8 DOM
-
2026-06-18days on market $100,000 Active 7 DOM
-
2026-06-17days on market $100,000 Active 6 DOM
-
2026-06-16days on market $100,000 Active 5 DOM
-
2026-06-15days on market $100,000 Active 4 DOM
-
2026-06-14days on market $100,000 Active 2 DOM
-
2026-06-13remarks 265-char remark
-
2026-06-13$100,000 Active 1 DOM
ⓘ Source: listings_history table (triggers on properties + properties_extension) + one-shot
backfill from property_details.listing_events for pre-trigger history.
Tax reassessment forecast IA · Partial reset (capped growth)
- Current annual tax
- $1,490 · $124/mo
- Projected year-2 tax
- $1,530 · $128/mo
- Expected delta
- +$40/yr (+$3/mo · 2.7%)
ⓘ Screening estimate from a state-policy table — verify with the county assessor before closing.
Climate risk First Street
- Flood 1/10 Low FEMA zone X (unshaded) · 0% chance over 30 yrs
- Wildfire 1/10 Low
- Heat 3/10 Moderate 7 d/yr ≥101°F today · 16 d/yr by 30 yrs out
- Wind 2/10 Low
- Air quality 1/10 Low 0 unhealthy d/yr today · 0 by 30 yrs out
Nearby sold comps map
Loading sold comps map…
Walkable amenities ~0.75 mi
Loading nearby amenities…
Taxation est. · year 1
- Rental income
- $18,636
- − Mortgage interest
- −$5,602
- − Property taxes
- −$1,490
- − Insurance
- −$500
- − Repairs & maintenance
- −$1,491
- − Management
- −$1,491
- − Depreciation
- −$2,909
- Taxable income
- $5,154
- Est. tax owed @ 24.0%
- −$1,237
- After-tax cash flow
- $5,203/yr
For passive investors: Depreciation is non-cash, so a rental often shows a tax loss while cash-flowing — sheltering income. Rental losses are passive: they offset passive income freely, and up to $25,000/yr can offset ordinary (W-2) income if you actively participate and your MAGI is under $100k (phasing out to $0 by $150k); unused losses carry forward. On sale, claimed depreciation is recaptured at up to 25%, and gains may owe capital-gains tax (a 1031 exchange can defer both). Figures are a year-1 estimate at your 24.0% rate — not tax advice; consult a CPA.
Schools (NCES district)
- District
- Waterloo Community School District
- NCES district ID
- 1930480
- Math proficiency
- 50% ▼ -4.00%
- Reading proficiency
- 54% ▲ 1.00%
- Median HH income
- $42,545
- Composite
- 43.72/100
- National rank
- #2950
- State rank
- #276 of 289 in IA
Livability — Waterloo
- Score
- 81/100
- State rank
- #74
- US rank
- #1589
Category grades
Schools grade is shown separately in the Schools card above.
Census & demographics
- Census place
- Waterloo, IA
- County
- Black Hawk County · 112,933 people
- City population
- 69,066
- Metro
- Waterloo-Cedar Falls, IA
- Population (ZIP)
- 20,882
- Household income
- $62,021
- Rent vs Own
- Severe rent burden
- 479.0
Population outlook (Black Hawk County) Hauer SSP2
- Today (2025)
- 139,716 people
- By 2030
- 142,853 · +2.2%
- By 2040
- 147,843 · +5.8%
- By 2050
- 153,247 · +9.7%
- By 2075
- 167,977 · +20.2%
- By 2100
- 177,320 · +26.9%
Race, ethnicity, and origin ACS 2023
- Neighborhood character
- Predominantly White (68%)
- Race & ethnicity
- White 68% Black 14% Hispanic / Latino 9% Two or more races 5% Asian 3% Pacific Islander 3% Native American 1%
- Hispanic origin (detail)
- Mexican 6% Puerto Rican 1%
- Common ancestry
- American 5% Portuguese 3% Lithuanian 2%
- Foreign-born
- 15% · Canada, Philippines
- Languages at home
- 79% English-only · Spanish 7% Russian/Polish/Slavic 6% Other Asian/Pacific 4%
Political lean MEDSL · Black Hawk
- 2024 margin
- Toss-up / Even · D 50.0% · R 48.8% · Other 1.2%
- 2008→2024 swing
- -21.3pp toward R · 2008: 22.4pp · 2024: 1.2pp
- All cycles
- 2024: D+1.2 2020: D+9.0 2016: D+7.3 2012: D+20.0 2008: D+22.4
Not yet ingested
- Civics
- —
Market trends
- HPI YoY
- ▼ -110.86%
- Current HPI
- 155.4447
- Rent YoY
- ▲ 2.70%
- Metro
- Waterloo-Cedar Falls, IA
- State GDP YoY
- ▲ 2.48%
- F500 in state
- 4
Industry mix (Fortune 500 HQ in IA)
| Industry | F500 HQs | Revenue |
|---|---|---|
| Financial Services | 1 | $16B |
|
||
| Retail / Convenience | 1 | $15B |
|
||
Price history
+150.0% since first listed4 events — show timeline
- 2026-06-11 Listed $100,000 NEIRBR as distributed by MLS GRID
- 2017-03-29 Sold (Public Records) $36,000 Public Records
- 2017-03-24 Sold (MLS) $36,000 NEIRBR as distributed by MLS GRID
- 2016-09-23 Listed $40,000 NEIRBR as distributed by MLS GRID
Property tax history
+4.5%/yrLatest (2025): $1,490 · +8.6% YoY. Source: county tax records.
Cash-flow waterfall
monthlySold comps — $/sqft
last 12 mo · ≤1 miLoading sold comps…