 🔨 Auction
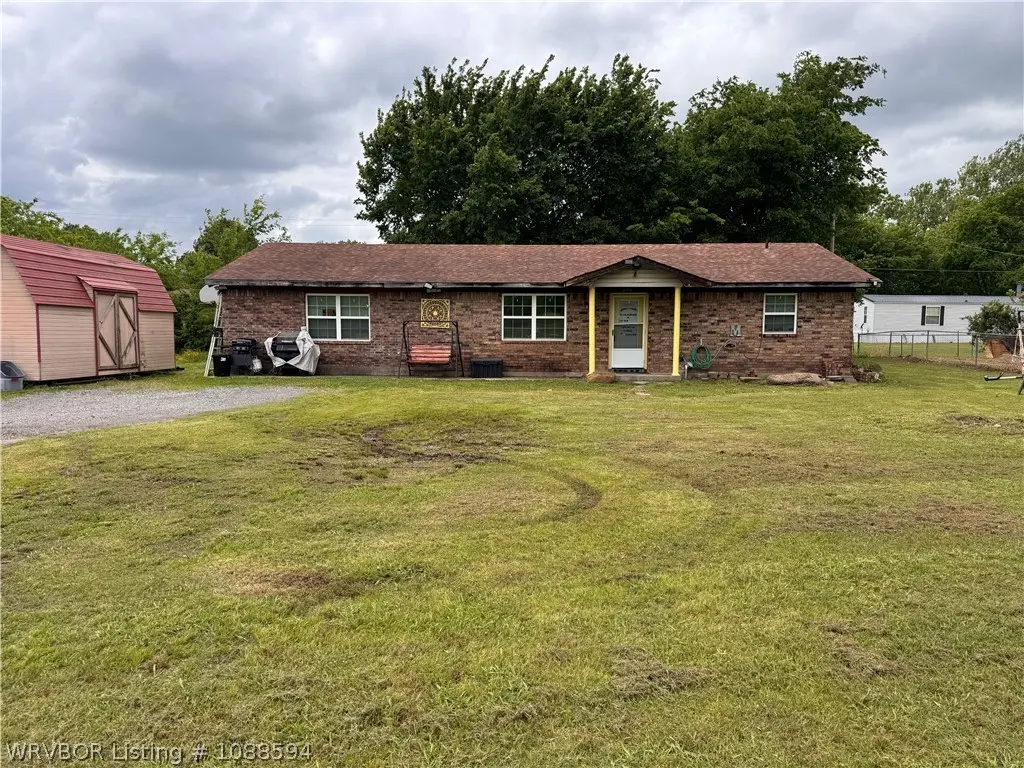
404 Airport Rd · Poteau, OK
Flood risk 3/10 · Minor
- FEMA flood zone
- X (unshaded)
- Chance of flooding over 30 yrs
- 0.2%
- Est. flood insurance / yr
- $507 – $1,088
Fire risk 6/10 · Moderate
- Est. fire insurance / yr
- $2,463 – $4,575
Heat risk 7/10 · Major
- Hot days now (above 114°F)
- 7 days/yr
- Hot days in 30 yrs
- 20 days/yr
Wind risk 2/10 · Minimal
- Chance of severe wind over 30 yrs
- 4.0%
Air-quality risk 2/10 · Minimal
- Unhealthy air days now
- 0 days/yr
- Unhealthy air days in 30 yrs
- 1 days/yr
Risk factors via First Street. Map © Google.
Why this score? — see what drove the D- grade
The composite is a weighted blend of 9 inputs, each scored 0–100. Each bar is that input's sub-score; the figure is the points it added to the 100-point composite (weight × sub-score).
- Cash flow +8.0/30.0
- ARV discount +7.5/15.0
- Appreciation +7.1/10.0
- Livability +2.9/5.0
- 1% rule +2.5/10.0
- Rent growth +2.5/5.0
- Schools +2.5/10.0
- Condition / age +2.5/5.0
- DSCR +2.1/10.0
$1
🖨 Deal sheet 📄 Offer letter ✓ Due diligence
Listing remarks
ESTATE AUCTION MAY 15, 2026 AT 10:00am 3 bedroom, 2 bathroom home located on Airport Road in Poteau, Oklahoma. Sitting on two city lots, this property offers plenty of space both inside and out—perfect for families or simply enjoying extra room to spread out. Close to Schools and Downtown Poteau.
Key facts
- Built 1973
- Listed 39 days
Property features AI
Finance
- Other: Residential property; Additional parcel: 0000-36-07N-25E-0-062-00
Exterior
- Parking: Gravel parking
- Utilities: Electricity available
- Home design: Single-family residence; One story
- Construction: Brick construction; Slab foundation; Asphalt shingle roof
- Exterior features: Cleared, corner city lot; County road frontage; Irregular lot shape; No fencing
Interior
- Flooring: Carpet; Ceramic tile
- Bathrooms: 2 full bathrooms
- Heating & cooling: Central heating; Central air conditioning
- Interior features: Blinds on windows; Electric water heater
- Laundry & utility: Electric dryer hookup
Neighborhood map
What this means for you Summary
Snapshot
- This is a 3-bed/1.0-bath single-family listed at $1.
Deal economics
- At list price, monthly cash flow is $-183 ($-2k/yr) — negative.
- The deal already cash-flows at list — no discount required.
- Meets the 1% rule at list price ($1k rent vs $1).
- Cap rate 5.1% vs local median 3.8% in Poteau — top-decile yield for the area; either an underpriced asset or a hidden risk that comps aren't pricing in. Stress-test before assuming the spread holds.
Location & tenants
- Location reads 57/100 on livability (#485 in OK) — a working-class tenant base; expect higher turnover. Strengths: cost of living A+, housing A+; Watch: crime D+, amenities F, commute F.
- Poteau (town): math 30% / reading 29% proficiency, ranked #68 of 270 in OK (top 25%) — low school quality limits family demand, transient renter base, plan for 1-2y turnover.
- Zoned schools: Poteau Upper Es (math 45% / reading 36%, grade F, #98 of 845 statewide, top 12%, 471 students, 0% FRL); Poteau Hs (math 22% / reading 32%, grade F, #125 of 447 statewide, top 31%, 636 students, 0% FRL) — zoned schools average 0% FRL vs 54% district-wide (54 pts lower); this property's tenant base skews higher-income than the district average.
- Market conditions: 137 active listings in the ZIP; 73 units permitted in Le Flore County in 2024 (0 in 5+ unit buildings).
Forward outlook
- In year one you build about $9k of equity ($1k loan paydown + $8k appreciation (4.2% local appreciation)).
- Le Flore County population projected at -13% by 2050 — secular population decline; favor cash flow + early exit over multi-decade hold.
- By year 5, paydown + projected appreciation supports a ~$38k cash-out refi (75% LTV) — recoverable capital for the next deal without selling this one.
Negotiation context
- It's been on market 39 days — a 3% lower offer ($0) is reasonable based on typical stale-listing flexibility.
Risks & watch-outs
- Watch-outs: property tax is 270396.0% of price.
- Climate carrying-cost: major wildfire risk; extreme-heat days projected 7→20/yr by 2055 (HVAC capex compounding) — expect insurance premiums to compound above CPI over the hold.
Questions for the listing agent
- What do current leases actually rent for vs. the listed asking? Can we see a recent rent roll and the last 12 months of T-12 income?
- It's been on market 39 days. Have you received any prior offers? Is the seller open to a 5% concession, seller financing, or rate buy-down credit?
- Built in 1973 — when were the roof, HVAC, electrical panel, plumbing, and water heater last replaced?
- Property tax is high relative to price — has the assessment been appealed recently, and will the sale trigger a re-assessment?
- Is there a deadline driving the sale (1031 exchange, divorce, estate, relocation)? That informs how much negotiation room exists.
- Schools are F-rated, which usually means shorter tenancies and higher turnover. Who's the typical renter profile here, and what's been the actual vacancy rate?
- Crime grade is D in this area — have there been break-ins, vandalism, or insurance claims at this property in the last 3 years? What carrier currently insures it and at what premium?
- The area grade is low — what's the realistic commute time and amenity access for the typical tenant pool here? Any planned neighborhood developments (good or bad) we should know about?
- What's the average days-on-market for RENTAL listings here right now (not sales)? A rising rental-DOM trend means longer vacancies and softer asking-rent achievability than the comps imply.
- What's the recent tenant-quality profile in this submarket — average credit score on applications, eviction rate, late-payment / NSF rate, and stable-employment percentage? A property-management company in the area should have these aggregated.
- How much new for-sale + rental construction is in the pipeline within 1–3 miles? Heavy new supply typically softens prices + rents 12–24 months out; constrained supply supports both.
Investment metrics
- 1% rule
- 0.75% ✗
- Cap rate
- 5.07%
- Cash-on-cash
- -4.36%
- DSCR
- 0.81
- GRM
- 11.2
CMA / ARV
- ARV (on-the-fly)
- $180,264
- Comps found
- 5
Show comp detail 5 sales within ~0.75 mi
| Address | Dist | Beds/Ba | Sqft | Sold | Price | $/sf | Match |
|---|---|---|---|---|---|---|---|
| 904 S Witte St | 0.44mi | 3/2.0 | 1,536 (-5%) | 1mo | $169,900 | $111 | 66 |
| 901 Reynolds Ave | 0.40mi | 3/2.0 | 1,520 (-6%) | 1mo | $120,000 | $79 | 66 |
| 802 Reynolds Ave | 0.38mi | 3/2.0 | 1,540 (-5%) | 18mo | $143,500 | $93 | 55 |
| 112 Rock Creek Dr | 0.58mi | 4/2.0 (+1) | 1,640 (+1%) | 15mo | $258,000 | $157 | 50 |
| 1112 Grady Ave | 0.47mi | 3/2.0 | 1,400 (-14%) | 14mo | $175,000 | $125 | 40 |
Match score weights: distance 35% · size 25% · config 20% · recency 20%. Top-matched comps best support the ARV.
Projected returns pro-forma
4.22% appreciation · 3.0% rent growth · sell at horizon
- IRR
- 7.1%
- Equity multiple
- 1.44×
- Total profit
- $21,998
- Equity at exit
- $93,749
- IRR
- 9.3%
- Equity multiple
- 2.60×
- Total profit
- $80,749
- Equity at exit
- $155,241
Cash invested: $50,474 (down + closing). Projections, not guarantees.
Landlord ↔ Tenant lean methodology
- Overall (STATE)
- 83 Strongly Landlord-Friendly
- State Oklahoma
- 83 Strongly Landlord-Friendly · R+20
- County
- — inherits STATE
- City
- — inherits STATE
ZIP-level market 74953
- Home prices YoY
- 1.7%
- Active inventory
- 137
Monthly cashflow live
- Estimated rent
- $1,345 medium interval (Pro) →
- Mortgage (P&I)
- −$945
- Tax est. 1.5%
- −$225 /mo · $2,704/yr
- Insurance
- −$75
- HOA
- −$0
- Vacancy / Maint / Mgmt
- −$282
- Net cashflow
- $-183
Break-even live
UW: 25.0% down · 7.5% · 30yr · 1.5% tax · 5.0% vac · 8.0% maint · 8.0% mgmt
Financing live
Cash to close
- Down payment
- $45,066
- Closing costs
- $5,408
- Reserves months
- —
- Total cash needed
- —
Loan-product check · same deal, 3 products live
Conventional
25% down · 7.5% · 30yr
- Down + closing
- —
- Monthly P&I
- —
- Monthly cashflow
- —
- DSCR
- —
- Eligible?
- —
Personal DTI + credit; lowest rate.
DSCR
20% down · 8.5% · 30yr
- Down + closing
- —
- Monthly P&I
- —
- Monthly cashflow
- —
- DSCR
- —
- Eligible?
- —
No personal income docs; deal must DSCR.
Hard money
10% down · 12.0% · 12mo
- Down + closing
- —
- Monthly P&I
- —
- Monthly cashflow
- —
- DSCR
- —
- Eligible?
- —
Short-term bridge; refi at stabilization.
Listing history 7 events
-
2026-06-07statusdays on market $1 Pending 39 DOM
-
2026-06-04days on market $1 Active 38 DOM
-
2026-06-02days on market $1 Active 37 DOM
-
2026-06-01days on market $1 Active 36 DOM
-
2026-05-31days on market $1 Active 35 DOM
-
2026-04-23$1 Active
-
2004-04-15soldstatus $39,500
ⓘ Source: listings_history table (triggers on properties + properties_extension) + one-shot
backfill from property_details.listing_events for pre-trigger history.
Climate risk First Street
- Flood 3/10 Moderate FEMA zone X (unshaded) · 20% chance over 30 yrs
- Wildfire 6/10 Major
- Heat 7/10 Severe 7 d/yr ≥114°F today · 20 d/yr by 30 yrs out
- Wind 2/10 Low 4% chance of damaging wind over 30 yrs
- Air quality 2/10 Low 0 unhealthy d/yr today · 1 by 30 yrs out
Nearby sold comps map
Loading sold comps map…
Walkable amenities ~0.75 mi
Loading nearby amenities…
Taxation est. · year 1
- Rental income
- $16,140
- − Mortgage interest
- −$10,098
- − Property taxes
- −$2,704
- − Insurance
- −$901
- − Repairs & maintenance
- −$1,291
- − Management
- −$1,291
- − Depreciation
- −$5,244
- Taxable loss
- −$5,390
- Est. tax savings @ 24.0%
- +$1,294
- After-tax cash flow
- $-905/yr
For passive investors: Depreciation is non-cash, so a rental often shows a tax loss while cash-flowing — sheltering income. Rental losses are passive: they offset passive income freely, and up to $25,000/yr can offset ordinary (W-2) income if you actively participate and your MAGI is under $100k (phasing out to $0 by $150k); unused losses carry forward. On sale, claimed depreciation is recaptured at up to 25%, and gains may owe capital-gains tax (a 1031 exchange can defer both). Figures are a year-1 estimate at your 24.0% rate — not tax advice; consult a CPA.
Schools (NCES district)
- District
- Poteau
- NCES district ID
- 4024870
- Math proficiency
- 30% ▼ -4.00%
- Reading proficiency
- 29% ▼ -4.00%
- Median HH income
- $42,165
- Composite
- 25.05/100
- National rank
- #7546
- State rank
- #68 of 270 in OK
Livability — Poteau
- Score
- 57/100
- State rank
- #485
- US rank
- #22172
Category grades
Schools grade is shown separately in the Schools card above.
Census & demographics
- Census place
- Poteau, OK
- Population (ZIP)
- 12,284
Population outlook (Le Flore County) Hauer SSP2
- Today (2025)
- 48,504 people
- By 2030
- 47,474 · -2.1%
- By 2040
- 44,914 · -7.4%
- By 2050
- 42,239 · -12.9%
- By 2075
- 35,071 · -27.7%
- By 2100
- 25,949 · -46.5%
Race, ethnicity, and origin ACS 2023
- Neighborhood character
- Predominantly White (70%)
- Race & ethnicity
- White 70% Hispanic / Latino 12% Native American 10% Two or more races 10% Black 1%
- Hispanic origin (detail)
- Mexican 11%
- Common ancestry
- Slovak 2% Iranian 2% Serbian 1%
- Foreign-born
- 7% · Canada
- Languages at home
- 90% English-only · Spanish 10%
Political lean MEDSL · Le Flore
- 2024 margin
- Solid R (+64.8) · D 17.0% · R 81.8% · Other 1.3%
- 2008→2024 swing
- -26.1pp toward R · 2008: -38.6pp · 2024: -64.8pp
- All cycles
- 2024: R+64.8 2020: R+63.4 2016: R+58.7 2012: R+41.1 2008: R+38.6
Not yet ingested
- Civics
- —
Market trends
- HPI YoY
- ▲ 4.22%
- Current HPI
- 252.3937
- Rent YoY
- —
- Metro
- —
- State GDP YoY
- ▲ 1.55%
- F500 in state
- 6
Industry mix (Fortune 500 HQ in OK)
| Industry | F500 HQs | Revenue |
|---|---|---|
| Energy | 3 | $48B |
|
||
Price history
2 events — show timeline
- 2026-04-23 Listed $1 WRVBOR
- 2004-04-15 Sold (Public Records) $39,500 Public Records
Property tax history
+3.3%/yrLatest (2025): $488 · +4.7% YoY. Source: county tax records.
Cash-flow waterfall
monthlySold comps — $/sqft
last 12 mo · ≤1 miLoading sold comps…