95 Orange St · Tuscaloosa, AL
Flood risk 4/10 · Minor
- FEMA flood zone
- X (unshaded)
- Chance of flooding over 30 yrs
- 0.24%
- Est. flood insurance / yr
- $507 – $1,088
Fire risk 1/10 · Minimal
- Est. fire insurance / yr
- $916 – $1,700
Heat risk 7/10 · Major
- Hot days now (above 108°F)
- 7 days/yr
- Hot days in 30 yrs
- 20 days/yr
Wind risk 6/10 · Moderate
- Chance of severe wind over 30 yrs
- 60.0%
Air-quality risk 3/10 · Minor
- Unhealthy air days now
- 2 days/yr
- Unhealthy air days in 30 yrs
- 3 days/yr
Risk factors via First Street. Map © Google.
Why this score? — see what drove the C grade
The composite is a weighted blend of 9 inputs, each scored 0–100. Each bar is that input's sub-score; the figure is the points it added to the 100-point composite (weight × sub-score).
- Cash flow +22.3/30.0
- ARV discount +12.5/15.0
- DSCR +7.1/10.0
- 1% rule +5.0/10.0
- Rent growth +4.1/5.0
- Livability +3.9/5.0
- Schools +2.5/10.0
- Condition / age +2.5/5.0
- Appreciation +0.0/10.0
$145,900
🖨 Deal sheet (PDF) 📄 Offer letter ✓ Due diligence
Listing remarks MLS
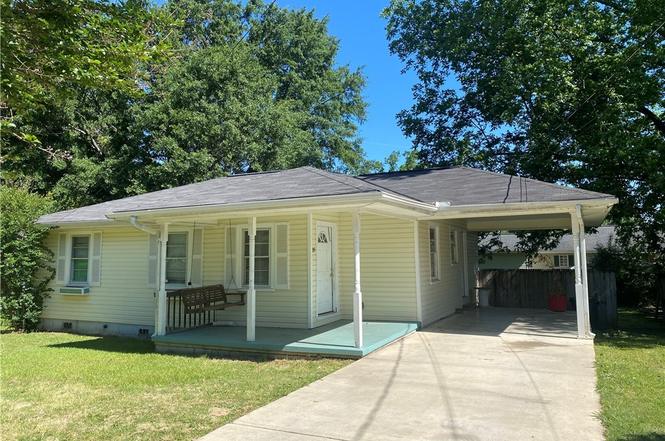
Oh what an adorable home, right in the center of Tuscaloosa! Oh so close to shopping and just minutes from UA; this home is nestled on a level lot - spacious, fenced back yard with patio, deck area ready for entertaining or just relaxing. This is prime property for investment, first time home buyer, retired couple looking to downsize or a student who wants to be centrally located and close to campus. Hardwood flooring and spacious rooms make this quaint home complete with charm and character. Curb appeal and landscaping is top notch - call today to take a private tour.
Key facts
- Front porch swing
- Level yard
- Window boxes
Tags
Neighborhood map
What this means for you Summary
Snapshot
- This is a 2-bed/1.0-bath single-family listed at $146k.
Deal economics
- At list price, monthly cash flow is $241 ($3k/yr) — positive.
- The deal already cash-flows at list — no discount required.
- To meet the 1% rule (rent ≥ 1% of price), the offer needs to be $145k (0.5% below list).
- Recommended offer: $128k (12.0% below list) — sets the bar for market timing.
Location & tenants
- Location reads 77/100 on livability (#9 in AL, #2,909 nationally) — a middle-class / working-renter tenant base. Strengths: amenities A+, health & safety A+, cost of living A; Watch: crime F, employment D-.
- Tuscaloosa City (urban): math 19% / reading 40% proficiency, ranked #74 of 129 in AL (top 57%) — low school quality limits family demand, transient renter base, plan for 1-2y turnover.
- Zoned schools: University Place Elementary School (math 17% / reading 32%, grade F, #424 of 627 statewide, top 68%, 599 students, 64% FRL); Westlawn Middle School (math 0% / reading 18%, grade F, #235 of 257 statewide, top 93%, 534 students, 93% FRL); Central High School (math 12% / reading 17%, grade F, #220 of 305 statewide, top 77%, 783 students, 84% FRL) — zoned schools average 80% FRL vs 59% district-wide (21 pts higher); higher-poverty schools than district average — tighter screening recommended.
- Zoned-school proficiency averages 16% at this address vs 30% district-wide (-13 pts) — the specific schools serving this property underperform the Tuscaloosa City average; the district grade overstates school quality for this exact location.
- Market conditions: Rents rising fast (+6.3%/yr); 307 active listings in the ZIP; 26 comparable units currently listed for rent nearby; rentals lingering (median 46d on market — plan ~5-8 weeks vacancy on turnover, expect pricing pressure); 62% of comp listings sitting > 30 days — soft ceiling on asking rent; lower-income renter base — watch delinquency; 622 units permitted in Tuscaloosa County in 2024 (69 in 5+ unit buildings).
Forward outlook
- Local home prices are declining (-3.0%/yr); year-one equity from $1k of loan paydown is wiped out by about $4k of value loss. Plan a longer hold.
- Tuscaloosa County population projected at +26% by 2050 — long-run rental-demand tailwind backs the buy-and-hold thesis.
- At projected returns (-3.0% appreciation + 6.3% rent growth), your $41k cash investment doubles in ~10 years — after that, you're playing with house money.
Negotiation context
- It's been on market 238 days — a 12% lower offer ($128k) is reasonable based on typical stale-listing flexibility.
- 3 sale attempts since 7y ago with the ask held roughly flat each time — persistent listings suggest the price (not the market) is what's stuck; bring a comps-based counter.
- Current owner paid $97k; list at $146k implies a 50% gain — meaningful room to come down on a strong offer.
Risks & watch-outs
- Watch-outs: built in 1955 — expect roof / HVAC / electrical / plumbing capex.
- Climate carrying-cost: major wind risk, 60% chance of damaging wind over 30y; extreme-heat days projected 7→20/yr by 2055 (HVAC capex compounding) — expect insurance premiums to compound above CPI over the hold.
Questions for the listing agent
- It's been on market 238 days. Have you received any prior offers? Is the seller open to a 12% concession, seller financing, or rate buy-down credit?
- Built in 1955 — when were the roof, HVAC, electrical panel, plumbing, and water heater last replaced?
- Why hasn't it sold? Are there any deal-killer items the seller is aware of (foundation, flood, title, zoning, code violations)?
- Is there a deadline driving the sale (1031 exchange, divorce, estate, relocation)? That informs how much negotiation room exists.
- Crime grade is F in this area — have there been break-ins, vandalism, or insurance claims at this property in the last 3 years? What carrier currently insures it and at what premium?
- What's the average days-on-market for RENTAL listings here right now (not sales)? A rising rental-DOM trend means longer vacancies and softer asking-rent achievability than the comps imply.
- What's the recent tenant-quality profile in this submarket — average credit score on applications, eviction rate, late-payment / NSF rate, and stable-employment percentage? A property-management company in the area should have these aggregated.
- How much new for-sale + rental construction is in the pipeline within 1–3 miles? Heavy new supply typically softens prices + rents 12–24 months out; constrained supply supports both.
Investment metrics
- 1% rule
- 1.00% ✗
- Cap rate
- 8.27%
- Cash-on-cash
- 7.07%
- DSCR
- 1.31
- GRM
- 8.4
CMA / ARV
- ARV (on-the-fly)
- $164,268
- Comps found
- 12
Show comp detail 12 sales within ~0.75 mi
| Address | Dist | Beds/Ba | Sqft | Sold | Price | $/sf | Match |
|---|---|---|---|---|---|---|---|
| 304 Orange St | 0.23mi | 2/1.0 | 928 (-8%) | 4mo | $75,000 | $81 | 72 |
| 301 Orange St | 0.22mi | 2/1.0 | 960 (-5%) | 13mo | $160,000 | $167 | 70 |
| 2917 Narrow Lane Rd | 0.10mi | 2/1.0 | 888 (-12%) | 10mo | $160,000 | $180 | 66 |
| 2506 4th Ave E | 0.29mi | 2/2.0 | 912 (-10%) | 1mo | $131,500 | $144 | 65 |
| 10 Arlington Dr | 0.31mi | 2/1.0 | 916 (-10%) | 9mo | $155,000 | $169 | 62 |
| 405 26th St St E | 0.33mi | 2/1.0 | 912 (-10%) | 9mo | $115,000 | $126 | 61 |
| 2609 5th Ave E | 0.39mi | 3/2.0 (+1) | 1,086 (+7%) | 10mo | $101,000 | $93 | 52 |
| 2502 E 5th Ave E | 0.38mi | 3/1.0 (+1) | 1,160 (+14%) | 3mo | $187,500 | $162 | 51 |
| 2009 3rd Ct E | 0.62mi | 3/2.0 (+1) | 1,092 (+8%) | 11mo | $240,000 | $220 | 40 |
| 624 James I Harrison Parkway Pkwy | 0.69mi | 3/1.5 (+1) | 1,158 (+14%) | 2mo | $115,000 | $99 | 36 |
| 3102 4th Ct E | 0.43mi | 3/2.0 (+1) | 1,161 (+14%) | 15mo | $210,000 | $181 | 34 |
| 3406 Highland Oaks Dr | 0.71mi | 3/2.0 (+1) | 1,128 (+11%) | 9mo | $169,000 | $150 | 32 |
Match score weights: distance 35% · size 25% · config 20% · recency 20%. Top-matched comps best support the ARV.
Projected returns pro-forma
-3.0% appreciation · 6.29% rent growth · sell at horizon
- IRR
- -2.1%
- Equity multiple
- 0.92×
- Total profit
- $-3,381
- Equity at exit
- $21,754
- IRR
- 10.6%
- Equity multiple
- 1.94×
- Total profit
- $38,443
- Equity at exit
- $12,615
Cash invested: $40,852 (down + closing). Projections, not guarantees.
Landlord ↔ Tenant lean methodology
- Overall (STATE)
- 90 Strongly Landlord-Friendly
- State Alabama
- 90 Strongly Landlord-Friendly · R+15
- County
- — inherits STATE
- City
- — inherits STATE
ZIP-level market 35401
- Rents YoY
- 6.3%
- Active inventory
- 307
- Price-to-rent
- 8.4×
Monthly cashflow live
- Estimated rent
- $1,452 high interval (Pro) →
- Mortgage (P&I)
- −$765
- Tax from tax record
- −$81 /mo · $968/yr
- Insurance
- −$61
- HOA
- −$0
- Vacancy / Maint / Mgmt
- −$305
- Net cashflow
- $241
Break-even live
Sensitivity live
| Price | -10% $323 | -5% $282 | +0% $241 | +5% $199 | +10% $158 |
|---|---|---|---|---|---|
| Rent | -10% $126 | -5% $183 | +0% $241 | +5% $298 | +10% $356 |
| Rate | -1.0pp $314 | -0.5pp $278 | base $241 | +0.5pp $203 | +1.0pp $165 |
UW: 25.0% down · 7.5% · 30yr · 1.5% tax · 5.0% vac · 8.0% maint · 8.0% mgmt
Financing live
Cash to close
- Down payment
- $36,475
- Closing costs
- $4,377
- Reserves months
- —
- Total cash needed
- —
Loan-product check · same deal, 3 products live
Conventional
25% down · 7.5% · 30yr
- Down + closing
- —
- Monthly P&I
- —
- Monthly cashflow
- —
- DSCR
- —
- Eligible?
- —
Personal DTI + credit; lowest rate.
DSCR
20% down · 8.5% · 30yr
- Down + closing
- —
- Monthly P&I
- —
- Monthly cashflow
- —
- DSCR
- —
- Eligible?
- —
No personal income docs; deal must DSCR.
Hard money
10% down · 12.0% · 12mo
- Down + closing
- —
- Monthly P&I
- —
- Monthly cashflow
- —
- DSCR
- —
- Eligible?
- —
Short-term bridge; refi at stabilization.
Rent comps 26 comps
| Address | Beds | Baths | Sqft | Rent | $/sqft | DOM | Units | Dist |
|---|---|---|---|---|---|---|---|---|
| 3014 3rd Ct E Tuscaloosa, AL | 3.0 | 2.0 | 1449 | $1,675 | $1.16 | 15d | 1 | 0.28mi |
| 302 22nd St E Tuscaloosa, AL | 3.0 | 2.0 | 1150 | $1,475 | $1.28 | 23d | 1 | 0.52mi |
| 632 23rd St E Tuscaloosa, AL | 2.0 | 1.5 | 960 | $1,058 | $1.10 | 23d | 2 | 0.65mi |
| 235 James I Harrison Jr Pkwy E Tuscaloosa, AL | 1.0–3.0 | 1.0–2.0 | 1259 | $984 | $0.78 | 45d | 37 | 0.66mi |
| 621 E 33rd St Unit D Tuscaloosa, AL | 2.0 | 1.0 | 1000 | $925 | $0.93 | 45d | 1 | 0.66mi |
| 3820 1st Ave Tuscaloosa, AL | 1.0–3.0 | 1.0–2.0 | 835 | $1,044 | $1.25 | 45d | 11 | 0.68mi |
| 713 33rd St E Tuscaloosa, AL | 2.0 | 2.0 | 1036 | $815 | $0.79 | 45d | 1 | 0.71mi |
| 1901 5th Ave E Tuscaloosa, AL | 3.0 | 3.0 | 1336 | $2,300 | $1.72 | 23d | 1 | 0.74mi |
| 1813 Hackberry Ln Tuscaloosa, AL | 2.0 | 2.0 | 894 | $1,450 | $1.62 | 45d | 1 | 0.82mi |
| 1915 6th Ave Tuscaloosa, AL | 2.0 | 2.5 | 1290 | $1,195 | $0.93 | 23d | 1 | 0.84mi |
| 1925 8th Ave Tuscaloosa, AL | 1.0–2.0 | 1.0 | 794 | $1,054 | $1.33 | 15d | 1 | 0.86mi |
| 20 16th St Tuscaloosa, AL | 1.0–3.0 | 1.0–3.0 | 1320 | $2,400 | $1.82 | 45d | 4 | 0.91mi |
| 80 16th St Unit 1-8 Tuscaloosa, AL | 1.0–3.0 | 1.0–3.0 | 1320 | $2,400 | $1.82 | 45d | 4 | 0.91mi |
| 1805 8th Ave Tuscaloosa, AL | 1.0–2.0 | 1.0–2.0 | 1175 | $1,380 | $1.17 | 45d | 1 | 0.95mi |
| 900 Hargrove Rd Tuscaloosa, AL | 1.0–2.0 | 1.0–2.0 | 836 | $1,089 | $1.30 | 45d | 1 | 0.98mi |
| 3504 12th Ave E Tuscaloosa, AL | 2.0 | 1.0–1.5 | 1019 | $1,037 | $1.02 | 45d | 10 | 1.01mi |
| 502 16th St Unit 6 Tuscaloosa, AL | 3.0 | 3.0 | 1480 | $2,000 | $1.35 | 23d | 1 | 1.01mi |
| 380 14th Pl E Tuscaloosa, AL | 2.0 | 2.0 | 1440 | $1,850 | $1.28 | 45d | 1 | 1.06mi |
| 13 Meadowlawn Tuscaloosa, AL | 3.0 | 1.5 | 1260 | $1,100 | $0.87 | 45d | 1 | 1.08mi |
| 1415 2nd East Ct Tuscaloosa, AL | 2.0 | 1.5 | 1033 | $2,200 | $2.13 | 45d | 1 | 1.08mi |
| 1800 Hargrove East Rd Tuscaloosa, AL | 2.0 | 1.0 | 950 | $875 | $0.92 | 15d | 1 | 1.35mi |
| 715 Dogwood Ln Tuscaloosa, AL | 2.0 | 1.0 | 1126 | $1,099 | $0.98 | 15d | 3 | 1.36mi |
| 917 Homewood Dr Tuscaloosa, AL | 3.0 | 3.0 | 1500 | $3,600 | $2.40 | 45d | 1 | 1.41mi |
| 3809 Millcreek Ln Tuscaloosa, AL | 3.0 | 1.5 | 1289 | $1,395 | $1.08 | 45d | 1 | 1.41mi |
| 1505 18th St Tuscaloosa, AL | 2.0 | 2.0 | 700 | $1,000 | $1.43 | 45d | 1 | 1.45mi |
| 1105 Skyland Blvd E Tuscaloosa, AL | 1.0 | 1.0 | 832 | $879 | $1.06 | 15d | 3 | 1.47mi |
Listing history 23 events
-
2026-06-21days on market $145,900 Active 238 DOM
-
2026-06-18days on market $145,900 Active 235 DOM
-
2026-06-17days on market $145,900 Active 234 DOM
-
2026-06-16days on market $145,900 Active 233 DOM
-
2026-06-15days on market $145,900 Active 232 DOM
-
2026-06-14days on market $145,900 Active 230 DOM
-
2026-06-13days on market $145,900 Active 229 DOM
-
2026-06-10days on market $145,900 Active 227 DOM
-
2026-06-09days on market $145,900 Active 226 DOM
-
2026-06-08days on market $145,900 Active 225 DOM
-
2026-06-07days on market $145,900 Active 224 DOM
-
2026-06-05days on market $145,900 Active 221 DOM
-
2026-06-03days on market $145,900 Active 220 DOM
-
2026-06-02days on market $145,900 Active 219 DOM
-
2026-06-01days on market $145,900 Active 218 DOM
-
2026-05-31days on market $145,900 Active 217 DOM
-
2026-05-30days on market $145,900 Active 216 DOM
-
2026-03-19status Pending
-
2026-02-15price $145,900
-
2025-08-19$149,900 Active
-
2019-09-27soldstatus $97,000 576-char remark
Show marketing remark (576 chars)
Oh what an adorable home, right in the center of Tuscaloosa! Oh so close to shopping and just minutes from UA; this home is nestled on a level lot - spacious, fenced back yard with patio, deck area ready for entertaining or just relaxing. This is prime property for investment, first time home buyer, retired couple looking to downsize or a student who wants to be centrally located and close to campus. Hardwood flooring and spacious rooms make this quaint home complete with charm and character. Curb appeal and landscaping is top notch - call today to take a private tour.
-
2019-08-01$104,900 576-char remark
Show marketing remark (576 chars)
Oh what an adorable home, right in the center of Tuscaloosa! Oh so close to shopping and just minutes from UA; this home is nestled on a level lot - spacious, fenced back yard with patio, deck area ready for entertaining or just relaxing. This is prime property for investment, first time home buyer, retired couple looking to downsize or a student who wants to be centrally located and close to campus. Hardwood flooring and spacious rooms make this quaint home complete with charm and character. Curb appeal and landscaping is top notch - call today to take a private tour.
-
2019-05-17$104,900
ⓘ Source: listings_history table (triggers on properties + properties_extension) + one-shot
backfill from property_details.listing_events for pre-trigger history.
Tax reassessment forecast AL · Resets to sale price
- Current annual tax
- $968 · $81/mo
- Projected year-2 tax
- $968 · $81/mo
- Expected delta
- $0/yr ($0/mo · 0.0%)
ⓘ Screening estimate from a state-policy table — verify with the county assessor before closing.
Climate risk First Street
- Flood 4/10 Moderate FEMA zone X (unshaded) · 24% chance over 30 yrs
- Wildfire 1/10 Low
- Heat 7/10 Severe 7 d/yr ≥108°F today · 20 d/yr by 30 yrs out
- Wind 6/10 Major 60% chance of damaging wind over 30 yrs
- Air quality 3/10 Moderate 2 unhealthy d/yr today · 3 by 30 yrs out
Nearby sold comps map
Loading sold comps map…
Walkable amenities ~0.75 mi
Loading nearby amenities…
Taxation est. · year 1
- Rental income
- $17,428
- − Mortgage interest
- −$8,173
- − Property taxes
- −$968
- − Insurance
- −$730
- − Repairs & maintenance
- −$1,394
- − Management
- −$1,394
- − Depreciation
- −$4,244
- Taxable income
- $525
- Est. tax owed @ 24.0%
- −$126
- After-tax cash flow
- $2,763/yr
For passive investors: Depreciation is non-cash, so a rental often shows a tax loss while cash-flowing — sheltering income. Rental losses are passive: they offset passive income freely, and up to $25,000/yr can offset ordinary (W-2) income if you actively participate and your MAGI is under $100k (phasing out to $0 by $150k); unused losses carry forward. On sale, claimed depreciation is recaptured at up to 25%, and gains may owe capital-gains tax (a 1031 exchange can defer both). Figures are a year-1 estimate at your 24.0% rate — not tax advice; consult a CPA.
Schools (NCES district)
- District
- Tuscaloosa City
- NCES district ID
- 0103360
- Math proficiency
- 19% ▼ -24.00%
- Reading proficiency
- 40% ▼ -1.00%
- Median HH income
- $37,474
- Composite
- 24.51/100
- National rank
- #7647
- State rank
- #74 of 129 in AL
Livability — Tuscaloosa
- Score
- 77/100
- State rank
- #9
- US rank
- #2909
Category grades
Schools grade is shown separately in the Schools card above.
Census & demographics
- Census place
- Tuscaloosa, AL
- County
- Tuscaloosa County · 206,491 people
- City population
- 134,228
- Metro
- Tuscaloosa, AL
- Population (ZIP)
- 43,459
- Household income
- $29,152
- Rent vs Own
- Severe rent burden
- 3997.0
Population outlook (Tuscaloosa County) Hauer SSP2
- Today (2025)
- 228,293 people
- By 2030
- 240,551 · +5.4%
- By 2040
- 263,856 · +15.6%
- By 2050
- 286,491 · +25.5%
- By 2075
- 335,783 · +47.1%
- By 2100
- 370,520 · +62.3%
Race, ethnicity, and origin ACS 2023
- Neighborhood character
- Diverse neighborhood (Simpson 0.58)
- Race & ethnicity
- Black 47% White 44% Hispanic / Latino 5% Two or more races 4% Asian 2%
- Common ancestry
- Slovak 2% Italian 1% Romanian 1%
- Foreign-born
- 3% · Canada, China
- Languages at home
- 96% English-only · Spanish 2% Other Indo-European 1% Chinese 1%
Political lean MEDSL · Tuscaloosa
- 2024 margin
- Strong R (+20.4) · D 39.4% · R 59.8%
- 2008→2024 swing
- -4.4pp toward R · 2008: -16.0pp · 2024: -20.4pp
- All cycles
- 2024: R+20.4 2020: R+14.8 2016: R+19.5 2012: R+17.4 2008: R+16.0
Not yet ingested
- Civics
- —
Market trends
- HPI YoY
- ▼ -191.40%
- Current HPI
- 179.8335
- Rent YoY
- ▲ 6.29%
- Metro
- Tuscaloosa, AL
- State GDP YoY
- ▲ 2.94%
- F500 in state
- 4
Industry mix (Fortune 500 HQ in AL)
| Industry | F500 HQs | Revenue |
|---|---|---|
| Financial Services | 1 | $8B |
|
||
| Healthcare | 1 | $5B |
|
||
Price history
+39.1% since first listed6 events — show timeline
- 2026-03-19 Pending — WAMLS
- 2026-02-15 Price Changed $145,900 WAMLS
- 2025-08-19 Listed $149,900 WAMLS
- 2019-09-27 Sold (MLS) $97,000 WAMLS
- 2019-08-01 Listed $104,900 WAMLS
- 2019-05-17 Listed $104,900 WAMLS
Property tax history
+12.0%/yrLatest (2025): $968 · +6.9% YoY. Source: county tax records.
Cash-flow waterfall
monthlySold comps — $/sqft
last 12 mo · ≤1 miLoading sold comps…