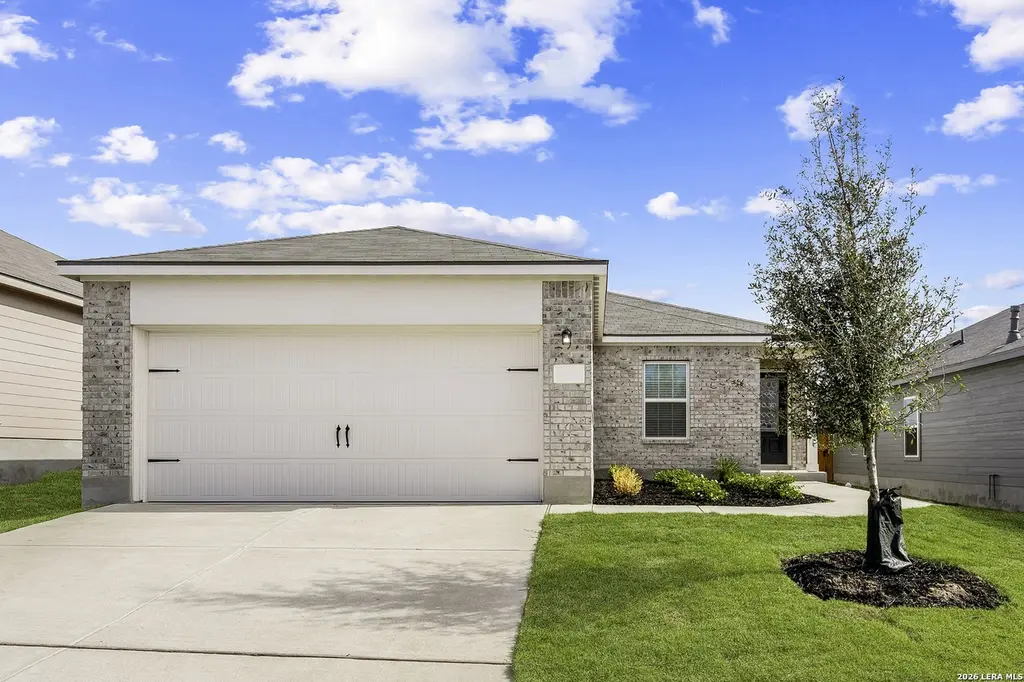
15310 Waterow Vw · San Antonio, TX
Flood risk 1/10 · Minimal
- FEMA flood zone
- X (unshaded)
- Chance of flooding over 30 yrs
- 0.0%
- Est. flood insurance / yr
- $507 – $1,088
Fire risk 5/10 · Moderate
- Est. fire insurance / yr
- $1,222 – $2,270
Heat risk 8/10 · Major
- Hot days now (above 109°F)
- 7 days/yr
- Hot days in 30 yrs
- 22 days/yr
Wind risk 8/10 · Major
- Chance of severe wind over 30 yrs
- 80.0%
Air-quality risk 2/10 · Minimal
- Unhealthy air days now
- 0 days/yr
- Unhealthy air days in 30 yrs
- 1 days/yr
Risk factors via First Street. Map © Google.
Why this score? — see what drove the D grade
The composite is a weighted blend of 9 inputs, each scored 0–100. Each bar is that input's sub-score; the figure is the points it added to the 100-point composite (weight × sub-score).
- ARV discount +13.6/15.0
- Appreciation +6.3/10.0
- Cash flow +6.2/30.0
- Livability +4.0/5.0
- 1% rule +2.5/10.0
- Rent growth +2.5/5.0
- Condition / age +2.5/5.0
- Schools +2.2/10.0
- DSCR +0.5/10.0
$234,900
🖨 Deal sheet (PDF) 📄 Offer letter ✓ Due diligence
Listing remarks
Welcome home to the charming Bay plan at Preserve at Medina. This remarkable home features 3 bedrooms, 2 baths, a chef-ready kitchen, spacious master suite and an incredible open layout allowing you to easily flow from room to room. Upgrades featured throughout the Bay plan include a full suite of energy-efficient kitchen appliances, granite countertops, luxury vinyl plank flooring and more. Homeowners at Preserve at Medina enjoy living within a premier, family-friendly community near San Antonio.
Key facts
- Chef-ready kitchen
- Granite countertops
- 4,356 sq ft lot
Tags
Property features AI
Finance
- Other: Subdivision: Preserve at Medina; Possession at closing/funding; For sale
- HOA & community: Mandatory HOA; HOA fee $432 annually
Exterior
- Parking: Attached 2-car garage
- Utilities: Electricity supplied by CPS Energy; Water supplied by SAWS; Sewer supplied by SAWS; Connected to water and sewer systems
- Home design: New construction by LGI Homes; Brick, stone/rock and siding exterior
- Construction: Approximate age: 4 years; Slab foundation; Composition roof
- Exterior features: Park / playground in community; BBQ / grill area in community
Interior
- Kitchen: Stove/Range; Refrigerator; Dishwasher; Island
- Bedrooms: Master bedroom with walk-in closet and full bath (11 x 17); Bedroom 2 (12 x 10); Bedroom 3 (11 x 11)
- Flooring: Carpeting; Vinyl flooring
- Bathrooms: Two full bathrooms; Master bath with tub/shower combination and single vanity (14 x 9)
- Heating & cooling: Central heating (electric); Central air conditioning
- Interior features: Island kitchen; Utility room inside; Ground level / no steps; Open floor plan; Cable TV available; High speed internet; Some window coverings remain; Washer connection; Dryer connection; Disposal; Vent fan; Smoke alarm
- Laundry & utility: Washer connection; Dryer connection; 6 x 6 utility room
Neighborhood map
What this means for you Summary
Snapshot
- This is a 3-bed/2.0-bath single-family listed at $235k.
Deal economics
- At list price, monthly cash flow is $-430 ($-5k/yr) — negative.
- To cash-flow at today's rent, offer at most $159k (32.4% below list).
- To meet the 1% rule (rent ≥ 1% of price), the offer needs to be $175k (25.4% below list).
- Recommended offer: $159k (32.4% below list) — sets the bar for cash-flow.
Location & tenants
- Location reads 80/100 on livability (#31 in TX, #1,616 nationally) — a professional / high-income tenant draw. Strengths: amenities A+, commute A+, cost of living A+; Watch: crime F.
- Southwest ISD (rural): math 21% / reading 31% proficiency, ranked #701 of 826 in TX (top 85%) — low school quality limits family demand, transient renter base, plan for 1-2y turnover; 75% free/reduced lunch — lower-income household profile, screen leases tightly.
- Zoned schools: Spicewood Park El (math 16% / reading 23%, grade F, #3,583 of 4,322 statewide, top 86%, 593 students, 93% FRL); Ronald E Mcnair Middle (math 27% / reading 31%, grade F, #1,103 of 1,662 statewide, top 67%, 748 students, 77% FRL); Southwest H S (math 17% / reading 39%, grade F, #1,170 of 1,632 statewide, top 72%, 2,152 students, 72% FRL).
- Market conditions: 323 active listings in the ZIP; 18 comparable units currently listed for rent nearby; rentals at typical pace (median 20d on market — plan ~3-4 weeks tenant-placement turnaround); 8,308 units permitted in Bexar County in 2024 (2,506 in 5+ unit buildings).
Forward outlook
- In year one you build about $8k of equity ($2k loan paydown + $6k appreciation (2.6% local appreciation)).
- Bexar County population projected at +50% by 2050 — long-run rental-demand tailwind backs the buy-and-hold thesis.
- By year 5, paydown + projected appreciation supports a ~$34k cash-out refi (75% LTV) — recoverable capital for the next deal without selling this one.
Negotiation context
- It's been on market 31 days — a 3% lower offer ($228k) is reasonable based on typical stale-listing flexibility.
- 4 sale attempts since 3y ago with the ask held roughly flat each time — persistent listings suggest the price (not the market) is what's stuck; bring a comps-based counter.
Risks & watch-outs
- Climate carrying-cost: severe wind risk, 80% chance of damaging wind over 30y; moderate wildfire risk; extreme-heat days projected 7→22/yr by 2055 (HVAC capex compounding) — expect insurance premiums to compound above CPI over the hold.
Questions for the listing agent
- What do current leases actually rent for vs. the listed asking? Can we see a recent rent roll and the last 12 months of T-12 income?
- It's been on market 31 days. Have you received any prior offers? Is the seller open to a 32% concession, seller financing, or rate buy-down credit?
- What does the HOA fee cover, when was the last increase, and are there any pending special assessments or reserve-fund shortfalls?
- Is there a deadline driving the sale (1031 exchange, divorce, estate, relocation)? That informs how much negotiation room exists.
- Crime grade is F in this area — have there been break-ins, vandalism, or insurance claims at this property in the last 3 years? What carrier currently insures it and at what premium?
- The area grade is low — what's the realistic commute time and amenity access for the typical tenant pool here? Any planned neighborhood developments (good or bad) we should know about?
- What's the average days-on-market for RENTAL listings here right now (not sales)? A rising rental-DOM trend means longer vacancies and softer asking-rent achievability than the comps imply.
- What's the recent tenant-quality profile in this submarket — average credit score on applications, eviction rate, late-payment / NSF rate, and stable-employment percentage? A property-management company in the area should have these aggregated.
- How much new for-sale + rental construction is in the pipeline within 1–3 miles? Heavy new supply typically softens prices + rents 12–24 months out; constrained supply supports both.
Investment metrics
- 1% rule
- 0.75% ✗
- Cap rate
- 4.09%
- Cash-on-cash
- -7.85%
- DSCR
- 0.65
- GRM
- 11.2
CMA / ARV
- ARV (median comp)
- $271,735
- List price
- $234,900
- Delta
- -13.56%
- Verdict
- UNDERPRICED
- Comps
- 20 within 1.0 mi
Show comp detail 12 sales within ~0.75 mi
| Address | Dist | Beds/Ba | Sqft | Sold | Price | $/sf | Match |
|---|---|---|---|---|---|---|---|
| 15238 Walcott Rdg | 0.14mi | 3/2.5 | 1,301 (-1%) | 0mo | $194,450 | $149 | 89 |
| 15531 Clove Spice | 0.25mi | 3/2.0 | 1,365 (+3%) | 1mo | $196,080 | $144 | 82 |
| 15434 Lemon Pepper Crk | 0.30mi | 3/2.0 | 1,434 (+9%) | 5mo | $253,000 | $176 | 68 |
| 4243 Marjoram Lndg | 0.37mi | 3/2.0 | 1,434 (+9%) | 2mo | $238,610 | $166 | 67 |
| 4231 Paprika Grv | 0.37mi | 3/2.5 | 1,470 (+11%) | 1mo | $241,170 | $164 | 61 |
| 4247 Paprika Grv | 0.41mi | 3/2.5 | 1,470 (+11%) | 1mo | $245,670 | $167 | 59 |
| 4246 Paprika Grv | 0.43mi | 3/2.0 | 1,156 (-12%) | 2mo | $233,109 | $202 | 58 |
| 15435 Mint Patch Mdw | 0.47mi | 3/2.5 | 1,470 (+11%) | 3mo | $240,670 | $164 | 54 |
| 15503 Mint Patch Mdw | 0.48mi | 3/2.0 | 1,156 (-12%) | 4mo | $214,610 | $186 | 54 |
| 15514 Mint Patch Mdw | 0.44mi | 3/2.0 | 1,156 (-12%) | 6mo | $233,109 | $202 | 54 |
| 4307 Common Sage | 0.56mi | 3/2.5 | 1,470 (+11%) | 1mo | $245,310 | $167 | 52 |
| 15523 Mint Patch Mdw | 0.48mi | 3/2.5 | 1,470 (+11%) | 6mo | $254,499 | $173 | 52 |
Match score weights: distance 35% · size 25% · config 20% · recency 20%. Top-matched comps best support the ARV.
Projected returns pro-forma
2.6% appreciation · 3.0% rent growth · sell at horizon
- IRR
- -1.1%
- Equity multiple
- 0.94×
- Total profit
- $-3,885
- Equity at exit
- $100,385
- IRR
- 3.2%
- Equity multiple
- 1.47×
- Total profit
- $31,029
- Equity at exit
- $150,751
Cash invested: $65,772 (down + closing). Projections, not guarantees.
Landlord ↔ Tenant lean methodology
- Overall (STATE)
- 87 Strongly Landlord-Friendly
- State Texas
- 87 Strongly Landlord-Friendly · R+5
- County
- — inherits STATE
- City
- — inherits STATE
ZIP-level market 78073
- Home prices YoY
- 0.9%
- Active inventory
- 323
- Price-to-rent
- 11.2×
Monthly cashflow live
- Estimated rent
- $1,753 high interval (Pro) →
- Mortgage (P&I)
- −$1,232
- Tax from tax record
- −$449 /mo · $5,389/yr
- Insurance
- −$98
- HOA
- −$36
- Vacancy / Maint / Mgmt
- −$368
- Net cashflow
- $-430
Break-even live
Sensitivity live
| Price | -10% $-297 | -5% $-364 | +0% $-430 | +5% $-497 | +10% $-563 |
|---|---|---|---|---|---|
| Rent | -10% $-569 | -5% $-500 | +0% $-430 | +5% $-361 | +10% $-292 |
| Rate | -1.0pp $-312 | -0.5pp $-371 | base $-430 | +0.5pp $-491 | +1.0pp $-553 |
UW: 25.0% down · 7.5% · 30yr · 1.5% tax · 5.0% vac · 8.0% maint · 8.0% mgmt
Financing live
Cash to close
- Down payment
- $58,725
- Closing costs
- $7,047
- Reserves months
- —
- Total cash needed
- —
Loan-product check · same deal, 3 products live
Conventional
25% down · 7.5% · 30yr
- Down + closing
- —
- Monthly P&I
- —
- Monthly cashflow
- —
- DSCR
- —
- Eligible?
- —
Personal DTI + credit; lowest rate.
DSCR
20% down · 8.5% · 30yr
- Down + closing
- —
- Monthly P&I
- —
- Monthly cashflow
- —
- DSCR
- —
- Eligible?
- —
No personal income docs; deal must DSCR.
Hard money
10% down · 12.0% · 12mo
- Down + closing
- —
- Monthly P&I
- —
- Monthly cashflow
- —
- DSCR
- —
- Eligible?
- —
Short-term bridge; refi at stabilization.
Rent comps 18 comps
| Address | Beds | Baths | Sqft | Rent | $/sqft | DOM | Units | Dist |
|---|---|---|---|---|---|---|---|---|
| 15315 Waterow Vw Von Ormy, TX | 3.0–5.0 | 2.0–3.5 | 1781 | $1,855 | $1.04 | 0d | 1 | 0.06mi |
| 15319 Escalante Pass Von Ormy, TX | 3.0 | 2.0 | 1428 | $2,000 | $1.40 | 0d | 1 | 0.13mi |
| 15226 Walcott Rdg Von Ormy, TX | 3.0 | 2.5 | 1297 | $1,700 | $1.31 | 25d | 1 | 0.17mi |
| 15266 Snug Harbor Way Von Ormy, TX | 3.0 | 2.5 | 1525 | $1,647 | $1.08 | 3d | 1 | 0.18mi |
| 4042 Bay Leaf Loop Von Ormy, TX | 3.0 | 2.0 | 1296 | $1,600 | $1.23 | 45d | 1 | 0.18mi |
| 15115 Harbor Lndg Von Ormy, TX | 4.0 | 2.0 | 1794 | $1,795 | $1.00 | 16d | 1 | 0.21mi |
| 15531 Clove Spice Way Von Ormy, TX | 3.0 | 2.0 | 1296 | $1,595 | $1.23 | 6d | 1 | 0.22mi |
| 15531 Clove Spice Way Von Ormy, TX | 3.0 | 2.0 | 1296 | $1,595 | $1.23 | 22d | 1 | 0.22mi |
| 15706 Clove Spice Way Von Ormy, TX | 3.0 | 2.0 | 1535 | $1,650 | $1.07 | 0d | 1 | 0.24mi |
| 15027 Harbor Lndg Von Ormy, TX | 3.0 | 2.0 | 1526 | $1,850 | $1.21 | 25d | 1 | 0.24mi |
| 15115 Jetfire Pt Von Ormy, TX | 3.0 | 2.0 | 1526 | $1,800 | $1.18 | 45d | 1 | 0.25mi |
| 15115 Jetfire Pt Von Ormy, TX | 3.0 | 2.0 | 1525 | $1,800 | $1.18 | 19d | 1 | 0.25mi |
| 15115 Jetfire Pt Von Ormy, TX | 3.0 | 2.0 | 1526 | $1,800 | $1.18 | 6d | 1 | 0.25mi |
| 15619 Garam Trl Von Ormy, TX | 3.0 | 2.5 | 1856 | $1,755 | $0.95 | 45d | 1 | 0.26mi |
| 3819 Leighton Hbr Von Ormy, TX | 3.0 | 2.5 | 1430 | $1,700 | $1.19 | 25d | 1 | 0.28mi |
| 4231 Paprika Grv Von Ormy, TX | 3.0 | 3.0 | 1470 | $1,723 | $1.17 | 0d | 1 | 0.35mi |
| 4218 Paprika Grv Von Ormy, TX | 3.0 | 2.0 | 1434 | $1,595 | $1.11 | 45d | 1 | 0.35mi |
| 4323 Caraway Bay Von Ormy, TX | 3.0–4.0 | 2.0 | 1572 | $2,129 | $1.35 | 0d | 6 | 0.53mi |
HOA detail
- Monthly dues
- $36 · $432/yr
Listing history 18 events
-
2026-06-15days on market $234,900 Active 31 DOM
-
2026-06-13days on market $234,900 Active 29 DOM
-
2026-06-09days on market $234,900 Active 25 DOM
-
2026-06-08days on market $234,900 Active 24 DOM
-
2026-06-07days on market $234,900 Active 23 DOM
-
2026-06-04days on market $234,900 Active 20 DOM
-
2026-06-03days on market $234,900 Active 19 DOM
-
2026-06-02days on market $234,900 Active 18 DOM
-
2026-06-01days on market $234,900 Active 17 DOM
-
2026-05-31days on market $234,900 Active 16 DOM
-
2026-05-15$234,900 New 502-char remark
-
2024-02-16historical $1,775
-
2024-01-31$1,775
-
2024-01-21historical $1,775
-
2024-01-09price $1,775
-
2023-12-29
-
2023-12-14historical
-
2023-11-22
ⓘ Source: listings_history table (triggers on properties + properties_extension) + one-shot
backfill from property_details.listing_events for pre-trigger history.
Tax reassessment forecast TX · Resets to sale price
- Current annual tax
- $5,389 · $449/mo
- Projected year-2 tax
- $5,389 · $449/mo
- Expected delta
- $0/yr ($0/mo · 0.0%)
ⓘ Screening estimate from a state-policy table — verify with the county assessor before closing.
Climate risk First Street
- Flood 1/10 Low FEMA zone X (unshaded) · 0% chance over 30 yrs
- Wildfire 5/10 Major
- Heat 8/10 Severe 7 d/yr ≥109°F today · 22 d/yr by 30 yrs out
- Wind 8/10 Severe 80% chance of damaging wind over 30 yrs
- Air quality 2/10 Low 0 unhealthy d/yr today · 1 by 30 yrs out
Nearby sold comps map
Loading sold comps map…
Walkable amenities ~0.75 mi
Loading nearby amenities…
Taxation est. · year 1
- Rental income
- $21,031
- − Mortgage interest
- −$13,158
- − Property taxes
- −$5,389
- − Insurance
- −$1,174
- − Repairs & maintenance
- −$1,682
- − Management
- −$1,682
- − HOA
- −$432
- − Depreciation
- −$6,833
- Taxable loss
- −$9,321
- Est. tax savings @ 24.0%
- +$2,237
- After-tax cash flow
- $-2,926/yr
For passive investors: Depreciation is non-cash, so a rental often shows a tax loss while cash-flowing — sheltering income. Rental losses are passive: they offset passive income freely, and up to $25,000/yr can offset ordinary (W-2) income if you actively participate and your MAGI is under $100k (phasing out to $0 by $150k); unused losses carry forward. On sale, claimed depreciation is recaptured at up to 25%, and gains may owe capital-gains tax (a 1031 exchange can defer both). Figures are a year-1 estimate at your 24.0% rate — not tax advice; consult a CPA.
Schools (NCES district)
- District
- Southwest ISD
- NCES district ID
- 4840950
- Math proficiency
- 21% ▼ -21.00%
- Reading proficiency
- 31% ▼ -5.00%
- Median HH income
- $43,362
- Composite
- 22.22/100
- National rank
- #8153
- State rank
- #701 of 826 in TX
Livability — San Antonio
- Score
- 80/100
- State rank
- #31
- US rank
- #1616
Category grades
Schools grade is shown separately in the Schools card above.
Census & demographics
- Census place
- San Antonio, TX
- City population
- 1,806,925
- Population (ZIP)
- 9,510
Population outlook (Bexar County) Hauer SSP2
- Today (2025)
- 2,336,851 people
- By 2030
- 2,560,728 · +9.6%
- By 2040
- 3,020,569 · +29.3%
- By 2050
- 3,493,522 · +49.5%
- By 2075
- 4,668,459 · +99.8%
- By 2100
- 5,533,242 · +136.8%
Race, ethnicity, and origin ACS 2023
- Neighborhood character
- Predominantly Hispanic (81%)
- Race & ethnicity
- Hispanic / Latino 81% Two or more races 33% White 16%
- Hispanic origin (detail)
- Mexican 75%
- Foreign-born
- 12% · Canada
- Languages at home
- 51% English-only · Spanish 48% German/W. Germanic 1%
Political lean MEDSL · Bexar
- 2024 margin
- Lean D (+9.8) · D 54.3% · R 44.6% · Other 1.1%
- 2008→2024 swing
- +4.2pp toward D · 2008: 5.6pp · 2024: 9.8pp
- All cycles
- 2024: D+9.8 2020: D+18.2 2016: D+13.5 2012: D+4.6 2008: D+5.6
Not yet ingested
- Civics
- —
Market trends
- HPI YoY
- ▲ 2.60%
- Current HPI
- 289.1266
- Rent YoY
- —
- Metro
- —
- State GDP YoY
- ▲ 3.95%
- F500 in state
- 110
Industry mix (Fortune 500 HQ in TX)
| Industry | F500 HQs | Revenue |
|---|---|---|
| Energy | 16 | $1,198B |
|
||
| Technology | 5 | $198B |
|
||
| Engineering / Construction | 4 | $72B |
|
||
| Energy Services | 3 | $60B |
|
||
| Utilities | 3 | $41B |
|
||
| Healthcare | 2 | $330B |
|
||
Price history
+13133.8% since first listed9 events — show timeline
- 2026-06-15 Listing Removed — LERA
- 2026-05-15 Listed $234,900 LERA
- 2024-02-16 Rental Removed $1,775 BUILDIUM
- 2024-01-31 Listed for Rent $1,775 BUILDIUM
- 2024-01-21 Rental Removed $1,775 BUILDIUM
- 2024-01-09 Price Changed $1,775 BUILDIUM
- 2023-12-29 Listed for Rent — BUILDIUM
- 2023-12-14 Rental Removed — BUILDIUM
- 2023-11-22 Listed for Rent — BUILDIUM
Property tax history
+70.1%/yrLatest (2025): $5,389 · +6.3% YoY. Source: county tax records.
Cash-flow waterfall
monthlySold comps — $/sqft
last 12 mo · ≤1 miLoading sold comps…