22904 N County Road 1840 Rd · Mangum, OK
Flood risk 1/10 · Minimal
- FEMA flood zone
- X (unshaded)
- Chance of flooding over 30 yrs
- 0.0%
- Est. flood insurance / yr
- $507 – $1,088
Fire risk 5/10 · Moderate
- Est. fire insurance / yr
- $2,463 – $4,575
Heat risk 6/10 · Moderate
- Hot days now (above 107°F)
- 7 days/yr
- Hot days in 30 yrs
- 18 days/yr
Wind risk 3/10 · Minor
- Chance of severe wind over 30 yrs
- 6.0%
Air-quality risk 1/10 · Minimal
- Unhealthy air days now
- 0 days/yr
- Unhealthy air days in 30 yrs
- 0 days/yr
Risk factors via First Street. Map © Google.
Why this score? — see what drove the C- grade
The composite is a weighted blend of 9 inputs, each scored 0–100. Each bar is that input's sub-score; the figure is the points it added to the 100-point composite (weight × sub-score).
- Cash flow +21.3/30.0
- ARV discount +7.5/15.0
- DSCR +6.8/10.0
- 1% rule +4.4/10.0
- Appreciation +3.8/10.0
- Livability +3.2/5.0
- Rent growth +2.5/5.0
- Condition / age +2.5/5.0
- Schools +2.3/10.0
$136,000
🖨 Deal sheet (PDF) 📄 Offer letter ✓ Due diligence
Listing remarks
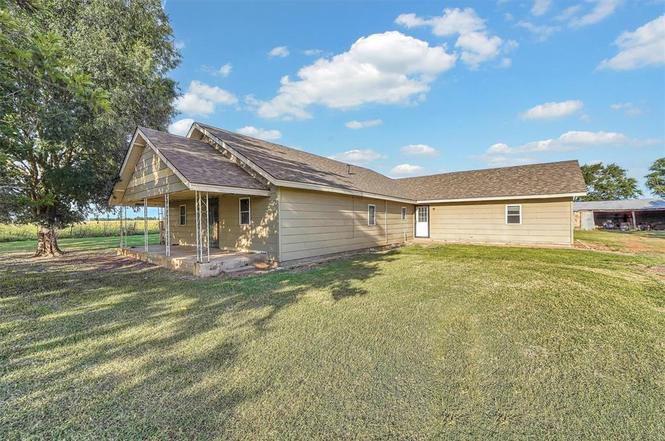
Spacious 4-Bedroom, 2-Bath Home on 1 Acre – Just North of Mangum in the Reed Community. Enjoy the charm of country living in this 2,040 sq ft home situated on a peaceful 1-acre lot just north of Mangum. With 4 spacious bedrooms and 2 full bathrooms, this property offers the comfort of rural life. Inside, you'll find original hardwood floors in the living and dining areas and newer carpet in three bedrooms. The kitchen features bright white cabinetry, updated tile backsplash, two pantries and ample counter space—ready for your personal touch. All four bedrooms are generously sized, including a large bedroom at the back of the home with beautiful natural light and painted concrete
Key facts
- Ample counter space
- Newer carpet
- Two pantries
Tags
Property features AI
Finance
- Other: Located in a rural legal addition; Approximately 1 acre parcel; Living area listed as 2,040 (assessor)
- Financial info: Not assumable; Loan financing may qualify
- HOA & community: No mandatory association dues
Exterior
- Security: Below-ground storm shelter
- Home design: Single-family residence; One-level home; Residential property; Existing property
- Construction: Vinyl siding; Composition roof; Double-pane windows; Conventional foundation
- Exterior features: Covered porch; Rural lot
Interior
- Kitchen: Dishwasher
- Bedrooms: 4 bedrooms
- Flooring: Carpet; Tile; Wood
- Bathrooms: 2 full bathrooms
- Interior features: Ceiling fans
- Laundry & utility: Inside utility
Neighborhood map
What this means for you Summary
Snapshot
- This is a 4-bed/2.0-bath single-family listed at $136k.
Deal economics
- At list price, monthly cash flow is $200 ($2k/yr) — positive.
- The deal already cash-flows at list — no discount required.
- To meet the 1% rule (rent ≥ 1% of price), the offer needs to be $128k (5.9% below list).
- Recommended offer: $120k (12.0% below list) — sets the bar for market timing.
Location & tenants
- Location reads 65/100 on livability (#144 in OK) — a middle-class / working-renter tenant base. Strengths: cost of living A+, housing A+, crime A-; Watch: amenities F, commute F, employment F.
- Mangum (town): math 27% / reading 28% proficiency, ranked #89 of 270 in OK (top 33%) — low school quality limits family demand, transient renter base, plan for 1-2y turnover.
- Zoned schools: Edison Es (math 47% / reading 32%, grade F, #107 of 845 statewide, top 14%, 239 students, 0% FRL); Mangum Hs (math 15% / reading 24%, grade F, #274 of 447 statewide, top 66%, 175 students, 0% FRL) — zoned schools average 0% FRL vs 56% district-wide (56 pts lower); this property's tenant base skews higher-income than the district average.
- Market conditions: 46 active listings in the ZIP.
Forward outlook
- Local home prices are declining (-2.5%/yr); year-one equity from $940 of loan paydown is wiped out by about $3k of value loss. Plan a longer hold.
- Greer County population projected to shrink 3% by 2050 — rents likely to lag national; underwrite the cash flow, not the appreciation.
Negotiation context
- It's been on market 349 days — a 12% lower offer ($120k) is reasonable based on typical stale-listing flexibility.
- Current owner paid $50k; list at $136k implies a 172% gain — meaningful room to come down on a strong offer.
Risks & watch-outs
- Watch-outs: built in 1940 — expect roof / HVAC / electrical / plumbing capex.
- Climate carrying-cost: moderate wildfire risk; extreme-heat days projected 7→18/yr by 2055 (HVAC capex compounding) — expect insurance premiums to compound above CPI over the hold.
Questions for the listing agent
- It's been on market 349 days. Have you received any prior offers? Is the seller open to a 12% concession, seller financing, or rate buy-down credit?
- Built in 1940 — when were the roof, HVAC, electrical panel, plumbing, and water heater last replaced?
- Why hasn't it sold? Are there any deal-killer items the seller is aware of (foundation, flood, title, zoning, code violations)?
- Is there a deadline driving the sale (1031 exchange, divorce, estate, relocation)? That informs how much negotiation room exists.
- What's the average days-on-market for RENTAL listings here right now (not sales)? A rising rental-DOM trend means longer vacancies and softer asking-rent achievability than the comps imply.
- What's the recent tenant-quality profile in this submarket — average credit score on applications, eviction rate, late-payment / NSF rate, and stable-employment percentage? A property-management company in the area should have these aggregated.
- How much new for-sale + rental construction is in the pipeline within 1–3 miles? Heavy new supply typically softens prices + rents 12–24 months out; constrained supply supports both.
Investment metrics
- 1% rule
- 0.94% ✗
- Cap rate
- 8.05%
- Cash-on-cash
- 6.29%
- DSCR
- 1.28
- GRM
- 8.9
CMA / ARV
No comps found within radius.
Projected returns pro-forma
-2.45% appreciation · 3.0% rent growth · sell at horizon
- IRR
- -4.2%
- Equity multiple
- 0.84×
- Total profit
- $-6,264
- Equity at exit
- $23,598
- IRR
- 4.5%
- Equity multiple
- 1.35×
- Total profit
- $13,392
- Equity at exit
- $17,542
Cash invested: $38,080 (down + closing). Projections, not guarantees.
Landlord ↔ Tenant lean methodology
- Overall (STATE)
- 83 Strongly Landlord-Friendly
- State Oklahoma
- 83 Strongly Landlord-Friendly · R+20
- County
- — inherits STATE
- City
- — inherits STATE
ZIP-level market 73554
- Home prices YoY
- -2.7%
- Active inventory
- 46
- Price-to-rent
- 8.9×
Monthly cashflow live
- Estimated rent
- $1,280 medium interval (Pro) →
- Mortgage (P&I)
- −$713
- Tax from tax record
- −$42 /mo · $503/yr
- Insurance
- −$57
- HOA
- −$0
- Vacancy / Maint / Mgmt
- −$269
- Net cashflow
- $200
Break-even live
Sensitivity live
| Price | -10% $277 | -5% $238 | +0% $200 | +5% $161 | +10% $123 |
|---|---|---|---|---|---|
| Rent | -10% $98 | -5% $149 | +0% $200 | +5% $250 | +10% $301 |
| Rate | -1.0pp $268 | -0.5pp $234 | base $200 | +0.5pp $164 | +1.0pp $129 |
UW: 25.0% down · 7.5% · 30yr · 1.5% tax · 5.0% vac · 8.0% maint · 8.0% mgmt
Financing live
Cash to close
- Down payment
- $34,000
- Closing costs
- $4,080
- Reserves months
- —
- Total cash needed
- —
Loan-product check · same deal, 3 products live
Conventional
25% down · 7.5% · 30yr
- Down + closing
- —
- Monthly P&I
- —
- Monthly cashflow
- —
- DSCR
- —
- Eligible?
- —
Personal DTI + credit; lowest rate.
DSCR
20% down · 8.5% · 30yr
- Down + closing
- —
- Monthly P&I
- —
- Monthly cashflow
- —
- DSCR
- —
- Eligible?
- —
No personal income docs; deal must DSCR.
Hard money
10% down · 12.0% · 12mo
- Down + closing
- —
- Monthly P&I
- —
- Monthly cashflow
- —
- DSCR
- —
- Eligible?
- —
Short-term bridge; refi at stabilization.
Listing history 22 events
-
2026-06-21days on market $136,000 Active 349 DOM
-
2026-06-18days on market $136,000 Active 347 DOM
-
2026-06-17days on market $136,000 Active 346 DOM
-
2026-06-16days on market $136,000 Active 345 DOM
-
2026-06-15days on market $136,000 Active 344 DOM
-
2026-06-13days on market $136,000 Active 342 DOM
-
2026-06-12days on market $136,000 Active 341 DOM
-
2026-06-09days on market $136,000 Active 338 DOM
-
2026-06-08days on market $136,000 Active 337 DOM
-
2026-06-08days on market $136,000 Active 336 DOM
-
2026-06-07days on market $136,000 Active 335 DOM
-
2026-06-04days on market $136,000 Active 332 DOM
-
2026-06-02days on market $136,000 Active 331 DOM
-
2026-06-01days on market $136,000 Active 330 DOM
-
2026-05-31days on market $136,000 Active 329 DOM
-
2026-04-01price $136,000
-
2025-12-31price $141,000
-
2025-10-13price $146,000
-
2025-08-30price $151,000
-
2025-07-06$160,000 Active
-
2019-02-21soldstatus $50,000
-
2001-11-09soldstatus $42,500
ⓘ Source: listings_history table (triggers on properties + properties_extension) + one-shot
backfill from property_details.listing_events for pre-trigger history.
Tax reassessment forecast OK · Resets to sale price
- Current annual tax
- $503 · $42/mo
- Projected year-2 tax
- $1,224 · $102/mo
- Expected delta
- +$721/yr (+$60/mo · 143.3%)
ⓘ Screening estimate from a state-policy table — verify with the county assessor before closing.
Climate risk First Street
- Flood 1/10 Low FEMA zone X (unshaded) · 0% chance over 30 yrs
- Wildfire 5/10 Major
- Heat 6/10 Major 7 d/yr ≥107°F today · 18 d/yr by 30 yrs out
- Wind 3/10 Moderate 6% chance of damaging wind over 30 yrs
- Air quality 1/10 Low 0 unhealthy d/yr today · 0 by 30 yrs out
Nearby sold comps map
Loading sold comps map…
Walkable amenities ~0.75 mi
Loading nearby amenities…
Taxation est. · year 1
- Rental income
- $15,363
- − Mortgage interest
- −$7,618
- − Property taxes
- −$503
- − Insurance
- −$680
- − Repairs & maintenance
- −$1,229
- − Management
- −$1,229
- − Depreciation
- −$3,956
- Taxable income
- $147
- Est. tax owed @ 24.0%
- −$35
- After-tax cash flow
- $2,360/yr
For passive investors: Depreciation is non-cash, so a rental often shows a tax loss while cash-flowing — sheltering income. Rental losses are passive: they offset passive income freely, and up to $25,000/yr can offset ordinary (W-2) income if you actively participate and your MAGI is under $100k (phasing out to $0 by $150k); unused losses carry forward. On sale, claimed depreciation is recaptured at up to 25%, and gains may owe capital-gains tax (a 1031 exchange can defer both). Figures are a year-1 estimate at your 24.0% rate — not tax advice; consult a CPA.
Schools (NCES district)
- District
- Mangum
- NCES district ID
- 4018780
- Math proficiency
- 27% ▼ -18.00%
- Reading proficiency
- 28% ▼ -15.00%
- Median HH income
- $36,568
- Composite
- 22.85/100
- National rank
- #8012
- State rank
- #89 of 270 in OK
Livability — Mangum
- Score
- 65/100
- State rank
- #144
- US rank
- #13248
Category grades
Schools grade is shown separately in the Schools card above.
Census & demographics
- Population (ZIP)
- 3,361
Population outlook (Greer County) Hauer SSP2
- Today (2025)
- 5,904 people
- By 2030
- 5,869 · -0.6%
- By 2040
- 5,790 · -1.9%
- By 2050
- 5,712 · -3.3%
- By 2075
- 5,196 · -12.0%
- By 2100
- 4,326 · -26.7%
Race, ethnicity, and origin ACS 2023
- Neighborhood character
- Predominantly White (75%)
- Race & ethnicity
- White 75% Hispanic / Latino 15% Two or more races 8% Black 3% Native American 1%
- Hispanic origin (detail)
- Mexican 14%
- Common ancestry
- Iranian 2% Serbian 2% Slovak 1%
- Foreign-born
- 1% · China, Canada
- Languages at home
- 94% English-only · Spanish 5%
Political lean MEDSL · Greer
- 2024 margin
- Solid R (+65.7) · D 16.6% · R 82.3% · Other 1.1%
- 2008→2024 swing
- -19.3pp toward R · 2008: -46.5pp · 2024: -65.7pp
- All cycles
- 2024: R+65.7 2020: R+64.7 2016: R+61.1 2012: R+46.7 2008: R+46.5
Not yet ingested
- Civics
- —
Market trends
- HPI YoY
- ▼ -2.45%
- Current HPI
- 88.9252
- Rent YoY
- —
- Metro
- —
- State GDP YoY
- ▲ 1.55%
- F500 in state
- 6
Industry mix (Fortune 500 HQ in OK)
| Industry | F500 HQs | Revenue |
|---|---|---|
| Energy | 3 | $48B |
|
||
Price history
+220.0% since first listed7 events — show timeline
- 2026-04-01 Price Changed $136,000 MLSOK
- 2025-12-31 Price Changed $141,000 MLSOK
- 2025-10-13 Price Changed $146,000 MLSOK
- 2025-08-30 Price Changed $151,000 MLSOK
- 2025-07-06 Listed $160,000 MLSOK
- 2019-02-21 Sold (Public Records) $50,000 Public Records
- 2001-11-09 Sold (Public Records) $42,500 Public Records
Property tax history
+2.9%/yrLatest (2025): $503 · +4.1% YoY. Source: county tax records.
Cash-flow waterfall
monthlySold comps — $/sqft
last 12 mo · ≤1 miLoading sold comps…