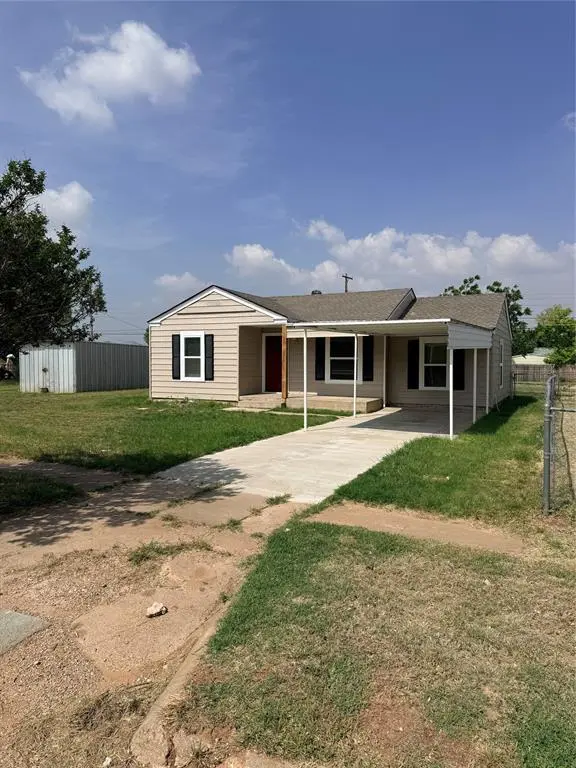
400 Avenue K · Anson, TX
Flood risk 1/10 · Minimal
- FEMA flood zone
- X (unshaded)
- Chance of flooding over 30 yrs
- 0.0%
- Est. flood insurance / yr
- $507 – $1,088
Fire risk 7/10 · Major
- Est. fire insurance / yr
- $1,222 – $2,270
Heat risk 7/10 · Major
- Hot days now (above 106°F)
- 6 days/yr
- Hot days in 30 yrs
- 19 days/yr
Wind risk 4/10 · Minor
- Chance of severe wind over 30 yrs
- 10.0%
Air-quality risk 1/10 · Minimal
- Unhealthy air days now
- 0 days/yr
- Unhealthy air days in 30 yrs
- 0 days/yr
Risk factors via First Street. Map © Google.
Why this score? — see what drove the B+ grade
The composite is a weighted blend of 9 inputs, each scored 0–100. Each bar is that input's sub-score; the figure is the points it added to the 100-point composite (weight × sub-score).
- Cash flow +30.0/30.0
- 1% rule +10.0/10.0
- DSCR +10.0/10.0
- ARV discount +7.5/15.0
- Appreciation +7.1/10.0
- Livability +3.5/5.0
- Schools +2.8/10.0
- Rent growth +2.5/5.0
- Condition / age +2.5/5.0
$179,000
🖨 Deal sheet (PDF) 📄 Offer letter ✓ Due diligence
Listing remarks
Remodeled and upgraded 3 bedroom 1 bath, new heating and air, fresh paint inside and out, new windows, remodeled bath, new kitchen cabinets, and more. Enjoy small town living. Located in Anson Texas. Contact a realtor today for showings.
Key facts
- New kitchen cabinets
- Remodeled bath
- New heating and air
Tags
Property features AI
Finance
- Other: Pool present on property
- HOA & community: No association
Exterior
- Parking: Carport (1 covered/carport space)
- Utilities: City water; City sewer; Electric service (standard); Curbs
- Home design: Single-family residence; One story
- Construction: Siding exterior; Built in 1951
- Exterior features: Private lot under 0.5 acre; Alley access; Asphalt and curbed streets
Interior
- Kitchen: Gas cooktop; Gas oven; Disposal
- Bedrooms: 3 bedrooms (all on the main level)
- Bathrooms: 1 full bathroom (main level) with granite countertop in primary bath
- Interior features: Granite counters; Built-in cabinets
- Laundry & utility: Utility room (main level)
Neighborhood map
What this means for you Summary
Snapshot
- This is a 3-bed/1.0-bath single-family listed at $179k.
Deal economics
- At list price, monthly cash flow is $1k ($14k/yr) — positive.
- The deal already cash-flows at list — no discount required.
- Meets the 1% rule at list price ($3k rent vs $179k).
- Recommended offer: $174k (3.0% below list) — sets the bar for market timing.
Location & tenants
- Location reads 70/100 on livability (#377 in TX) — a middle-class / working-renter tenant base. Strengths: crime A+, cost of living A+, housing A-; Watch: health & safety C-, employment D, amenities F.
- Anson ISD (rural): math 29% / reading 37% proficiency, ranked #565 of 826 in TX (top 68%) — families likely to look elsewhere, expect single-tenant / working-renter base with shorter leases.
- Zoned schools: Anson El (math 17% / reading 32%, grade F, #3,052 of 4,322 statewide, top 74%, 368 students, 68% FRL).
- Market conditions: 71 active listings in the ZIP; 1 units permitted in Jones County in 2024 (0 in 5+ unit buildings).
Forward outlook
- In year one you build about $9k of equity ($1k loan paydown + $7k appreciation (4.1% local appreciation)).
- Jones County population projected at +13% by 2050 — modest demand growth; plan on rents tracking national, not racing it.
- At projected returns (4.1% appreciation + 3.0% rent growth), your $50k cash investment doubles in ~3 years — after that, you're playing with house money.
- By year 5, paydown + projected appreciation supports a ~$37k cash-out refi (75% LTV) — recoverable capital for the next deal without selling this one.
Negotiation context
- It's been on market 42 days — a 3% lower offer ($174k) is reasonable based on typical stale-listing flexibility.
- 5 sale attempts since 20y ago with the ask held roughly flat each time — persistent listings suggest the price (not the market) is what's stuck; bring a comps-based counter.
Risks & watch-outs
- Watch-outs: built in 1951 — expect roof / HVAC / electrical / plumbing capex.
- Climate carrying-cost: major wildfire risk; extreme-heat days projected 6→19/yr by 2055 (HVAC capex compounding) — expect insurance premiums to compound above CPI over the hold.
Questions for the listing agent
- It's been on market 42 days. Have you received any prior offers? Is the seller open to a 3% concession, seller financing, or rate buy-down credit?
- Built in 1951 — when were the roof, HVAC, electrical panel, plumbing, and water heater last replaced?
- Is there a deadline driving the sale (1031 exchange, divorce, estate, relocation)? That informs how much negotiation room exists.
- Schools are D-rated, which usually means shorter tenancies and higher turnover. Who's the typical renter profile here, and what's been the actual vacancy rate?
- What's the average days-on-market for RENTAL listings here right now (not sales)? A rising rental-DOM trend means longer vacancies and softer asking-rent achievability than the comps imply.
- What's the recent tenant-quality profile in this submarket — average credit score on applications, eviction rate, late-payment / NSF rate, and stable-employment percentage? A property-management company in the area should have these aggregated.
- How much new for-sale + rental construction is in the pipeline within 1–3 miles? Heavy new supply typically softens prices + rents 12–24 months out; constrained supply supports both.
Investment metrics
- 1% rule
- 1.68% ✓
- Cap rate
- 14.25%
- Cash-on-cash
- 28.43%
- DSCR
- 2.26
- GRM
- 4.9
CMA / ARV
- ARV (median comp)
- $82,974
- List price
- $179,000
- Delta
- 115.73%
- Verdict
- OVERPRICED
- Comps
- 20 within 1.0 mi
Show comp detail 6 sales within ~0.75 mi
| Address | Dist | Beds/Ba | Sqft | Sold | Price | $/sf | Match |
|---|---|---|---|---|---|---|---|
| 400 Avenue K | 0.00mi | 3/1.0 | 991 (0%) | 0mo | $179,000 | $181 | 100 |
| 231 Avenue L | 0.06mi | 2/1.0 (-1) | 981 (-1%) | 7mo | $84,990 | $87 | 85 |
| 408 Commercial Ave | 0.08mi | 2/1.0 (-1) | 900 (-9%) | 10mo | $119,900 | $133 | 68 |
| 1302 6th St | 0.16mi | 3/1.0 | 1,122 (+13%) | 10mo | $77,000 | $69 | 62 |
| 1326 Westfield Dr | 0.15mi | 2/1.0 (-1) | 928 (-6%) | 19mo | $49,900 | $54 | 61 |
| 507 Ave K | 0.09mi | 2/2.0 (-1) | 1,097 (+11%) | 15mo | $80,000 | $73 | 56 |
Match score weights: distance 35% · size 25% · config 20% · recency 20%. Top-matched comps best support the ARV.
Projected returns pro-forma
4.13% appreciation · 3.0% rent growth · sell at horizon
- IRR
- 36.3%
- Equity multiple
- 3.16×
- Total profit
- $108,153
- Equity at exit
- $92,133
- IRR
- 35.3%
- Equity multiple
- 6.31×
- Total profit
- $266,208
- Equity at exit
- $151,801
Cash invested: $50,120 (down + closing). Projections, not guarantees.
Landlord ↔ Tenant lean methodology
- Overall (STATE)
- 87 Strongly Landlord-Friendly
- State Texas
- 87 Strongly Landlord-Friendly · R+5
- County
- — inherits STATE
- City
- — inherits STATE
ZIP-level market 79501
- Home prices YoY
- 2.9%
- Active inventory
- 71
- Price-to-rent
- 4.9×
Monthly cashflow live
- Estimated rent
- $3,014 medium interval (Pro) →
- Mortgage (P&I)
- −$939
- Tax from tax record
- −$180 /mo · $2,161/yr
- Insurance
- −$75
- HOA
- −$0
- Vacancy / Maint / Mgmt
- −$633
- Net cashflow
- $1,187
Break-even live
Sensitivity live
| Price | -10% $1,289 | -5% $1,238 | +0% $1,187 | +5% $1,137 | +10% $1,086 |
|---|---|---|---|---|---|
| Rent | -10% $949 | -5% $1,068 | +0% $1,187 | +5% $1,306 | +10% $1,425 |
| Rate | -1.0pp $1,278 | -0.5pp $1,233 | base $1,187 | +0.5pp $1,141 | +1.0pp $1,094 |
UW: 25.0% down · 7.5% · 30yr · 1.5% tax · 5.0% vac · 8.0% maint · 8.0% mgmt
Financing live
Cash to close
- Down payment
- $44,750
- Closing costs
- $5,370
- Reserves months
- —
- Total cash needed
- —
Loan-product check · same deal, 3 products live
Conventional
25% down · 7.5% · 30yr
- Down + closing
- —
- Monthly P&I
- —
- Monthly cashflow
- —
- DSCR
- —
- Eligible?
- —
Personal DTI + credit; lowest rate.
DSCR
20% down · 8.5% · 30yr
- Down + closing
- —
- Monthly P&I
- —
- Monthly cashflow
- —
- DSCR
- —
- Eligible?
- —
No personal income docs; deal must DSCR.
Hard money
10% down · 12.0% · 12mo
- Down + closing
- —
- Monthly P&I
- —
- Monthly cashflow
- —
- DSCR
- —
- Eligible?
- —
Short-term bridge; refi at stabilization.
Listing history 26 events
-
2026-06-10status $179,000 Pending 42 DOM
-
2026-06-09days on market $179,000 Active Option Contract 42 DOM
-
2026-06-08days on market $179,000 Active Option Contract 41 DOM
-
2026-06-07days on market $179,000 Active Option Contract 40 DOM
-
2026-06-03days on market $179,000 Active Option Contract 36 DOM
-
2026-06-02days on market $179,000 Active Option Contract 35 DOM
-
2026-06-01days on market $179,000 Active Option Contract 34 DOM
-
2026-05-31days on market $179,000 Active Option Contract 33 DOM
-
2026-05-30days on market $179,000 Active Option Contract 32 DOM
-
2026-05-03historical Active Option Contract 237-char remark
-
2026-04-28$179,000 Active 237-char remark
-
2026-04-27historical $1,600
-
2026-04-15$1,600
-
2025-05-09historical
-
2024-12-18$49,900 Active
-
2024-12-04historical
-
2024-10-21price $49,900
-
2024-09-04$57,000 Active
-
2018-06-22soldstatus
-
2014-07-23soldstatus
-
2014-07-23soldstatus
-
2006-06-06soldstatus
-
2006-05-22soldstatus
-
2006-04-25$35,000
-
2006-04-25historical
-
1990-05-22soldstatus
ⓘ Source: listings_history table (triggers on properties + properties_extension) + one-shot
backfill from property_details.listing_events for pre-trigger history.
Tax reassessment forecast TX · Resets to sale price
- Current annual tax
- $2,161 · $180/mo
- Projected year-2 tax
- $3,276 · $273/mo
- Expected delta
- +$1,115/yr (+$93/mo · 51.6%)
ⓘ Screening estimate from a state-policy table — verify with the county assessor before closing.
Climate risk First Street
- Flood 1/10 Low FEMA zone X (unshaded) · 0% chance over 30 yrs
- Wildfire 7/10 Severe
- Heat 7/10 Severe 6 d/yr ≥106°F today · 19 d/yr by 30 yrs out
- Wind 4/10 Moderate 10% chance of damaging wind over 30 yrs
- Air quality 1/10 Low 0 unhealthy d/yr today · 0 by 30 yrs out
Nearby sold comps map
Loading sold comps map…
Walkable amenities ~0.75 mi
Loading nearby amenities…
Taxation est. · year 1
- Rental income
- $36,163
- − Mortgage interest
- −$10,027
- − Property taxes
- −$2,161
- − Insurance
- −$895
- − Repairs & maintenance
- −$2,893
- − Management
- −$2,893
- − Depreciation
- −$5,207
- Taxable income
- $12,087
- Est. tax owed @ 24.0%
- −$2,901
- After-tax cash flow
- $11,347/yr
For passive investors: Depreciation is non-cash, so a rental often shows a tax loss while cash-flowing — sheltering income. Rental losses are passive: they offset passive income freely, and up to $25,000/yr can offset ordinary (W-2) income if you actively participate and your MAGI is under $100k (phasing out to $0 by $150k); unused losses carry forward. On sale, claimed depreciation is recaptured at up to 25%, and gains may owe capital-gains tax (a 1031 exchange can defer both). Figures are a year-1 estimate at your 24.0% rate — not tax advice; consult a CPA.
Schools (NCES district)
- District
- Anson ISD
- NCES district ID
- 4808400
- Math proficiency
- 29% ▼ -9.00%
- Reading proficiency
- 37% ▼ -3.00%
- Median HH income
- $45,223
- Composite
- 28.21/100
- National rank
- #6805
- State rank
- #565 of 826 in TX
Livability — Anson
- Score
- 70/100
- State rank
- #377
- US rank
- #7976
Category grades
Schools grade is shown separately in the Schools card above.
Census & demographics
- Census place
- Anson, TX
- City population
- 2,635
- Population (ZIP)
- 2,635
Population outlook (Jones County) Hauer SSP2
- Today (2025)
- 19,845 people
- By 2030
- 20,213 · +1.9%
- By 2040
- 21,446 · +8.1%
- By 2050
- 22,499 · +13.4%
- By 2075
- 23,272 · +17.3%
- By 2100
- 20,420 · +2.9%
Race, ethnicity, and origin ACS 2023
- Neighborhood character
- Predominantly White (65%)
- Race & ethnicity
- White 65% Hispanic / Latino 31% Two or more races 12% Black 2%
- Hispanic origin (detail)
- Mexican 24%
- Common ancestry
- Slovak 4% Serbian 2% Scotch-Irish 1%
- Foreign-born
- 5% · Canada, Vietnam
- Languages at home
- 81% English-only · Spanish 19%
Political lean MEDSL · Jones
- 2024 margin
- Solid R (+73.2) · D 13.1% · R 86.2%
- 2008→2024 swing
- -27.1pp toward R · 2008: -46.1pp · 2024: -73.2pp
- All cycles
- 2024: R+73.2 2020: R+69.1 2016: R+65.4 2012: R+54.5 2008: R+46.1
Not yet ingested
- Civics
- —
Market trends
- HPI YoY
- ▲ 4.13%
- Current HPI
- 148.5884
- Rent YoY
- —
- Metro
- —
- State GDP YoY
- ▲ 3.95%
- F500 in state
- 110
Industry mix (Fortune 500 HQ in TX)
| Industry | F500 HQs | Revenue |
|---|---|---|
| Energy | 16 | $1,198B |
|
||
| Technology | 5 | $198B |
|
||
| Engineering / Construction | 4 | $72B |
|
||
| Energy Services | 3 | $60B |
|
||
| Utilities | 3 | $41B |
|
||
| Healthcare | 2 | $330B |
|
||
Price history
+411.4% since first listed19 events — show timeline
- 2026-06-11 Sold (MLS) — NTREIS
- 2026-06-09 Pending — NTREIS
- 2026-05-03 Contingent — NTREIS
- 2026-04-28 Listed $179,000 NTREIS
- 2026-04-27 Rental Removed $1,600 APPFOLIO
- 2026-04-15 Listed for Rent $1,600 APPFOLIO
- 2025-05-09 Listing Removed — NTREIS
- 2024-12-18 Listed $49,900 NTREIS
- 2024-12-04 Listing Removed — NTREIS
- 2024-10-21 Price Changed $49,900 NTREIS
- 2024-09-04 Listed $57,000 NTREIS
- 2018-06-22 Sold (Public Records) — Public Records
- 2014-07-23 Sold (Public Records) — Public Records
- 2014-07-23 Sold (Public Records) — Public Records
- 2006-06-06 Sold (Public Records) — Public Records
- 2006-05-22 Sold (MLS) — NTREIS
- 2006-04-25 Listing Removed — NTREIS
- 2006-04-25 Listed $35,000 NTREIS
- 1990-05-22 Sold (Public Records) — Public Records
Property tax history
+6.9%/yrLatest (2025): $2,161 · +6.1% YoY. Source: county tax records.
Cash-flow waterfall
monthlySold comps — $/sqft
last 12 mo · ≤1 miLoading sold comps…