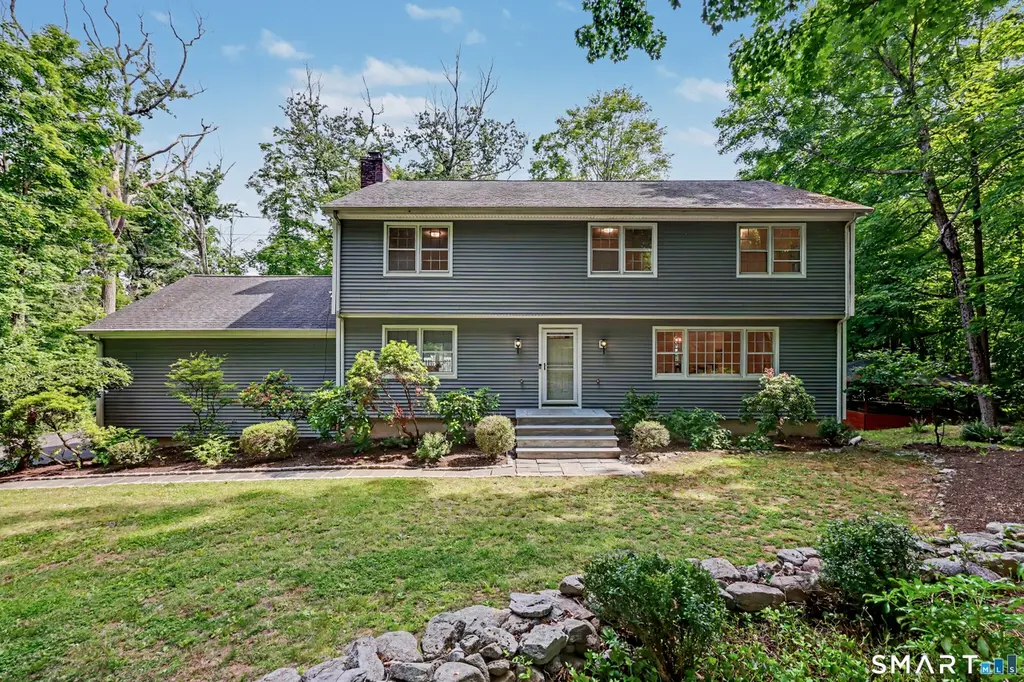
2473 Long Ridge Rd · Stamford, CT
Flood risk 1/10 · Minimal
- FEMA flood zone
- X (unshaded)
- Chance of flooding over 30 yrs
- 0.0%
- Est. flood insurance / yr
- $473 – $860
Fire risk 3/10 · Minor
- Est. fire insurance / yr
- $829 – $1,539
Heat risk 5/10 · Moderate
- Hot days now (above 100°F)
- 7 days/yr
- Hot days in 30 yrs
- 16 days/yr
Wind risk 6/10 · Moderate
- Chance of severe wind over 30 yrs
- 27.0%
Air-quality risk 4/10 · Minor
- Unhealthy air days now
- 5 days/yr
- Unhealthy air days in 30 yrs
- 7 days/yr
Risk factors via First Street. Map © Google.
Why this score? — see what drove the D- grade
The composite is a weighted blend of 9 inputs, each scored 0–100. Each bar is that input's sub-score; the figure is the points it added to the 100-point composite (weight × sub-score).
- Cash flow +14.4/30.0
- ARV discount +5.2/15.0
- DSCR +4.4/10.0
- 1% rule +3.5/10.0
- Schools +3.5/10.0
- Livability +3.5/5.0
- Rent growth +2.5/5.0
- Condition / age +2.5/5.0
- Appreciation +0.0/10.0
$997,000
🖨 Deal sheet (PDF) 📄 Offer letter ✓ Due diligence
Listing remarks MLS
This Colonial Sits On A Private Enclave Of 4 Other Homes.
Key facts
- 5th bedroom
- Private road
- Walkout basement
Tags
Property features AI
Exterior
- Parking: Under-house garage; 2-car garage
- Utilities: Public water connected; Septic sewage system; Domestic hot water
- Home design: Single-family home; Frame construction
- Construction: Concrete foundation; Asphalt shingle roof
- Exterior features: Deck; Lightly wooded, treed, level lot; Vinyl siding; Gray exterior color
Interior
- Kitchen: Oven/Range; Microwave; Refrigerator; Dishwasher
- Bedrooms: 5 bedrooms
- Bathrooms: 2 full bathrooms; 1 half bathroom
- Heating & cooling: Hot air heating (oil-fired); Fuel tank located in basement; Central air
- Interior features: 10 total rooms; Foyer; Full unfinished walk-out basement; Attic with hatch access; Central air conditioning; One fireplace
- Laundry & utility: Washer and dryer included; Laundry located on upper level (bedroom/office area)
Neighborhood map
What this means for you Summary
Snapshot
- This is a 5-bed/2.5-bath single-family listed at $997k.
Deal economics
- At list price, monthly cash flow is $202 ($2k/yr) — positive.
- The deal already cash-flows at list — no discount required.
- To meet the 1% rule (rent ≥ 1% of price), the offer needs to be $850k (14.7% below list).
- Recommended offer: $850k (14.7% below list) — sets the bar for 1% rule.
- Cap rate 6.5% vs local median 3.0% in Stamford — top-decile yield for the area; either an underpriced asset or a hidden risk that comps aren't pricing in. Stress-test before assuming the spread holds.
Location & tenants
- Location reads 70/100 on livability (#98 in CT) — a middle-class / working-renter tenant base. Strengths: employment A+, health & safety A+, crime A-; Watch: amenities F, commute F, cost of living F.
- Stamford School District (urban): math 32% / reading 43% proficiency, ranked #103 of 153 in CT (top 67%) — families likely to look elsewhere, expect single-tenant / working-renter base with shorter leases.
- Zoned schools: Roxbury School (math 33% / reading 33%, grade F, #354 of 553 statewide, top 64%, 562 students, 53% FRL); Westhill High School (math 33% / reading 50%, grade F, #102 of 194 statewide, top 53%, 2,265 students, 50% FRL).
- Market conditions: 73 active listings in the ZIP; 1 comparable units currently listed for rent nearby; 1,151 units permitted in Western Connecticut Planning Region in 2024 (714 in 5+ unit buildings).
Forward outlook
- Local home prices are declining (-3.0%/yr); year-one equity from $7k of loan paydown is wiped out by about $30k of value loss. Plan a longer hold.
Negotiation context
- Only 2 days on market — expect competitive offers; lowballing is unlikely to land.
- 3 sale attempts since 21y ago; this cycle's ask is 39% above the opening price — seller raised mid-cycle; expect resistance to lowballs.
- Current owner paid $700k; 42% above their basis — modest negotiation headroom, anchor on the comps not their cost.
Risks & watch-outs
- Climate carrying-cost: major wind risk, 27% chance of damaging wind over 30y; extreme-heat days projected 7→16/yr by 2055 (HVAC capex compounding) — expect insurance premiums to compound above CPI over the hold.
Questions for the listing agent
- Built in 1968 — when were the roof, HVAC, electrical panel, plumbing, and water heater last replaced?
- Is there a deadline driving the sale (1031 exchange, divorce, estate, relocation)? That informs how much negotiation room exists.
- Schools are B-rated — typically a magnet for longer-tenancy family renters. What's the average tenant stay here, and is there a school-zone premium baked into asking?
- The area grade is low — what's the realistic commute time and amenity access for the typical tenant pool here? Any planned neighborhood developments (good or bad) we should know about?
- What's the average days-on-market for RENTAL listings here right now (not sales)? A rising rental-DOM trend means longer vacancies and softer asking-rent achievability than the comps imply.
- What's the recent tenant-quality profile in this submarket — average credit score on applications, eviction rate, late-payment / NSF rate, and stable-employment percentage? A property-management company in the area should have these aggregated.
- How much new for-sale + rental construction is in the pipeline within 1–3 miles? Heavy new supply typically softens prices + rents 12–24 months out; constrained supply supports both.
Investment metrics
- 1% rule
- 0.85% ✗
- Cap rate
- 6.54%
- Cash-on-cash
- 0.87%
- DSCR
- 1.04
- GRM
- 9.8
CMA / ARV
- ARV (on-the-fly)
- $949,312
- Comps found
- 11
Show comp detail 11 sales within ~0.75 mi
| Address | Dist | Beds/Ba | Sqft | Sold | Price | $/sf | Match |
|---|---|---|---|---|---|---|---|
| 105 Mill Rd | 0.36mi | 4/2.5 (-1) | 2,658 (+2%) | 11mo | $985,000 | $371 | 66 |
| 60 Mountain Wood Rd | 0.45mi | 4/2.5 (-1) | 2,696 (+3%) | 16mo | $1,100,000 | $408 | 55 |
| 30 Dulan Dr | 0.54mi | 5/3.0 | 2,884 (+11%) | 4mo | $1,050,000 | $364 | 52 |
| 70 Old Long Ridge Rd | 0.20mi | 5/3.5 | 2,949 (+13%) | 18mo | $614,500 | $208 | 50 |
| 2535 Long Ridge Rd | 0.12mi | 4/3.0 (-1) | 2,220 (-15%) | 23mo | $800,000 | $360 | 44 |
| 587 Haviland Rd | 0.71mi | 4/3.0 (-1) | 2,593 (-1%) | 20mo | $1,530,000 | $590 | 42 |
| 232 Mill Rd | 0.67mi | 4/2.5 (-1) | 2,335 (-10%) | 10mo | $620,000 | $266 | 38 |
| 592 Hunting Ridge Rd | 0.35mi | 4/3.5 (-1) | 2,940 (+13%) | 21mo | $775,000 | $264 | 36 |
| 20 Heather Dr | 0.46mi | 5/2.5 | 2,966 (+14%) | 24mo | $1,015,000 | $342 | 36 |
| 134 Foxwood Rd | 0.63mi | 5/3.5 | 2,852 (+9%) | 23mo | $1,350,000 | $473 | 32 |
| 30 Round Hill Dr | 0.64mi | 4/2.0 (-1) | 2,964 (+14%) | 15mo | $1,100,000 | $371 | 28 |
Match score weights: distance 35% · size 25% · config 20% · recency 20%. Top-matched comps best support the ARV.
Projected returns pro-forma
-3.0% appreciation · 3.0% rent growth · sell at horizon
- IRR
- -14.9%
- Equity multiple
- 0.47×
- Total profit
- $-148,792
- Equity at exit
- $148,656
- IRR
- -6.3%
- Equity multiple
- 0.59×
- Total profit
- $-113,416
- Equity at exit
- $86,202
Cash invested: $279,160 (down + closing). Projections, not guarantees.
Landlord ↔ Tenant lean methodology
- Overall (STATE)
- 27 Tenant-Leaning
- State Connecticut
- 27 Tenant-Leaning · D+7
- County
- — inherits STATE
- City
- — inherits STATE
ZIP-level market 06903
- Active inventory
- 73
- Price-to-rent
- 9.8×
Monthly cashflow live
- Estimated rent
- $8,500 medium interval (Pro) →
- Mortgage (P&I)
- −$5,228
- Tax from tax record
- −$869 /mo · $10,430/yr
- Insurance
- −$415
- HOA
- −$0
- Vacancy / Maint / Mgmt
- −$1,785
- Net cashflow
- $202
Break-even live
Sensitivity live
| Price | -10% $766 | -5% $484 | +0% $202 | +5% $-80 | +10% $-362 |
|---|---|---|---|---|---|
| Rent | -10% $-469 | -5% $-134 | +0% $202 | +5% $538 | +10% $874 |
| Rate | -1.0pp $704 | -0.5pp $456 | base $202 | +0.5pp $-56 | +1.0pp $-319 |
UW: 25.0% down · 7.5% · 30yr · 1.5% tax · 5.0% vac · 8.0% maint · 8.0% mgmt
Financing live
Cash to close
- Down payment
- $249,250
- Closing costs
- $29,910
- Reserves months
- —
- Total cash needed
- —
Loan-product check · same deal, 3 products live
Conventional
25% down · 7.5% · 30yr
- Down + closing
- —
- Monthly P&I
- —
- Monthly cashflow
- —
- DSCR
- —
- Eligible?
- —
Personal DTI + credit; lowest rate.
DSCR
20% down · 8.5% · 30yr
- Down + closing
- —
- Monthly P&I
- —
- Monthly cashflow
- —
- DSCR
- —
- Eligible?
- —
No personal income docs; deal must DSCR.
Hard money
10% down · 12.0% · 12mo
- Down + closing
- —
- Monthly P&I
- —
- Monthly cashflow
- —
- DSCR
- —
- Eligible?
- —
Short-term bridge; refi at stabilization.
Rent comps 1 comps
| Address | Beds | Baths | Sqft | Rent | $/sqft | DOM | Units | Dist |
|---|---|---|---|---|---|---|---|---|
| 2428 Long Ridge Rd Stamford, CT | 5.0 | 2.5 | 2848 | $8,500 | $2.98 | 3d | 1 | 0.17mi |
Listing history 6 events
-
2026-06-18days on market $997,000 Active 2 DOM
-
2026-06-17statusdays on market $997,000 Active 1 DOM
-
2026-06-16pricedays on market $997,000 Coming Soon 4 DOM
-
2026-06-15days on market $995,000 Coming Soon 3 DOM
-
2026-06-13remarks 699-char remark
-
2026-06-13$995,000 Coming Soon 1 DOM
ⓘ Source: listings_history table (triggers on properties + properties_extension) + one-shot
backfill from property_details.listing_events for pre-trigger history.
Tax reassessment forecast CT · Partial reset (capped growth)
- Current annual tax
- $10,430 · $869/mo
- Projected year-2 tax
- $15,883 · $1,324/mo
- Expected delta
- +$5,453/yr (+$454/mo · 52.3%)
ⓘ Screening estimate from a state-policy table — verify with the county assessor before closing.
Climate risk First Street
- Flood 1/10 Low FEMA zone X (unshaded) · 0% chance over 30 yrs
- Wildfire 3/10 Moderate
- Heat 5/10 Major 7 d/yr ≥100°F today · 16 d/yr by 30 yrs out
- Wind 6/10 Major 27% chance of damaging wind over 30 yrs
- Air quality 4/10 Moderate 5 unhealthy d/yr today · 7 by 30 yrs out
Nearby sold comps map
Loading sold comps map…
Walkable amenities ~0.75 mi
Loading nearby amenities…
Taxation est. · year 1
- Rental income
- $102,000
- − Mortgage interest
- −$55,848
- − Property taxes
- −$10,430
- − Insurance
- −$4,985
- − Repairs & maintenance
- −$8,160
- − Management
- −$8,160
- − Depreciation
- −$29,004
- Taxable loss
- −$14,586
- Est. tax savings @ 24.0%
- +$3,501
- After-tax cash flow
- $5,925/yr
For passive investors: Depreciation is non-cash, so a rental often shows a tax loss while cash-flowing — sheltering income. Rental losses are passive: they offset passive income freely, and up to $25,000/yr can offset ordinary (W-2) income if you actively participate and your MAGI is under $100k (phasing out to $0 by $150k); unused losses carry forward. On sale, claimed depreciation is recaptured at up to 25%, and gains may owe capital-gains tax (a 1031 exchange can defer both). Figures are a year-1 estimate at your 24.0% rate — not tax advice; consult a CPA.
Schools (NCES district)
- District
- Stamford School District
- NCES district ID
- 0904320
- Math proficiency
- 32% ▼ -10.00%
- Reading proficiency
- 43% ▼ -7.00%
- Median HH income
- $78,843
- Composite
- 35.14/100
- National rank
- #5010
- State rank
- #103 of 153 in CT
Livability — Stamford
- Score
- 70/100
- State rank
- #98
- US rank
- #7716
Category grades
Schools grade is shown separately in the Schools card above.
Census & demographics
- Census place
- Stamford, CT
- City population
- 123,058
- Population (ZIP)
- 13,630
Population outlook (Western Connecticut County) Hauer SSP2
- By 2040
- 685,031
Race, ethnicity, and origin ACS 2023
- Neighborhood character
- Predominantly White (74%)
- Race & ethnicity
- White 74% Two or more races 11% Hispanic / Latino 9% Black 6% Asian 6%
- Hispanic origin (detail)
- Cuban 1%
- Common ancestry
- Romanian 6% Scotch-Irish 4% Italian 2%
- Foreign-born
- 18% · Canada, China, Dominican Republic
- Languages at home
- 78% English-only · Other Indo-European 6% Spanish 5% Russian/Polish/Slavic 4%
Political lean MEDSL · Western Connecticut
- 2024 margin
- D (+19.1) · D 58.8% · R 39.7% · Other 1.6%
- All cycles
- 2024: D+19.1
Not yet ingested
- Civics
- —
Market trends
- HPI YoY
- ▼ -247.05%
- Current HPI
- 163.3073
- Rent YoY
- —
- Metro
- —
- State GDP YoY
- ▲ 1.06%
- F500 in state
- 38
Industry mix (Fortune 500 HQ in CT)
| Industry | F500 HQs | Revenue |
|---|---|---|
| Industrial Machinery | 4 | $38B |
|
||
| Insurance | 3 | $71B |
|
||
| Financial Services | 2 | $25B |
|
||
| Transportation / Logistics | 2 | $18B |
|
||
| Healthcare | 1 | $247B |
|
||
| Telecommunications | 1 | $55B |
|
||
Price history
+11.3% since first listed8 events — show timeline
- 2026-06-12 Coming Soon $995,000 Smart MLS
- 2006-03-03 Sold (Public Records) $700,000 Public Records
- 2006-03-01 Sold (MLS) $700,000 Smart MLS
- 2005-08-30 Listing Removed — Smart MLS
- 2005-08-30 Listed $719,000 Smart MLS
- 2005-05-17 Listed $779,000 Smart MLS
- 2005-05-16 Listing Removed — Smart MLS
- 2005-05-15 Listed $894,000 Smart MLS
Property tax history
+1.7%/yrLatest (2022): $10,430 · +1.4% YoY. Source: county tax records.
Cash-flow waterfall
monthlySold comps — $/sqft
last 12 mo · ≤1 miLoading sold comps…