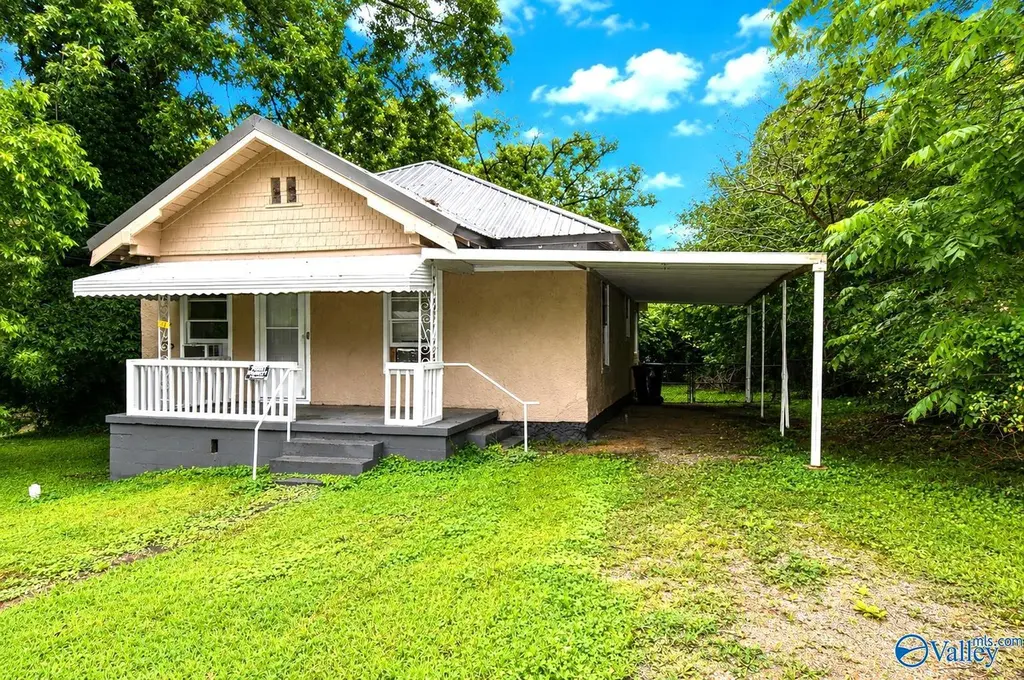
27 W Wilkinson Ave · Gadsden, AL
Flood risk 1/10 · Minimal
- FEMA flood zone
- X (unshaded)
- Chance of flooding over 30 yrs
- 0.0%
- Est. flood insurance / yr
- $507 – $1,088
Fire risk 4/10 · Minor
- Est. fire insurance / yr
- $916 – $1,700
Heat risk 6/10 · Moderate
- Hot days now (above 106°F)
- 7 days/yr
- Hot days in 30 yrs
- 19 days/yr
Wind risk 4/10 · Minor
- Chance of severe wind over 30 yrs
- 21.0%
Air-quality risk 2/10 · Minimal
- Unhealthy air days now
- 1 days/yr
- Unhealthy air days in 30 yrs
- 2 days/yr
Risk factors via First Street. Map © Google.
Why this score? — see what drove the C- grade
The composite is a weighted blend of 9 inputs, each scored 0–100. Each bar is that input's sub-score; the figure is the points it added to the 100-point composite (weight × sub-score).
- Cash flow +24.2/30.0
- DSCR +7.8/10.0
- 1% rule +5.0/10.0
- Livability +3.0/5.0
- ARV discount +2.9/15.0
- Rent growth +2.5/5.0
- Condition / age +2.5/5.0
- Schools +2.2/10.0
- Appreciation +0.0/10.0
$74,900
🖨 Deal sheet (PDF) 📄 Offer letter ✓ Due diligence
Listing remarks MLS
Come check out this fixer upper with rental income potential. 2 bedroom, 1 bath with eat-in kitchen. Sits in the heart of the historic Mill Village. Won't last long!! Priced to sell!!
Key facts
- Near schools
- Interstate access
- Near shopping
Tags
Property features AI
Finance
- Other: Subdivision: Cone Mills Dwight
- HOA & community: No homeowners association
Exterior
- Parking: Gravel driveway
- Utilities: Public sewer; Natural gas
- Home design: Single-family residence; Built in 1945; Resides on one to two stories (exact stories not provided)
- Construction: Living area approximately 891 square feet; Two fireplaces
- Exterior features: Lot is approximately 0.24 acres; Public sewer
Interior
- Bedrooms: Total of 4 rooms (includes bedrooms and living spaces)
- Bathrooms: 1 full bathroom
- Heating & cooling: Natural gas heating; Window air conditioners (2+ units)
- Interior features: Crawl space basement; Two fireplaces
Neighborhood map
What this means for you Summary
Snapshot
- This is a 2-bed/1.0-bath single-family listed at $75k.
Deal economics
- At list price, monthly cash flow is $150 ($2k/yr) — positive.
- The deal already cash-flows at list — no discount required.
- Meets the 1% rule at list price ($750 rent vs $75k).
- Cap rate 8.7% vs local median 5.1% in Gadsden — top-decile yield for the area; either an underpriced asset or a hidden risk that comps aren't pricing in. Stress-test before assuming the spread holds.
Location & tenants
- Location reads 59/100 on livability (#335 in AL) — a working-class tenant base; expect higher turnover. Strengths: cost of living A+, housing A+; Watch: crime F, amenities F, commute F.
- Gadsden City (urban): math 15% / reading 39% proficiency, ranked #87 of 129 in AL (top 67%) — low school quality limits family demand, transient renter base, plan for 1-2y turnover; 66% free/reduced lunch — lower-income household profile, screen leases tightly.
- Zoned schools: Floyd Elementary School (math 17% / reading 27%, grade F, #442 of 627 statewide, top 72%, 367 students, 85% FRL); Sansom Middle School (math 7% / reading 38%, grade F, #180 of 257 statewide, top 70%, 376 students, 84% FRL); Gadsden City High School (math 17% / reading 24%, grade F, #159 of 305 statewide, top 53%, 1,318 students, 76% FRL) — zoned schools average 82% FRL vs 66% district-wide (15 pts higher); higher-poverty schools than district average — tighter screening recommended.
- Market conditions: 88 active listings in the ZIP; 2 comparable units currently listed for rent nearby; 119 units permitted in Etowah County in 2024 (0 in 5+ unit buildings).
Forward outlook
- Local home prices are declining (-3.0%/yr); year-one equity from $518 of loan paydown is wiped out by about $2k of value loss. Plan a longer hold.
- Etowah County population projected at -12% by 2050 — secular population decline; favor cash flow + early exit over multi-decade hold.
Negotiation context
- Only 13 days on market — expect competitive offers; lowballing is unlikely to land.
- 4 sale attempts since 9y ago with the ask held roughly flat each time — persistent listings suggest the price (not the market) is what's stuck; bring a comps-based counter.
- Current owner paid $30k; list at $75k implies a 146% gain — meaningful room to come down on a strong offer.
Risks & watch-outs
- Watch-outs: built in 1945 — expect roof / HVAC / electrical / plumbing capex.
- Climate carrying-cost: extreme-heat days projected 7→19/yr by 2055 (HVAC capex compounding) — expect insurance premiums to compound above CPI over the hold.
Questions for the listing agent
- Built in 1945 — when were the roof, HVAC, electrical panel, plumbing, and water heater last replaced?
- Is there a deadline driving the sale (1031 exchange, divorce, estate, relocation)? That informs how much negotiation room exists.
- Crime grade is F in this area — have there been break-ins, vandalism, or insurance claims at this property in the last 3 years? What carrier currently insures it and at what premium?
- What's the average days-on-market for RENTAL listings here right now (not sales)? A rising rental-DOM trend means longer vacancies and softer asking-rent achievability than the comps imply.
- What's the recent tenant-quality profile in this submarket — average credit score on applications, eviction rate, late-payment / NSF rate, and stable-employment percentage? A property-management company in the area should have these aggregated.
- How much new for-sale + rental construction is in the pipeline within 1–3 miles? Heavy new supply typically softens prices + rents 12–24 months out; constrained supply supports both.
Investment metrics
- 1% rule
- 1.00% ✓
- Cap rate
- 8.70%
- Cash-on-cash
- 8.58%
- DSCR
- 1.38
- GRM
- 8.3
CMA / ARV
- ARV (on-the-fly)
- $68,000
- Comps found
- 8
Show comp detail 8 sales within ~0.75 mi
| Address | Dist | Beds/Ba | Sqft | Sold | Price | $/sf | Match |
|---|---|---|---|---|---|---|---|
| 8 Laurel Rd | 0.39mi | 2/1.0 | 840 (-1%) | 1mo | $67,000 | $80 | 79 |
| 803 N 32nd St | 0.09mi | 2/1.0 | 894 (+5%) | 10mo | $80,000 | $89 | 79 |
| 506 33rd St N | 0.23mi | 2/1.0 | 912 (+7%) | 9mo | $28,200 | $31 | 70 |
| 42 Wilkinson Ave E | 0.24mi | 2/2.0 | 920 (+8%) | 11mo | $132,500 | $144 | 62 |
| 8 Peachtree St | 0.65mi | 2/1.0 | 882 (+4%) | 12mo | $69,000 | $78 | 53 |
| 922 N 33rd St | 0.23mi | 3/1.0 (+1) | 960 (+13%) | 16mo | $65,000 | $68 | 49 |
| 7 Hinsdale Ave | 0.58mi | 1/1.0 (-1) | 774 (-9%) | 11mo | $74,000 | $96 | 44 |
| 2706 Sansom Ave | 0.49mi | 3/1.0 (+1) | 736 (-13%) | 23mo | $15,000 | $20 | 31 |
Match score weights: distance 35% · size 25% · config 20% · recency 20%. Top-matched comps best support the ARV.
Projected returns pro-forma
-3.0% appreciation · 3.0% rent growth · sell at horizon
- IRR
- -3.3%
- Equity multiple
- 0.88×
- Total profit
- $-2,620
- Equity at exit
- $11,168
- IRR
- 6.3%
- Equity multiple
- 1.47×
- Total profit
- $9,876
- Equity at exit
- $6,476
Cash invested: $20,972 (down + closing). Projections, not guarantees.
Landlord ↔ Tenant lean methodology
- Overall (STATE)
- 90 Strongly Landlord-Friendly
- State Alabama
- 90 Strongly Landlord-Friendly · R+15
- County
- — inherits STATE
- City
- — inherits STATE
ZIP-level market 35904
- Home prices YoY
- -17.1%
- Active inventory
- 88
- Price-to-rent
- 8.3×
Monthly cashflow live
- Estimated rent
- $750 medium interval (Pro) →
- Mortgage (P&I)
- −$393
- Tax from tax record
- −$19 /mo · $222/yr
- Insurance
- −$31
- HOA
- −$0
- Vacancy / Maint / Mgmt
- −$158
- Net cashflow
- $150
Break-even live
Sensitivity live
| Price | -10% $192 | -5% $171 | +0% $150 | +5% $129 | +10% $108 |
|---|---|---|---|---|---|
| Rent | -10% $91 | -5% $120 | +0% $150 | +5% $180 | +10% $209 |
| Rate | -1.0pp $188 | -0.5pp $169 | base $150 | +0.5pp $131 | +1.0pp $111 |
UW: 25.0% down · 7.5% · 30yr · 1.5% tax · 5.0% vac · 8.0% maint · 8.0% mgmt
Financing live
Cash to close
- Down payment
- $18,725
- Closing costs
- $2,247
- Reserves months
- —
- Total cash needed
- —
Loan-product check · same deal, 3 products live
Conventional
25% down · 7.5% · 30yr
- Down + closing
- —
- Monthly P&I
- —
- Monthly cashflow
- —
- DSCR
- —
- Eligible?
- —
Personal DTI + credit; lowest rate.
DSCR
20% down · 8.5% · 30yr
- Down + closing
- —
- Monthly P&I
- —
- Monthly cashflow
- —
- DSCR
- —
- Eligible?
- —
No personal income docs; deal must DSCR.
Hard money
10% down · 12.0% · 12mo
- Down + closing
- —
- Monthly P&I
- —
- Monthly cashflow
- —
- DSCR
- —
- Eligible?
- —
Short-term bridge; refi at stabilization.
Rent comps 2 comps
| Address | Beds | Baths | Sqft | Rent | $/sqft | DOM | Units | Dist |
|---|---|---|---|---|---|---|---|---|
| 2 W Tuscaloosa Ave Gadsden, AL | 2.0 | 1.0 | 1056 | $750 | $0.71 | 45d | 1 | 0.46mi |
| 504 Pearl St Gadsden, AL | 2.0 | 1.0 | 903 | $750 | $0.83 | 45d | 1 | 1.06mi |
Listing history 10 events
-
2026-06-21days on market $74,900 Active 13 DOM
-
2026-06-19days on market $74,900 Active 11 DOM
-
2026-06-18days on market $74,900 Active 10 DOM
-
2026-06-17days on market $74,900 Active 9 DOM
-
2026-06-16days on market $74,900 Active 8 DOM
-
2026-06-15days on market $74,900 Active 7 DOM
-
2026-06-14days on market $74,900 Active 5 DOM
-
2026-06-12days on market $74,900 Active 4 DOM
-
2026-06-09remarks 682-char remark
-
2026-06-09$74,900 Active 1 DOM
ⓘ Source: listings_history table (triggers on properties + properties_extension) + one-shot
backfill from property_details.listing_events for pre-trigger history.
Tax reassessment forecast AL · Resets to sale price
- Current annual tax
- $222 · $19/mo
- Projected year-2 tax
- $307 · $26/mo
- Expected delta
- +$85/yr (+$7/mo · 38.0%)
ⓘ Screening estimate from a state-policy table — verify with the county assessor before closing.
Climate risk First Street
- Flood 1/10 Low FEMA zone X (unshaded) · 0% chance over 30 yrs
- Wildfire 4/10 Moderate
- Heat 6/10 Major 7 d/yr ≥106°F today · 19 d/yr by 30 yrs out
- Wind 4/10 Moderate 21% chance of damaging wind over 30 yrs
- Air quality 2/10 Low 1 unhealthy d/yr today · 2 by 30 yrs out
Nearby sold comps map
Loading sold comps map…
Walkable amenities ~0.75 mi
Loading nearby amenities…
Taxation est. · year 1
- Rental income
- $9,000
- − Mortgage interest
- −$4,196
- − Property taxes
- −$222
- − Insurance
- −$374
- − Repairs & maintenance
- −$720
- − Management
- −$720
- − Depreciation
- −$2,179
- Taxable income
- $589
- Est. tax owed @ 24.0%
- −$141
- After-tax cash flow
- $1,658/yr
For passive investors: Depreciation is non-cash, so a rental often shows a tax loss while cash-flowing — sheltering income. Rental losses are passive: they offset passive income freely, and up to $25,000/yr can offset ordinary (W-2) income if you actively participate and your MAGI is under $100k (phasing out to $0 by $150k); unused losses carry forward. On sale, claimed depreciation is recaptured at up to 25%, and gains may owe capital-gains tax (a 1031 exchange can defer both). Figures are a year-1 estimate at your 24.0% rate — not tax advice; consult a CPA.
Schools (NCES district)
- District
- Gadsden City
- NCES district ID
- 0101620
- Math proficiency
- 15% ▼ -27.00%
- Reading proficiency
- 39% ▼ -2.00%
- Median HH income
- $29,099
- Composite
- 21.62/100
- National rank
- #8292
- State rank
- #87 of 129 in AL
Livability — Gadsden
- Score
- 59/100
- State rank
- #335
- US rank
- #20131
Category grades
Schools grade is shown separately in the Schools card above.
Census & demographics
- Census place
- Gadsden, AL
- Population (ZIP)
- 13,571
Population outlook (Etowah County) Hauer SSP2
- Today (2025)
- 100,500 people
- By 2030
- 98,488 · -2.0%
- By 2040
- 93,731 · -6.7%
- By 2050
- 88,681 · -11.8%
- By 2075
- 76,746 · -23.6%
- By 2100
- 65,373 · -35.0%
Race, ethnicity, and origin ACS 2023
- Neighborhood character
- Predominantly White (77%)
- Race & ethnicity
- White 77% Black 13% Hispanic / Latino 8% Two or more races 2%
- Hispanic origin (detail)
- Mexican 5%
- Common ancestry
- Slovak 3% Serbian 1% Iranian 1%
- Foreign-born
- 3% · Canada
- Languages at home
- 93% English-only · Spanish 6%
Political lean MEDSL · Etowah
- 2024 margin
- Solid R (+55.7) · D 21.8% · R 77.5%
- 2008→2024 swing
- -17.5pp toward R · 2008: -38.2pp · 2024: -55.7pp
- All cycles
- 2024: R+55.7 2020: R+50.2 2016: R+50.1 2012: R+38.4 2008: R+38.2
Not yet ingested
- Civics
- —
Market trends
- HPI YoY
- ▼ -44.06%
- Current HPI
- 213.3981
- Rent YoY
- —
- Metro
- —
- State GDP YoY
- ▲ 2.94%
- F500 in state
- 4
Industry mix (Fortune 500 HQ in AL)
| Industry | F500 HQs | Revenue |
|---|---|---|
| Financial Services | 1 | $8B |
|
||
| Healthcare | 1 | $5B |
|
||
Price history
+656.6% since first listed9 events — show timeline
- 2026-06-08 Listed $74,900 VMLS
- 2025-04-07 Sold (MLS) $30,500 VMLS
- 2025-04-07 Sold (MLS) $30,500 Greater Alabama MLS
- 2025-03-27 Pending — Greater Alabama MLS
- 2025-03-27 Pending — VMLS
- 2025-03-21 Listed $34,900 VMLS
- 2025-03-21 Listed $34,900 Greater Alabama MLS
- 2017-09-27 Sold (MLS) $9,000 VMLS
- 2017-07-14 Listed $9,900 VMLS
Property tax history
+9.9%/yrLatest (2025): $222 · +0.0% YoY. Source: county tax records.
Cash-flow waterfall
monthlySold comps — $/sqft
last 12 mo · ≤1 miLoading sold comps…