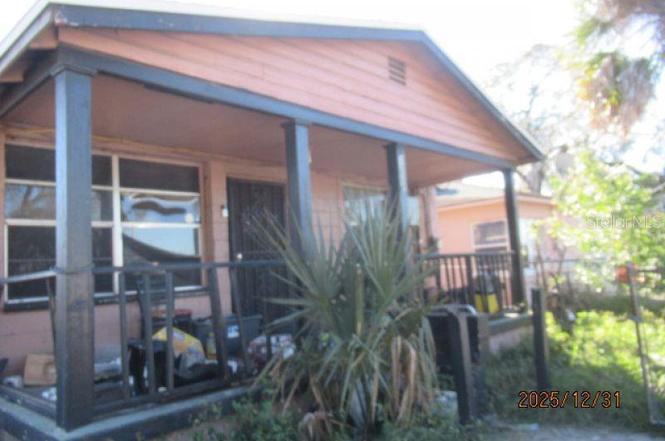
1224 Polk St · Orlando, FL
Flood risk 1/10 · Minimal
- FEMA flood zone
- X (unshaded)
- Chance of flooding over 30 yrs
- 0.0%
- Est. flood insurance / yr
- $507 – $1,088
Fire risk 1/10 · Minimal
- Est. fire insurance / yr
- $947 – $1,759
Heat risk 9/10 · Severe
- Hot days now (above 108°F)
- 7 days/yr
- Hot days in 30 yrs
- 22 days/yr
Wind risk 9/10 · Severe
- Chance of severe wind over 30 yrs
- 99.0%
Air-quality risk 1/10 · Minimal
- Unhealthy air days now
- 0 days/yr
- Unhealthy air days in 30 yrs
- 0 days/yr
Risk factors via First Street. Map © Google.
Why this score? — see what drove the B grade
The composite is a weighted blend of 9 inputs, each scored 0–100. Each bar is that input's sub-score; the figure is the points it added to the 100-point composite (weight × sub-score).
- Cash flow +30.0/30.0
- 1% rule +10.0/10.0
- DSCR +10.0/10.0
- ARV discount +7.5/15.0
- Livability +4.3/5.0
- Schools +4.1/10.0
- Rent growth +2.9/5.0
- Condition / age +2.5/5.0
- Appreciation +0.0/10.0
$84,900
🖨 Deal sheet (PDF) 📄 Offer letter ✓ Due diligence
Listing remarks
Cash or Hard Money Only – Prime Orlando Investment / Rehab Opportunity! 1224 Polk St is a major renovation or redevelopment project ready for your vision. The property requires a full rehab or possible teardown, making it ideal for experienced investors, flippers, or builders looking for their next value-add deal. This is a true blank slate with strong upside potential. Situated on a residential street in central Orlando, the lot offers excellent resale or rental potential in a high-demand area. Surrounded by ongoing renovations and steady growth, this location supports solid ARVs and long-term appreciation. Perfect opportunity for a fix-and-flip, rental hold, or redevelopment play
Key facts
- Possible teardown
- Blank slate
- Residential street
Tags
Neighborhood map
What this means for you Summary
Snapshot
- This is a 3-bed/1.0-bath single-family listed at $85k.
Deal economics
- At list price, monthly cash flow is $668 ($8k/yr) — positive.
- The deal already cash-flows at list — no discount required.
- Meets the 1% rule at list price ($2k rent vs $85k).
- Cap rate 15.7% vs local median 3.0% in Orlando — top-decile yield for the area; either an underpriced asset or a hidden risk that comps aren't pricing in. Stress-test before assuming the spread holds.
Location & tenants
- Location reads 86/100 on livability (#12 in FL, #360 nationally) — a professional / high-income tenant draw. Strengths: amenities A+, commute A+, housing A+.
- Orange (suburban): math 46% / reading 51% proficiency, ranked #43 of 73 in FL (top 59%) — families likely to look elsewhere, expect single-tenant / working-renter base with shorter leases.
- Market conditions: Rents rising (+1.4%/yr); 142 active listings in the ZIP; 40 comparable units currently listed for rent nearby; rentals at typical pace (median 25d on market — plan ~3-4 weeks tenant-placement turnaround); lower-income renter base — watch delinquency; 8,053 units permitted in Orange County in 2024 (3,133 in 5+ unit buildings).
- At $1,592/mo this rent would consume 47% of the median local household income ($41k/yr) (locally 1597% of renters already pay >50% of income on rent) — very limited rent-growth headroom before tenants either downsize or default.
Forward outlook
- Local home prices are declining (-3.0%/yr); year-one equity from $587 of loan paydown is wiped out by about $3k of value loss. Plan a longer hold.
- Orange County population projected at +52% by 2050 — long-run rental-demand tailwind backs the buy-and-hold thesis.
- At projected returns (-3.0% appreciation + 1.4% rent growth), your $24k cash investment doubles in ~4 years — after that, you're playing with house money.
Negotiation context
- Only 5 days on market — expect competitive offers; lowballing is unlikely to land.
- Current owner paid $45k; list at $85k implies a 89% gain — meaningful room to come down on a strong offer.
Risks & watch-outs
- Watch-outs: built in 1952 — expect roof / HVAC / electrical / plumbing capex.
- Climate carrying-cost: severe wind risk, 99% chance of damaging wind over 30y; extreme-heat days projected 7→22/yr by 2055 (HVAC capex compounding) — expect insurance premiums to compound above CPI over the hold.
Questions for the listing agent
- Built in 1952 — when were the roof, HVAC, electrical panel, plumbing, and water heater last replaced?
- Is there a deadline driving the sale (1031 exchange, divorce, estate, relocation)? That informs how much negotiation room exists.
- Schools are B-rated — typically a magnet for longer-tenancy family renters. What's the average tenant stay here, and is there a school-zone premium baked into asking?
- What's the average days-on-market for RENTAL listings here right now (not sales)? A rising rental-DOM trend means longer vacancies and softer asking-rent achievability than the comps imply.
- What's the recent tenant-quality profile in this submarket — average credit score on applications, eviction rate, late-payment / NSF rate, and stable-employment percentage? A property-management company in the area should have these aggregated.
- How much new for-sale + rental construction is in the pipeline within 1–3 miles? Heavy new supply typically softens prices + rents 12–24 months out; constrained supply supports both.
Investment metrics
- 1% rule
- 1.88% ✓
- Cap rate
- 15.73%
- Cash-on-cash
- 33.71%
- DSCR
- 2.50
- GRM
- 4.4
CMA / ARV
- ARV (on-the-fly)
- $187,516
- Comps found
- 3
Show comp detail 3 sales within ~0.75 mi
| Address | Dist | Beds/Ba | Sqft | Sold | Price | $/sf | Match |
|---|---|---|---|---|---|---|---|
| 830 Polk St | 0.24mi | 3/1.0 | 1,086 (+5%) | 12mo | $197,000 | $181 | 71 |
| 111 Mcquigg Ave | 0.41mi | 3/2.0 | 998 (-4%) | 21mo | $270,000 | $271 | 53 |
| 919 Colyer St | 0.48mi | 3/1.0 | 1,092 (+5%) | 19mo | $157,000 | $144 | 53 |
Match score weights: distance 35% · size 25% · config 20% · recency 20%. Top-matched comps best support the ARV.
Projected returns pro-forma
-3.0% appreciation · 1.42% rent growth · sell at horizon
- IRR
- 27.2%
- Equity multiple
- 2.11×
- Total profit
- $26,309
- Equity at exit
- $12,659
- IRR
- 33.8%
- Equity multiple
- 3.86×
- Total profit
- $67,878
- Equity at exit
- $7,341
Cash invested: $23,772 (down + closing). Projections, not guarantees.
Landlord ↔ Tenant lean methodology
- Overall (STATE)
- 87 Strongly Landlord-Friendly
- State Florida
- 87 Strongly Landlord-Friendly · R+3
- County
- — inherits STATE
- City
- — inherits STATE
ZIP-level market 32805
- Home prices YoY
- -7.6%
- Rents YoY
- 1.4%
- Active inventory
- 142
- Price-to-rent
- 4.4×
Monthly cashflow live
- Estimated rent
- $1,592 high interval (Pro) →
- Mortgage (P&I)
- −$445
- Tax from tax record
- −$109 /mo · $1,312/yr
- Insurance
- −$35
- HOA
- −$0
- Vacancy / Maint / Mgmt
- −$334
- Net cashflow
- $668
Break-even live
Sensitivity live
| Price | -10% $716 | -5% $692 | +0% $668 | +5% $644 | +10% $620 |
|---|---|---|---|---|---|
| Rent | -10% $542 | -5% $605 | +0% $668 | +5% $731 | +10% $794 |
| Rate | -1.0pp $711 | -0.5pp $689 | base $668 | +0.5pp $646 | +1.0pp $623 |
UW: 25.0% down · 7.5% · 30yr · 1.5% tax · 5.0% vac · 8.0% maint · 8.0% mgmt
Financing live
Cash to close
- Down payment
- $21,225
- Closing costs
- $2,547
- Reserves months
- —
- Total cash needed
- —
Loan-product check · same deal, 3 products live
Conventional
25% down · 7.5% · 30yr
- Down + closing
- —
- Monthly P&I
- —
- Monthly cashflow
- —
- DSCR
- —
- Eligible?
- —
Personal DTI + credit; lowest rate.
DSCR
20% down · 8.5% · 30yr
- Down + closing
- —
- Monthly P&I
- —
- Monthly cashflow
- —
- DSCR
- —
- Eligible?
- —
No personal income docs; deal must DSCR.
Hard money
10% down · 12.0% · 12mo
- Down + closing
- —
- Monthly P&I
- —
- Monthly cashflow
- —
- DSCR
- —
- Eligible?
- —
Short-term bridge; refi at stabilization.
Rent comps 40 comps
| Address | Beds | Baths | Sqft | Rent | $/sqft | DOM | Units | Dist |
|---|---|---|---|---|---|---|---|---|
| 1045 Polk St Unit 1049B Orlando, FL | 3.0 | 1.0 | 1062 | $1,650 | $1.55 | 25d | 1 | 0.06mi |
| 1045 W Washington St Orlando, FL | 2.0 | 1.0 | 715 | $1,095 | $1.53 | 25d | 1 | 0.06mi |
| 1032 W Jefferson St Unit 5 Orlando, FL | 2.0 | 1.0 | 810 | $940 | $1.16 | 5d | 1 | 0.09mi |
| 1032 W Jefferson St Unit 5 Orlando, FL | 2.0 | 1.0 | 810 | $940 | $1.16 | 12d | 1 | 0.09mi |
| 811 Hills St Orlando, FL | 2.0 | 1.0 | 792 | $1,399 | $1.77 | 25d | 1 | 0.28mi |
| 817 Bentley St Unit A Orlando, FL | 2.0 | 1.0 | 730 | $1,300 | $1.78 | 25d | 1 | 0.32mi |
| 812 W Livingston St Unit A Orlando, FL | 3.0 | 2.0 | 1299 | $1,595 | $1.23 | 25d | 1 | 0.35mi |
| 1028 W South St Unit 1 Orlando, FL | 2.0 | 1.0 | 830 | $995 | $1.20 | 25d | 1 | 0.42mi |
| 666 W Robinson St Orlando, FL | 3.0 | 1.0 | 1008 | $1,190 | $1.18 | 25d | 1 | 0.47mi |
| 1040 Randall St Orlando, FL | 3.0 | 1.0 | 958 | $1,850 | $1.93 | 25d | 1 | 0.49mi |
| 904 Randall St Orlando, FL | 2.0 | 1.0 | 960 | $1,300 | $1.35 | 25d | 1 | 0.54mi |
| 1322 Arlington St Orlando, FL | 3.0 | 1.0 | 846 | $1,750 | $2.07 | 25d | 1 | 0.54mi |
| 659 W Amelia St Orlando, FL | 1.0–3.0 | 1.0–2.0 | 849 | $2,282 | $2.69 | 3d | 27 | 0.61mi |
| 740 W Anderson St Orlando, FL | 2.0 | 1.0 | 700 | $1,180 | $1.69 | 23d | 1 | 0.62mi |
| 480 N Terry Ave Orlando, FL | 3.0 | 1.0–2.0 | 841 | $2,709 | $3.22 | 4d | 29 | 0.65mi |
| 2023 W Pine St Unit 4 Orlando, FL | 2.0 | 1.0 | 720 | $1,195 | $1.66 | 25d | 1 | 0.68mi |
| 711 Arlington St Orlando, FL | 3.0 | 1.0 | 1194 | $1,995 | $1.67 | 13d | 1 | 0.69mi |
| 505 Chatham Ave Orlando, FL | 3.0 | 1.0–2.0 | 1022 | $3,144 | $3.08 | 4d | 27 | 0.70mi |
| 1016 Alba Dr Unit 1016 Orlando, FL | 2.0 | 1.0 | 1008 | $2,100 | $2.08 | 4d | 1 | 0.81mi |
| 637 N Tampa Ave Orlando, FL | 4.0 | 2.0 | 1378 | $2,300 | $1.67 | 5d | 1 | 0.81mi |
| 727 Edgewater Dr Orlando, FL | 2.0 | 1.0 | 900 | $1,700 | $1.89 | 25d | 1 | 0.86mi |
| 414 Sunset Dr Orlando, FL | 3.0 | 1.0 | 1268 | $1,850 | $1.46 | 25d | 1 | 0.90mi |
| 822 S Parramore Ave Apt C Orlando, FL | 2.0 | 1.0 | 754 | $940 | $1.25 | 5d | 1 | 0.92mi |
| 2314 W South St Orlando, FL | 3.0 | 2.0 | 1440 | $2,000 | $1.39 | 16d | 1 | 1.04mi |
| 410 N Orange Ave Orlando, FL | 3.0 | 1.0–3.0 | 854 | $4,725 | $5.53 | 3d | 181 | 1.05mi |
| 613 Citrus St Unit A Orlando, FL | 3.0 | 1.0 | 926 | $1,800 | $1.94 | 25d | 1 | 1.10mi |
| 119 E Pine St Orlando, FL | 2.0 | 2.0 | 960 | $2,950 | $3.07 | 25d | 1 | 1.17mi |
| 2800 W Concord St Orlando, FL | 3.0 | 1.0 | 864 | $844 | $0.98 | 25d | 1 | 1.17mi |
| 335 N Magnolia Ave Orlando, FL | 3.0 | 1.0–3.0 | 1041 | $2,640 | $2.54 | 3d | 35 | 1.17mi |
| 151 E Robinson St Orlando, FL | 4.0 | 1.0–3.5 | 1815 | $7,950 | $4.38 | 16d | 2 | 1.19mi |
| 150 E Robinson St Unit 31B Orlando, FL | 2.0 | 2.0 | 1237 | $3,400 | $2.75 | 19d | 1 | 1.20mi |
| 151 E Washington St Orlando, FL | 2.0 | 2.0 | 1507 | $3,250 | $2.16 | 25d | 2 | 1.20mi |
| 150 E Robinson St Orlando, FL | 2.0 | 1.0–2.0 | 829 | $3,650 | $4.40 | 4d | 9 | 1.20mi |
| 150 E Robinson St Orlando, FL | 2.0 | 1.0–2.0 | 829 | $3,650 | $4.40 | 15d | 6 | 1.20mi |
| 125 E Pine St Orlando, FL | 2.0 | 2.0 | 1237 | $3,150 | $2.55 | 25d | 1 | 1.20mi |
| 750 N Orange Ave Orlando, FL | 1.0–2.0 | 1.0–2.0 | 883 | $2,385 | $2.70 | 3d | 18 | 1.20mi |
| 728 Columbia St Unit A Orlando, FL | 3.0 | 1.0 | 1500 | $1,500 | $1.00 | 25d | 1 | 1.21mi |
| 728 Columbia St Orlando, FL | 3.0 | 1.0 | 1500 | $1,500 | $1.00 | 16d | 1 | 1.21mi |
| 777 N Orange Ave Orlando, FL | 2.0 | 1.0–2.0 | 858 | $2,329 | $2.71 | 4d | 8 | 1.23mi |
| 638 Columbia St Orlando, FL | 4.0 | 1.0 | 1500 | $1,500 | $1.00 | 25d | 1 | 1.24mi |
Listing history 3 events
-
2026-02-08status Pending
-
2026-02-03$84,900 Active
-
2006-06-13soldstatus $45,000
ⓘ Source: listings_history table (triggers on properties + properties_extension) + one-shot
backfill from property_details.listing_events for pre-trigger history.
Tax reassessment forecast FL · Resets to sale price
- Current annual tax
- $1,312 · $109/mo
- Projected year-2 tax
- $1,312 · $109/mo
- Expected delta
- $0/yr ($0/mo · 0.0%)
ⓘ Screening estimate from a state-policy table — verify with the county assessor before closing.
Climate risk First Street
- Flood 1/10 Low FEMA zone X (unshaded) · 0% chance over 30 yrs
- Wildfire 1/10 Low
- Heat 9/10 Extreme 7 d/yr ≥108°F today · 22 d/yr by 30 yrs out
- Wind 9/10 Extreme 99% chance of damaging wind over 30 yrs
- Air quality 1/10 Low 0 unhealthy d/yr today · 0 by 30 yrs out
Nearby sold comps map
Loading sold comps map…
Walkable amenities ~0.75 mi
Loading nearby amenities…
Taxation est. · year 1
- Rental income
- $19,104
- − Mortgage interest
- −$4,756
- − Property taxes
- −$1,312
- − Insurance
- −$424
- − Repairs & maintenance
- −$1,528
- − Management
- −$1,528
- − Depreciation
- −$2,470
- Taxable income
- $7,086
- Est. tax owed @ 24.0%
- −$1,701
- After-tax cash flow
- $6,313/yr
For passive investors: Depreciation is non-cash, so a rental often shows a tax loss while cash-flowing — sheltering income. Rental losses are passive: they offset passive income freely, and up to $25,000/yr can offset ordinary (W-2) income if you actively participate and your MAGI is under $100k (phasing out to $0 by $150k); unused losses carry forward. On sale, claimed depreciation is recaptured at up to 25%, and gains may owe capital-gains tax (a 1031 exchange can defer both). Figures are a year-1 estimate at your 24.0% rate — not tax advice; consult a CPA.
Schools (NCES district)
- District
- Orange
- NCES district ID
- 1201440
- Math proficiency
- 46% ▼ -9.00%
- Reading proficiency
- 51% ▼ -2.00%
- Median HH income
- $49,350
- Composite
- 41.47/100
- National rank
- #3461
- State rank
- #43 of 73 in FL
Livability — Orlando
- Score
- 86/100
- State rank
- #12
- US rank
- #360
Category grades
Schools grade is shown separately in the Schools card above.
Census & demographics
- Census place
- Orlando, FL
- County
- Orange County · 1,471,359 people
- City population
- 964,969
- Metro
- Orlando-Kissimmee-Sanford, FL
- Population (ZIP)
- 19,294
- Household income
- $40,515
- Rent vs Own
- Severe rent burden
- 1597.0
Population outlook (Orange County) Hauer SSP2
- Today (2025)
- 1,618,226 people
- By 2030
- 1,787,404 · +10.5%
- By 2040
- 2,125,621 · +31.4%
- By 2050
- 2,454,016 · +51.6%
- By 2075
- 3,173,711 · +96.1%
- By 2100
- 3,607,781 · +122.9%
Race, ethnicity, and origin ACS 2023
- Neighborhood character
- Predominantly Black (70%)
- Race & ethnicity
- Black 70% Hispanic / Latino 15% White 13% Two or more races 8%
- Hispanic origin (detail)
- Mexican 3% Puerto Rican 4% Cuban 1% Dominican 3%
- Common ancestry
- Hispanic 9% Russian 1%
- Foreign-born
- 16% · Canada, Jamaica
- Languages at home
- 80% English-only · Spanish 11% French/Haitian/Cajun 8%
Political lean MEDSL · Orange
- 2024 margin
- D (+13.6) · D 56.1% · R 42.5% · Other 1.3%
- 2008→2024 swing
- -5.0pp toward R · 2008: 18.6pp · 2024: 13.6pp
- All cycles
- 2024: D+13.6 2020: D+23.1 2016: D+24.6 2012: D+18.2 2008: D+18.6
Not yet ingested
- Civics
- —
Market trends
- HPI YoY
- ▼ -35.19%
- Current HPI
- 429.3242
- Rent YoY
- ▲ 1.42%
- Metro
- Orlando-Kissimmee-Sanford, FL
- State GDP YoY
- ▲ 3.28%
- F500 in state
- 36
Industry mix (Fortune 500 HQ in FL)
| Industry | F500 HQs | Revenue |
|---|---|---|
| Industrial Technology | 2 | $29B |
|
||
| Insurance | 2 | $17B |
|
||
| Retail | 1 | $60B |
|
||
| Technology Distribution | 1 | $58B |
|
||
| Homebuilding | 1 | $35B |
|
||
| Technology Manufacturing | 1 | $35B |
|
||
Price history
+88.7% since first listed3 events — show timeline
- 2026-02-08 Pending — Stellar MLS as Distributed by MLS Grid
- 2026-02-03 Listed $84,900 Stellar MLS as Distributed by MLS Grid
- 2006-06-13 Sold (Public Records) $45,000 Public Records
Property tax history
+9.0%/yrLatest (2025): $1,312 · +7.6% YoY. Source: county tax records.
Cash-flow waterfall
monthlySold comps — $/sqft
last 12 mo · ≤1 miLoading sold comps…