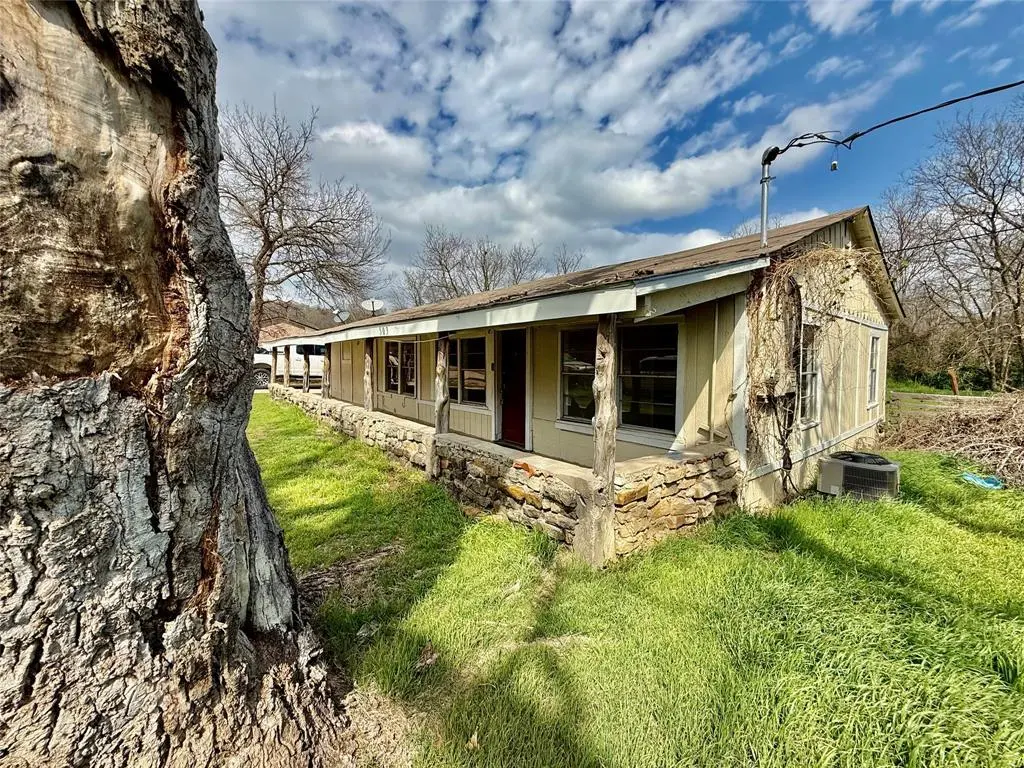
503 SW 15th Ave · Mineral Wells, TX
Flood risk 1/10 · Minimal
- FEMA flood zone
- X (unshaded)
- Chance of flooding over 30 yrs
- 0.0%
- Est. flood insurance / yr
- $507 – $1,088
Fire risk 7/10 · Major
- Est. fire insurance / yr
- $1,222 – $2,270
Heat risk 7/10 · Major
- Hot days now (above 109°F)
- 7 days/yr
- Hot days in 30 yrs
- 22 days/yr
Wind risk 4/10 · Minor
- Chance of severe wind over 30 yrs
- 18.0%
Air-quality risk 2/10 · Minimal
- Unhealthy air days now
- 1 days/yr
- Unhealthy air days in 30 yrs
- 1 days/yr
Risk factors via First Street. Map © Google.
Why this score? — see what drove the B- grade
The composite is a weighted blend of 9 inputs, each scored 0–100. Each bar is that input's sub-score; the figure is the points it added to the 100-point composite (weight × sub-score).
- Cash flow +24.4/30.0
- ARV discount +15.0/15.0
- DSCR +7.9/10.0
- 1% rule +7.1/10.0
- Livability +3.6/5.0
- Rent growth +2.5/5.0
- Schools +2.5/10.0
- Condition / age +2.5/5.0
- Appreciation +0.0/10.0
$118,000
🖨 Deal sheet (PDF) 📄 Offer letter ✓ Due diligence
Listing remarks MLS
3 bedroom, 2 bath home with just over 1,100 sq ft of comfortable living space. This home features a spacious open-concept, split floor plan with a large living room and kitchen—perfect for everyday living and entertaining. Step outside to a large fenced backyard offering privacy and room to relax, along with a covered front porch ideal for enjoying your morning coffee. A great opportunity with plenty to offer! Bring your offers! Would make the perfect rental property or starter home with a little work.
Key facts
- Covered front porch
- Large living room
- 6,403 sq ft lot
Tags
Neighborhood map
What this means for you Summary
Snapshot
- This is a 3-bed/2.0-bath single-family listed at $118k.
Deal economics
- At list price, monthly cash flow is $240 ($3k/yr) — positive.
- The deal already cash-flows at list — no discount required.
- Meets the 1% rule at list price ($1k rent vs $118k).
- Recommended offer: $107k (9.0% below list) — sets the bar for market timing.
- Cap rate 8.7% vs local median 2.7% in Mineral Wells — top-decile yield for the area; either an underpriced asset or a hidden risk that comps aren't pricing in. Stress-test before assuming the spread holds.
Location & tenants
- Location reads 72/100 on livability (#278 in TX) — a middle-class / working-renter tenant base. Strengths: cost of living A+, housing A+, health & safety A+; Watch: crime D+, employment D, schools F.
- Mineral Wells ISD (town): math 30% / reading 30% proficiency, ranked #636 of 826 in TX (top 77%) — families likely to look elsewhere, expect single-tenant / working-renter base with shorter leases.
- Market conditions: 279 active listings in the ZIP; 1 comparable units currently listed for rent nearby; 27 units permitted in Palo Pinto County in 2024 (0 in 5+ unit buildings).
Forward outlook
- Local home prices are declining (-3.0%/yr); year-one equity from $816 of loan paydown is wiped out by about $4k of value loss. Plan a longer hold.
- Palo Pinto County population projected to shrink 8% by 2050 — rents likely to lag national; underwrite the cash flow, not the appreciation.
Negotiation context
- It's been on market 102 days — a 9% lower offer ($107k) is reasonable based on typical stale-listing flexibility.
- 6 sale attempts since 5y ago with the ask held roughly flat each time — persistent listings suggest the price (not the market) is what's stuck; bring a comps-based counter.
Risks & watch-outs
- Watch-outs: built in 1950 — expect roof / HVAC / electrical / plumbing capex.
- Climate carrying-cost: major wildfire risk; extreme-heat days projected 7→22/yr by 2055 (HVAC capex compounding) — expect insurance premiums to compound above CPI over the hold.
Questions for the listing agent
- It's been on market 102 days. Have you received any prior offers? Is the seller open to a 9% concession, seller financing, or rate buy-down credit?
- Built in 1950 — when were the roof, HVAC, electrical panel, plumbing, and water heater last replaced?
- Why hasn't it sold? Are there any deal-killer items the seller is aware of (foundation, flood, title, zoning, code violations)?
- Is there a deadline driving the sale (1031 exchange, divorce, estate, relocation)? That informs how much negotiation room exists.
- Schools are F-rated, which usually means shorter tenancies and higher turnover. Who's the typical renter profile here, and what's been the actual vacancy rate?
- Crime grade is D in this area — have there been break-ins, vandalism, or insurance claims at this property in the last 3 years? What carrier currently insures it and at what premium?
- What's the average days-on-market for RENTAL listings here right now (not sales)? A rising rental-DOM trend means longer vacancies and softer asking-rent achievability than the comps imply.
- What's the recent tenant-quality profile in this submarket — average credit score on applications, eviction rate, late-payment / NSF rate, and stable-employment percentage? A property-management company in the area should have these aggregated.
- How much new for-sale + rental construction is in the pipeline within 1–3 miles? Heavy new supply typically softens prices + rents 12–24 months out; constrained supply supports both.
Investment metrics
- 1% rule
- 1.21% ✓
- Cap rate
- 8.74%
- Cash-on-cash
- 8.73%
- DSCR
- 1.39
- GRM
- 6.9
CMA / ARV
- ARV (median comp)
- $155,048
- List price
- $118,000
- Delta
- -23.89%
- Verdict
- UNDERPRICED
- Comps
- 20 within 1.0 mi
Show comp detail 10 sales within ~0.75 mi
| Address | Dist | Beds/Ba | Sqft | Sold | Price | $/sf | Match |
|---|---|---|---|---|---|---|---|
| 303 SW 14th Ave | 0.09mi | 3/2.0 | 1,114 (+1%) | 14mo | $148,998 | $134 | 84 |
| 301 SW 14th Ave | 0.09mi | 3/2.0 | 1,114 (+1%) | 19mo | $149,000 | $134 | 79 |
| 612 SW 15th Ave | 0.13mi | 3/2.0 | 1,157 (+4%) | 12mo | $125,000 | $108 | 76 |
| 503 SW 13th Ave | 0.15mi | 3/2.0 | 1,176 (+6%) | 11mo | $125,000 | $106 | 74 |
| 811 SW 16th St | 0.72mi | 3/2.0 | 1,100 (-1%) | 13mo | $195,000 | $177 | 55 |
| 505 SW 13th Ave | 0.15mi | 2/1.0 (-1) | 976 (-12%) | 12mo | $112,500 | $115 | 54 |
| 813 SW 16th St | 0.72mi | 3/2.0 | 1,100 (-1%) | 14mo | $195,000 | $177 | 54 |
| 817 SW 16th St | 0.72mi | 3/2.0 | 1,152 (+4%) | 9mo | $200,000 | $174 | 52 |
| 815 SW 16th St | 0.72mi | 3/2.0 | 1,100 (-1%) | 19mo | $200,000 | $182 | 49 |
| 713 SW 9th St | 0.68mi | 3/1.0 | 1,176 (+6%) | 18mo | $125,000 | $106 | 39 |
Match score weights: distance 35% · size 25% · config 20% · recency 20%. Top-matched comps best support the ARV.
Projected returns pro-forma
-3.0% appreciation · 3.0% rent growth · sell at horizon
- IRR
- -3.0%
- Equity multiple
- 0.89×
- Total profit
- $-3,748
- Equity at exit
- $17,594
- IRR
- 6.7%
- Equity multiple
- 1.51×
- Total profit
- $16,718
- Equity at exit
- $10,202
Cash invested: $33,040 (down + closing). Projections, not guarantees.
Landlord ↔ Tenant lean methodology
- Overall (STATE)
- 87 Strongly Landlord-Friendly
- State Texas
- 87 Strongly Landlord-Friendly · R+5
- County
- — inherits STATE
- City
- — inherits STATE
ZIP-level market 76067
- Active inventory
- 279
- Price-to-rent
- 6.9×
Monthly cashflow live
- Estimated rent
- $1,430 medium interval (Pro) →
- Mortgage (P&I)
- −$619
- Tax from tax record
- −$222 /mo · $2,661/yr
- Insurance
- −$49
- HOA
- −$0
- Vacancy / Maint / Mgmt
- −$300
- Net cashflow
- $240
Break-even live
Sensitivity live
| Price | -10% $307 | -5% $274 | +0% $240 | +5% $207 | +10% $174 |
|---|---|---|---|---|---|
| Rent | -10% $127 | -5% $184 | +0% $240 | +5% $297 | +10% $353 |
| Rate | -1.0pp $300 | -0.5pp $270 | base $240 | +0.5pp $210 | +1.0pp $179 |
UW: 25.0% down · 7.5% · 30yr · 1.5% tax · 5.0% vac · 8.0% maint · 8.0% mgmt
Financing live
Cash to close
- Down payment
- $29,500
- Closing costs
- $3,540
- Reserves months
- —
- Total cash needed
- —
Loan-product check · same deal, 3 products live
Conventional
25% down · 7.5% · 30yr
- Down + closing
- —
- Monthly P&I
- —
- Monthly cashflow
- —
- DSCR
- —
- Eligible?
- —
Personal DTI + credit; lowest rate.
DSCR
20% down · 8.5% · 30yr
- Down + closing
- —
- Monthly P&I
- —
- Monthly cashflow
- —
- DSCR
- —
- Eligible?
- —
No personal income docs; deal must DSCR.
Hard money
10% down · 12.0% · 12mo
- Down + closing
- —
- Monthly P&I
- —
- Monthly cashflow
- —
- DSCR
- —
- Eligible?
- —
Short-term bridge; refi at stabilization.
Rent comps 1 comps
| Address | Beds | Baths | Sqft | Rent | $/sqft | DOM | Units | Dist |
|---|---|---|---|---|---|---|---|---|
| 513 SE 6th St Unit 6 Mineral Wells, TX | 2.0 | 1.0 | 1200 | $1,350 | $1.12 | 44d | 1 | 1.30mi |
Listing history 39 events
-
2026-06-21days on market $118,000 Active 102 DOM
-
2026-06-19days on market $118,000 Active 100 DOM
-
2026-06-18days on market $118,000 Active 99 DOM
-
2026-06-17days on market $118,000 Active 98 DOM
-
2026-06-16days on market $118,000 Active 97 DOM
-
2026-06-15days on market $118,000 Active 96 DOM
-
2026-06-14days on market $118,000 Active 94 DOM
-
2026-06-12days on market $118,000 Active 93 DOM
-
2026-06-09days on market $118,000 Active 90 DOM
-
2026-06-08days on market $118,000 Active 89 DOM
-
2026-06-07days on market $118,000 Active 88 DOM
-
2026-06-07days on market $118,000 Active 87 DOM
-
2026-06-04days on market $118,000 Active 84 DOM
-
2026-06-02days on market $118,000 Active 83 DOM
-
2026-06-01days on market $118,000 Active 82 DOM
-
2026-05-31days on market $118,000 Active 81 DOM
-
2026-05-31days on market $118,000 Active 80 DOM
-
2026-05-08price $118,000 513-char remark
Show marketing remark (513 chars)
3 bedroom, 2 bath home with just over 1,100 sq ft of comfortable living space. This home features a spacious open-concept, split floor plan with a large living room and kitchen—perfect for everyday living and entertaining. Step outside to a large fenced backyard offering privacy and room to relax, along with a covered front porch ideal for enjoying your morning coffee. A great opportunity with plenty to offer! Bring your offers! Would make the perfect rental property or starter home with a little work.
-
2026-03-20price $99,000 513-char remark
Show marketing remark (513 chars)
3 bedroom, 2 bath home with just over 1,100 sq ft of comfortable living space. This home features a spacious open-concept, split floor plan with a large living room and kitchen—perfect for everyday living and entertaining. Step outside to a large fenced backyard offering privacy and room to relax, along with a covered front porch ideal for enjoying your morning coffee. A great opportunity with plenty to offer! Bring your offers! Would make the perfect rental property or starter home with a little work.
-
2026-03-11$119,000 Active 513-char remark
Show marketing remark (513 chars)
3 bedroom, 2 bath home with just over 1,100 sq ft of comfortable living space. This home features a spacious open-concept, split floor plan with a large living room and kitchen—perfect for everyday living and entertaining. Step outside to a large fenced backyard offering privacy and room to relax, along with a covered front porch ideal for enjoying your morning coffee. A great opportunity with plenty to offer! Bring your offers! Would make the perfect rental property or starter home with a little work.
-
2025-06-04$140,000 Active
-
2025-04-07historical $1,295
-
2025-04-05$1,295
-
2025-04-05historical $1,295
-
2025-03-01historical $1,295
-
2024-10-05price $1,295
-
2024-10-05price $1,295
-
2024-09-05$1,350
-
2024-09-05price $1,350
-
2024-08-02$1,495
-
2022-04-01soldstatus
-
2021-12-21soldstatus
-
2021-09-21soldstatus
-
2021-09-16soldstatus Sold
-
2021-09-02status Pending
-
2021-07-19$114,900 Active
-
2009-10-06soldstatus
-
2006-04-28soldstatus
-
1995-12-13soldstatus
ⓘ Source: listings_history table (triggers on properties + properties_extension) + one-shot
backfill from property_details.listing_events for pre-trigger history.
Tax reassessment forecast TX · Resets to sale price
- Current annual tax
- $2,661 · $222/mo
- Projected year-2 tax
- $2,661 · $222/mo
- Expected delta
- $0/yr ($0/mo · 0.0%)
ⓘ Screening estimate from a state-policy table — verify with the county assessor before closing.
Climate risk First Street
- Flood 1/10 Low FEMA zone X (unshaded) · 0% chance over 30 yrs
- Wildfire 7/10 Severe
- Heat 7/10 Severe 7 d/yr ≥109°F today · 22 d/yr by 30 yrs out
- Wind 4/10 Moderate 18% chance of damaging wind over 30 yrs
- Air quality 2/10 Low 1 unhealthy d/yr today · 1 by 30 yrs out
Nearby sold comps map
Loading sold comps map…
Walkable amenities ~0.75 mi
Loading nearby amenities…
Taxation est. · year 1
- Rental income
- $17,165
- − Mortgage interest
- −$6,610
- − Property taxes
- −$2,661
- − Insurance
- −$590
- − Repairs & maintenance
- −$1,373
- − Management
- −$1,373
- − Depreciation
- −$3,433
- Taxable income
- $1,125
- Est. tax owed @ 24.0%
- −$270
- After-tax cash flow
- $2,614/yr
For passive investors: Depreciation is non-cash, so a rental often shows a tax loss while cash-flowing — sheltering income. Rental losses are passive: they offset passive income freely, and up to $25,000/yr can offset ordinary (W-2) income if you actively participate and your MAGI is under $100k (phasing out to $0 by $150k); unused losses carry forward. On sale, claimed depreciation is recaptured at up to 25%, and gains may owe capital-gains tax (a 1031 exchange can defer both). Figures are a year-1 estimate at your 24.0% rate — not tax advice; consult a CPA.
Schools (NCES district)
- District
- Mineral Wells ISD
- NCES district ID
- 4830950
- Math proficiency
- 30% ▼ -10.00%
- Reading proficiency
- 30% ▼ -5.00%
- Median HH income
- $40,027
- Composite
- 25.26/100
- National rank
- #7500
- State rank
- #636 of 826 in TX
Livability — Mineral Wells
- Score
- 72/100
- State rank
- #278
- US rank
- #6474
Category grades
Schools grade is shown separately in the Schools card above.
Census & demographics
- Census place
- Mineral Wells, TX
- County
- Palo Pinto County · 21,080 people
- City population
- 21,080
- Metro
- Mineral Wells, TX
- Population (ZIP)
- 21,080
- Household income
- $62,190
- Rent vs Own
- Severe rent burden
- 745.0
Population outlook (Palo Pinto County) Hauer SSP2
- Today (2025)
- 27,500 people
- By 2030
- 27,079 · -1.5%
- By 2040
- 26,135 · -5.0%
- By 2050
- 25,215 · -8.3%
- By 2075
- 23,416 · -14.9%
- By 2100
- 20,300 · -26.2%
Race, ethnicity, and origin ACS 2023
- Neighborhood character
- Predominantly White (70%)
- Race & ethnicity
- White 70% Hispanic / Latino 22% Two or more races 9% Black 4% Asian 1%
- Hispanic origin (detail)
- Mexican 19%
- Common ancestry
- Lithuanian 4% Italian 1% Slovak 1%
- Foreign-born
- 6% · Canada
- Languages at home
- 86% English-only · Spanish 13% Other Indo-European 1%
Political lean MEDSL · Palo Pinto
- 2024 margin
- Solid R (+67.1) · D 16.1% · R 83.2%
- 2008→2024 swing
- -18.9pp toward R · 2008: -48.2pp · 2024: -67.1pp
- All cycles
- 2024: R+67.1 2020: R+64.1 2016: R+64.1 2012: R+59.8 2008: R+48.2
Not yet ingested
- Civics
- —
Market trends
- HPI YoY
- ▼ -134.09%
- Current HPI
- 240.3647
- Rent YoY
- —
- Metro
- Mineral Wells, TX
- State GDP YoY
- ▲ 3.95%
- F500 in state
- 110
Industry mix (Fortune 500 HQ in TX)
| Industry | F500 HQs | Revenue |
|---|---|---|
| Energy | 16 | $1,198B |
|
||
| Technology | 5 | $198B |
|
||
| Engineering / Construction | 4 | $72B |
|
||
| Energy Services | 3 | $60B |
|
||
| Utilities | 3 | $41B |
|
||
| Healthcare | 2 | $330B |
|
||
Price history
+2.7% since first listed22 events — show timeline
- 2026-05-08 Price Changed $118,000 NTREIS
- 2026-03-20 Price Changed $99,000 NTREIS
- 2026-03-11 Listed $119,000 NTREIS
- 2025-06-04 Listed $140,000 NTREIS
- 2025-04-07 Rental Removed $1,295 NTREIS
- 2025-04-05 Listed for Rent $1,295 NTREIS
- 2025-04-05 Rental Removed $1,295 APPFOLIO
- 2025-03-01 Rental Removed $1,295 NTREIS
- 2024-10-05 Price Changed $1,295 NTREIS
- 2024-10-05 Price Changed $1,295 APPFOLIO
- 2024-09-05 Listed for Rent $1,350 NTREIS
- 2024-09-05 Price Changed $1,350 APPFOLIO
- 2024-08-02 Listed for Rent $1,495 APPFOLIO
- 2022-04-01 Sold (Public Records) — Public Records
- 2021-12-21 Sold (Public Records) — Public Records
- 2021-09-21 Sold (Public Records) — Public Records
- 2021-09-16 Sold (MLS) — NTREIS
- 2021-09-02 Pending — NTREIS
- 2021-07-19 Listed $114,900 NTREIS
- 2009-10-06 Sold (Public Records) — Public Records
- 2006-04-28 Sold (Public Records) — Public Records
- 1995-12-13 Sold (Public Records) — Public Records
Property tax history
+23.5%/yrLatest (2025): $2,661 · +1.8% YoY. Source: county tax records.
Cash-flow waterfall
monthlySold comps — $/sqft
last 12 mo · ≤1 miLoading sold comps…