 🏗️ New Construction
7384 Alley Oak Ln · Maurice, LA
Flood risk No data
- FEMA flood zone
- —
- Chance of flooding over 30 yrs
- —
- Est. flood insurance / yr
- —
Fire risk No data
- Est. fire insurance / yr
- —
Heat risk No data
- Hot days now (above threshold)
- —
- Hot days in 30 yrs
- —
Wind risk No data
- Chance of severe wind over 30 yrs
- —
Air-quality risk No data
- Unhealthy air days now
- —
- Unhealthy air days in 30 yrs
- —
Risk factors via First Street. Map © Google.
Why this score? — see what drove the D- grade
The composite is a weighted blend of 9 inputs, each scored 0–100. Each bar is that input's sub-score; the figure is the points it added to the 100-point composite (weight × sub-score).
- Cash flow +10.5/30.0
- ARV discount +7.5/15.0
- Condition / age +4.8/5.0
- Schools +3.9/10.0
- Livability +3.8/5.0
- 1% rule +3.3/10.0
- DSCR +3.0/10.0
- Rent growth +2.5/5.0
- Appreciation +0.0/10.0
$238,070
🖨 Deal sheet (PDF) 📄 Offer letter ✓ Due diligence
Listing remarks MLS
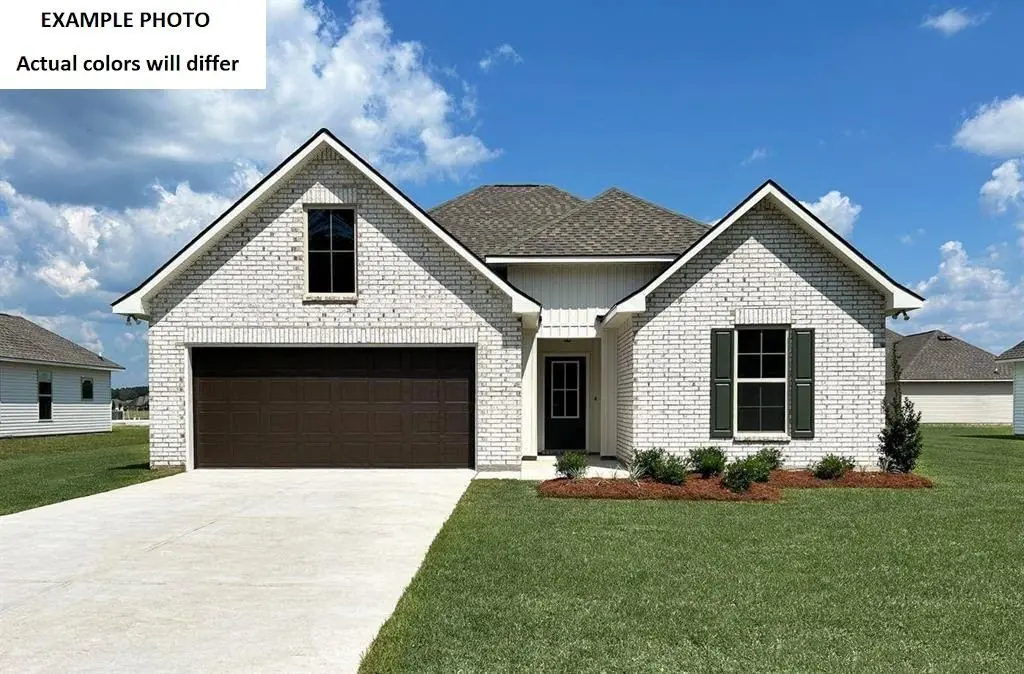
* 2/1 buydown with rate as low as 3.99% for the first 12 months. Contact Builder Sales Rep(s) for current incentive details. * Located on a Corner Lot! The LIBERTY V H has an open floor plan with 3 bedrooms, 2 full bathrooms + a computer nook. This home includes upgraded quartz counters, stainless appliances, cabinet hardware, undermount cabinet lighting & more. Special plan features: kitchen island, garden tub, separate shower & walk-in closet in master, Wi-Fi thermostat, structured wiring panel box, tank-less gas water heater, covered patio, fully sodded yard & more!
Key facts
- Open floor plan
- Quartz counters
- Computer nook
Tags
Property features AI
Finance
- HOA & community: Homeowners association with annual fee of $390; Association fee covers accounting and insurance; Association provides management services
Exterior
- Parking: 2 covered parking spaces; 2 total parking spaces; Has garage (2 spaces)
- Utilities: Public sewer; Electric service: Entergy
- Home design: Single family residence; Under construction; Residential zoning
- Construction: Brick veneer and vinyl siding over frame construction; Composition roof
- Exterior features: Exterior lighting; Covered and open porch/patio
Interior
- Kitchen: Dishwasher; Disposal; Microwave; Electric stove/convection
- Bedrooms: Bedroom 2; Bedroom 3
- Flooring: Carpet; Vinyl plank
- Bathrooms: 2 full bathrooms
- Heating & cooling: Central heating (natural gas); Central air conditioning
- Interior features: High ceilings; Computer nook; Double vanity in bathroom; Kitchen island; Separate shower; Varied ceiling heights; Walk-in closet(s); Dining room; Living room; Quartz countertops
- Laundry & utility: Washer hookup; Electric dryer hookup
Neighborhood map
What this means for you Summary
Snapshot
- This is a 3-bed/2.0-bath single-family listed at $238k. Condition is rated excellent.
Deal economics
- At list price, monthly cash flow is $-131 ($-2k/yr) — negative.
- To cash-flow at today's rent, offer at most $235k (1.3% below list).
- To meet the 1% rule (rent ≥ 1% of price), the offer needs to be $210k (11.9% below list).
- Recommended offer: $210k (11.9% below list) — sets the bar for 1% rule.
Location & tenants
- Location reads 76/100 on livability (#15 in LA, #3,333 nationally) — a middle-class / working-renter tenant base. Strengths: crime A+, cost of living A+, housing A+; Watch: amenities F, commute F.
- Vermilion Parish (town): math 40% / reading 53% proficiency, ranked #15 of 98 in LA (top 15%) — families likely to look elsewhere, expect single-tenant / working-renter base with shorter leases.
- Zoned schools: Cecil Picard Elementary School At Maurice (math 61% / reading 68%, grade B, #40 of 646 statewide, top 7%, 845 students, 42% FRL); North Vermilion Middle School (math 47% / reading 53%, grade C, #26 of 218 statewide, top 12%, 656 students, 45% FRL); North Vermilion High School (math 57% / reading 63%, grade C+, #20 of 265 statewide, top 7%, 854 students, 44% FRL).
- Market conditions: 249 active listings in the ZIP; 6 comparable units currently listed for rent nearby; rentals lingering (median 46d on market — plan ~5-8 weeks vacancy on turnover, expect pricing pressure); 50% of comp listings sitting > 30 days — soft ceiling on asking rent; solid renter incomes; 228 units permitted in Vermilion Parish in 2024 (0 in 5+ unit buildings).
- This rent runs 33% of the median local income ($76k/yr) — at the standard rent-burdened threshold; future hikes will face affordability resistance.
Forward outlook
- Local home prices are declining (-3.0%/yr); year-one equity from $2k of loan paydown is wiped out by about $8k of value loss. Plan a longer hold.
- Vermilion County population projected at +10% by 2050 — modest demand growth; plan on rents tracking national, not racing it.
Negotiation context
- Only 9 days on market — expect competitive offers; lowballing is unlikely to land.
- 2 sale attempts with the ask held roughly flat each time — persistent listings suggest the price (not the market) is what's stuck; bring a comps-based counter.
Questions for the listing agent
- What do current leases actually rent for vs. the listed asking? Can we see a recent rent roll and the last 12 months of T-12 income?
- What does the HOA fee cover, when was the last increase, and are there any pending special assessments or reserve-fund shortfalls?
- Is there a deadline driving the sale (1031 exchange, divorce, estate, relocation)? That informs how much negotiation room exists.
- Schools are A-rated — typically a magnet for longer-tenancy family renters. What's the average tenant stay here, and is there a school-zone premium baked into asking?
- The area grade is low — what's the realistic commute time and amenity access for the typical tenant pool here? Any planned neighborhood developments (good or bad) we should know about?
- What's the average days-on-market for RENTAL listings here right now (not sales)? A rising rental-DOM trend means longer vacancies and softer asking-rent achievability than the comps imply.
- What's the recent tenant-quality profile in this submarket — average credit score on applications, eviction rate, late-payment / NSF rate, and stable-employment percentage? A property-management company in the area should have these aggregated.
- How much new for-sale + rental construction is in the pipeline within 1–3 miles? Heavy new supply typically softens prices + rents 12–24 months out; constrained supply supports both.
Investment metrics
- 1% rule
- 0.83% ✗
- Cap rate
- 5.68%
- Cash-on-cash
- -2.20%
- DSCR
- 0.90
- GRM
- 10.1
CMA / ARV
- ARV (on-the-fly)
- $253,946
- Comps found
- 12
Show comp detail 12 sales within ~0.75 mi
| Address | Dist | Beds/Ba | Sqft | Sold | Price | $/sf | Match |
|---|---|---|---|---|---|---|---|
| 7375 Alley Oak Ln | 0.05mi | 3/2.0 | 1,649 (0%) | 1mo | $237,470 | $144 | 97 |
| 7403 Alley Oak Ln | 0.05mi | 3/2.0 | 1,649 (0%) | 1mo | $246,132 | $149 | 97 |
| 7411 Alley Oak Ln | 0.05mi | 3/2.0 | 1,649 (0%) | 1mo | $246,726 | $150 | 97 |
| 7389 Alley Oak Ln | 0.05mi | 3/2.0 | 1,649 (0%) | 4mo | $238,080 | $144 | 95 |
| 7410 Seven Oaks Cir | 0.11mi | 3/2.0 | 1,649 (0%) | 3mo | $245,000 | $149 | 92 |
| 7385 Alley Oak Ln | 0.05mi | 3/2.0 | 1,578 (-4%) | 1mo | $234,425 | $149 | 90 |
| 7399 Alley Oak Ln | 0.05mi | 3/2.0 | 1,490 (-10%) | 4mo | $230,114 | $154 | 79 |
| 7392 Alley Oak Ln | 0.05mi | 3/2.0 | 1,498 (-9%) | 5mo | $230,835 | $154 | 79 |
| 7386 Alley Oak Ln | 0.05mi | 3/2.0 | 1,422 (-14%) | 1mo | $219,385 | $154 | 74 |
| 7395 Alley Oak Ln | 0.05mi | 3/2.0 | 1,422 (-14%) | 5mo | $219,825 | $155 | 71 |
| 3512 Minvielle Blvd | 0.38mi | 4/3.0 (+1) | 1,719 (+4%) | 3mo | $280,000 | $163 | 64 |
| 3415 Autumn Park Dr | 0.18mi | 4/2.0 (+1) | 1,458 (-12%) | 5mo | $229,235 | $157 | 63 |
Match score weights: distance 35% · size 25% · config 20% · recency 20%. Top-matched comps best support the ARV.
Projected returns pro-forma
-3.0% appreciation · 3.0% rent growth · sell at horizon
- IRR
- -19.9%
- Equity multiple
- 0.31×
- Total profit
- $-49,414
- Equity at exit
- $37,864
- IRR
- -12.8%
- Equity multiple
- 0.25×
- Total profit
- $-53,526
- Equity at exit
- $21,957
Cash invested: $71,105 (down + closing). Projections, not guarantees.
Landlord ↔ Tenant lean methodology
- Overall (STATE)
- 90 Strongly Landlord-Friendly
- State Louisiana
- 90 Strongly Landlord-Friendly · R+12
- County
- — inherits STATE
- City
- — inherits STATE
ZIP-level market 70555
- Home prices YoY
- -29.4%
- Active inventory
- 249
- Price-to-rent
- 9.5×
Monthly cashflow live
- Estimated rent
- $2,098 high interval (Pro) →
- Mortgage (P&I)
- −$1,332
- Tax est. 1.5%
- −$317 /mo · $3,809/yr
- Insurance
- −$106
- HOA
- −$33
- Vacancy / Maint / Mgmt
- −$441
- Net cashflow
- $-131
Break-even live
Sensitivity live
| Price | -10% $45 | -5% $-43 | +0% $-131 | +5% $-218 | +10% $-306 |
|---|---|---|---|---|---|
| Rent | -10% $-296 | -5% $-213 | +0% $-131 | +5% $-48 | +10% $35 |
| Rate | -1.0pp $-3 | -0.5pp $-66 | base $-131 | +0.5pp $-196 | +1.0pp $-263 |
UW: 25.0% down · 7.5% · 30yr · 1.5% tax · 5.0% vac · 8.0% maint · 8.0% mgmt
Financing live
Cash to close
- Down payment
- $63,486
- Closing costs
- $7,618
- Reserves months
- —
- Total cash needed
- —
Loan-product check · same deal, 3 products live
Conventional
25% down · 7.5% · 30yr
- Down + closing
- —
- Monthly P&I
- —
- Monthly cashflow
- —
- DSCR
- —
- Eligible?
- —
Personal DTI + credit; lowest rate.
DSCR
20% down · 8.5% · 30yr
- Down + closing
- —
- Monthly P&I
- —
- Monthly cashflow
- —
- DSCR
- —
- Eligible?
- —
No personal income docs; deal must DSCR.
Hard money
10% down · 12.0% · 12mo
- Down + closing
- —
- Monthly P&I
- —
- Monthly cashflow
- —
- DSCR
- —
- Eligible?
- —
Short-term bridge; refi at stabilization.
Rent comps 6 comps
| Address | Beds | Baths | Sqft | Rent | $/sqft | DOM | Units | Dist |
|---|---|---|---|---|---|---|---|---|
| 3408 Magnolia Lakes Blvd Maurice, LA | 4.0 | 2.0 | 2098 | $2,075 | $0.99 | 45d | 1 | 0.27mi |
| 3504 Canebreak Mill Dr Maurice, LA | 3.0–4.0 | 2.0 | 1502 | $1,700 | $1.13 | 15d | 8 | 0.49mi |
| 8550 Cat Rd Unit B Maurice, LA | 3.0 | 2.0 | 1324 | $1,650 | $1.25 | 45d | 1 | 0.95mi |
| 128 Rose Of Sharon Ln Lafayette, LA | 4.0 | 3.0 | 2092 | $2,100 | $1.00 | 46d | 1 | 1.20mi |
| 224 Wild Cherry Ln Lafayette, LA | 3.0 | 2.0 | 2212 | $2,200 | $0.99 | 15d | 1 | 1.20mi |
| 222 Weaver Way Maurice, LA | 3.0 | 2.0 | 1538 | $1,850 | $1.20 | 15d | 1 | 1.44mi |
HOA detail
- Monthly dues
- $33 · $396/yr
- Likely covers
- watergasinternet
Listing history 7 events
-
2026-06-22days on market $238,070 Active 9 DOM
-
2026-06-18days on market $238,070 Active 6 DOM
-
2026-06-17days on market $238,070 Active 5 DOM
-
2026-06-16days on market $238,070 Active 4 DOM
-
2026-06-15days on market $238,070 Active 3 DOM
-
2026-06-13remarks 576-char remark
-
2026-06-13$238,070 Active 1 DOM
ⓘ Source: listings_history table (triggers on properties + properties_extension) + one-shot
backfill from property_details.listing_events for pre-trigger history.
Nearby sold comps map
Loading sold comps map…
Walkable amenities ~0.75 mi
Loading nearby amenities…
Taxation est. · year 1
- Rental income
- $25,176
- − Mortgage interest
- −$14,225
- − Property taxes
- −$3,809
- − Insurance
- −$1,270
- − Repairs & maintenance
- −$2,014
- − Management
- −$2,014
- − HOA
- −$396
- − Depreciation
- −$7,388
- Taxable loss
- −$5,940
- Est. tax savings @ 24.0%
- +$1,426
- After-tax cash flow
- $-141/yr
For passive investors: Depreciation is non-cash, so a rental often shows a tax loss while cash-flowing — sheltering income. Rental losses are passive: they offset passive income freely, and up to $25,000/yr can offset ordinary (W-2) income if you actively participate and your MAGI is under $100k (phasing out to $0 by $150k); unused losses carry forward. On sale, claimed depreciation is recaptured at up to 25%, and gains may owe capital-gains tax (a 1031 exchange can defer both). Figures are a year-1 estimate at your 24.0% rate — not tax advice; consult a CPA.
Condition & rehab AI · 2 photos
This home is in excellent condition with no visible repairs needed. It offers a great opportunity for a potential buyer or investor looking for a move-in-ready property with high resale and rental value.
Value-add opportunities
- Both Painting exterior and interior walls — Fresh paint enhances curb appeal and interior aesthetics
- Both Landscaping improvements — Enhances curb appeal and adds value
- Both New flooring in bathrooms — Improves aesthetics and functionality
- Both New kitchen appliances — Enhances functionality and appeal
Renovation cost estimate screening
Value-add ROI direction
- Both Painting exterior and interior walls — Fresh paint enhances curb appeal and interior aesthetics ↑
- Both Landscaping improvements — Enhances curb appeal and adds value ↑
- Both New flooring in bathrooms — Improves aesthetics and functionality ↑
- Both New kitchen appliances — Enhances functionality and appeal ↑
ⓘ Cost ranges are severity-bucket heuristics (US national rule-of-thumb). Get contractor quotes + a written scope before underwriting a rehab budget.
Schools (NCES district)
- District
- Vermilion Parish
- NCES district ID
- 2201800
- Math proficiency
- 40% ▼ -38.00%
- Reading proficiency
- 53% ▼ -32.00%
- Median HH income
- $45,115
- Composite
- 39.37/100
- National rank
- #3974
- State rank
- #15 of 98 in LA
Livability — Maurice
- Score
- 76/100
- State rank
- #15
- US rank
- #3333
Category grades
Schools grade is shown separately in the Schools card above.
Census & demographics
- County
- Vermilion Parish · 8,759 people
- City population
- 8,759
- Metro
- Lafayette, LA
- Population (ZIP)
- 8,759
- Household income
- $76,213
- Rent vs Own
- Severe rent burden
- 46.0
Population outlook (Vermilion County) Hauer SSP2
- Today (2025)
- 64,095 people
- By 2030
- 65,915 · +2.8%
- By 2040
- 68,985 · +7.6%
- By 2050
- 70,804 · +10.5%
- By 2075
- 73,897 · +15.3%
- By 2100
- 71,793 · +12.0%
Race, ethnicity, and origin ACS 2023
- Neighborhood character
- Predominantly White (82%)
- Race & ethnicity
- White 82% Black 8% Two or more races 5% Hispanic / Latino 4% Asian 3%
- Common ancestry
- Lithuanian 25% Romanian 3% Italian 1%
- Foreign-born
- 2% · Vietnam
- Languages at home
- 93% English-only · French/Haitian/Cajun 4% Vietnamese 2% Spanish 1%
Political lean MEDSL · Vermilion
- 2024 margin
- Solid R (+63.8) · D 17.6% · R 81.4% · Other 1.1%
- 2008→2024 swing
- -16.3pp toward R · 2008: -47.5pp · 2024: -63.8pp
- All cycles
- 2024: R+63.8 2020: R+61.9 2016: R+59.6 2012: R+52.8 2008: R+47.5
Not yet ingested
- Civics
- —
Market trends
- HPI YoY
- ▼ -55.61%
- Current HPI
- 133.7146
- Rent YoY
- —
- Metro
- Lafayette, LA
- State GDP YoY
- ▲ 3.29%
- F500 in state
- 10
Industry mix (Fortune 500 HQ in LA)
| Industry | F500 HQs | Revenue |
|---|---|---|
| Telecommunications | 2 | $23B |
|
||
| Utilities | 1 | $12B |
|
||
| Wholesale / Distribution | 1 | $5B |
|
||
| Advertising | 1 | $2B |
|
||
Price history
+0.0% since first listed2 events — show timeline
- 2026-06-12 Listed $238,070 Zillow
- 2026-06-12 Listed $238,070 AcadianaMLS
Cash-flow waterfall
monthlySold comps — $/sqft
last 12 mo · ≤1 miLoading sold comps…