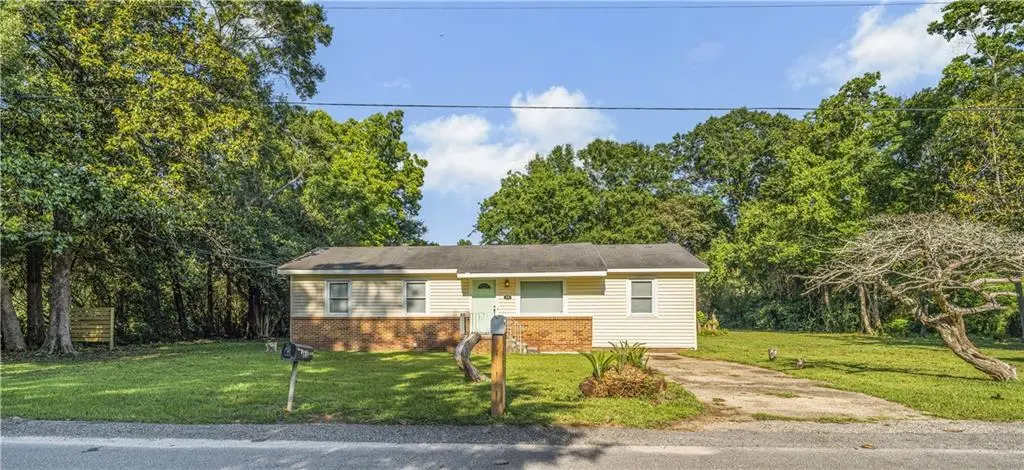
60 Oak St · Mobile, AL
Flood risk 1/10 · Minimal
- FEMA flood zone
- X (unshaded)
- Chance of flooding over 30 yrs
- 0.0%
- Est. flood insurance / yr
- $507 – $1,088
Fire risk 2/10 · Minimal
- Est. fire insurance / yr
- $916 – $1,700
Heat risk 9/10 · Severe
- Hot days now (above 104°F)
- 7 days/yr
- Hot days in 30 yrs
- 21 days/yr
Wind risk 9/10 · Severe
- Chance of severe wind over 30 yrs
- 99.0%
Air-quality risk 1/10 · Minimal
- Unhealthy air days now
- 0 days/yr
- Unhealthy air days in 30 yrs
- 0 days/yr
Risk factors via First Street. Map © Google.
Why this score? — see what drove the D- grade
The composite is a weighted blend of 9 inputs, each scored 0–100. Each bar is that input's sub-score; the figure is the points it added to the 100-point composite (weight × sub-score).
- ARV discount +11.3/15.0
- Cash flow +8.8/30.0
- Rent growth +4.0/5.0
- Livability +3.8/5.0
- 1% rule +2.7/10.0
- Condition / age +2.5/5.0
- DSCR +2.4/10.0
- Schools +2.3/10.0
- Appreciation +0.0/10.0
$194,000
🖨 Deal sheet 📄 Offer letter ✓ Due diligence
Listing remarks
Welcome home to this beautifully renovated, move-in ready 4-bedroom, 2-bath home situated on over half an acre! With more than 1,300 square feet of updated living space, this property combines modern upgrades with timeless charm and plenty of room to enjoy both inside and out. Step inside to find original hardwood floors flowing through the living room, hallway, and all bedrooms, adding warmth and character throughout the home. Fresh updates include new ceiling fans, stylish light fixtures, recessed lighting, and fresh paint that create a bright and inviting atmosphere. The remodeled kitchen is ready for everyday living and entertaining with new countertops, durable vinyl plank floorin
Key facts
- New vent hood
- Remodeled kitchen
- New countertops
Tags
Property features AI
Finance
- Other: Located in the Highland Park subdivision; Address: 60 Oak St, Mobile, AL 36608
Exterior
- Parking: Driveway; 2 parking spaces
- Utilities: Electricity available; Natural gas available; Water available; Public sewer
- Home design: Single family residence; Residential property
- Construction: Brick front and vinyl siding; Built in 1987; Block foundation; Shingle roof
- Exterior features: No notable exterior features listed; Wood fencing; View
Interior
- Kitchen: Dishwasher; Electric range; Eat-in kitchen
- Bedrooms: 4 bedrooms
- Flooring: Hardwood floors; Vinyl floors
- Bathrooms: 2 full bathrooms
- Heating & cooling: Central heating; Central air; Ceiling fan(s)
- Interior features: Other
- Laundry & utility: No basement
Neighborhood map
What this means for you Summary
Snapshot
- This is a 4-bed/2.0-bath single-family listed at $194k.
Deal economics
- At list price, monthly cash flow is $-160 ($-2k/yr) — negative.
- To cash-flow at today's rent, offer at most $171k (11.9% below list).
- To meet the 1% rule (rent ≥ 1% of price), the offer needs to be $149k (23.0% below list).
- Recommended offer: $149k (23.0% below list) — sets the bar for 1% rule.
Location & tenants
- Location reads 75/100 on livability (#20 in AL, #4,262 nationally) — a middle-class / working-renter tenant base. Strengths: commute A+, cost of living A+, housing A+; Watch: crime F, employment D-.
- Mobile County (urban): math 15% / reading 39% proficiency, ranked #81 of 129 in AL (top 63%) — low school quality limits family demand, transient renter base, plan for 1-2y turnover; 67% free/reduced lunch — lower-income household profile, screen leases tightly.
- Zoned schools: Taylor White Elementary School (math 27% / reading 52%, grade F, #243 of 627 statewide, top 41%, 423 students, 50% FRL); Baker High School (math 25% / reading 28%, grade F, #107 of 305 statewide, top 36%, 2,491 students, 42% FRL) — zoned schools average 46% FRL vs 67% district-wide (22 pts lower); this property's tenant base skews higher-income than the district average.
- Market conditions: Rents rising fast (+6.2%/yr); 338 active listings in the ZIP; 7 comparable units currently listed for rent nearby; rentals at typical pace (median 21d on market — plan ~3-4 weeks tenant-placement turnaround); 1,678 units permitted in Mobile County in 2024 (264 in 5+ unit buildings).
Forward outlook
- Local home prices are declining (-3.0%/yr); year-one equity from $1k of loan paydown is wiped out by about $6k of value loss. Plan a longer hold.
- Mobile County population projected to shrink 8% by 2050 — rents likely to lag national; underwrite the cash flow, not the appreciation.
Negotiation context
- It's been on market 34 days — a 3% lower offer ($188k) is reasonable based on typical stale-listing flexibility.
- Current owner paid $72k; list at $194k implies a 168% gain — meaningful room to come down on a strong offer.
Risks & watch-outs
- Climate carrying-cost: severe wind risk, 99% chance of damaging wind over 30y; extreme-heat days projected 7→21/yr by 2055 (HVAC capex compounding) — expect insurance premiums to compound above CPI over the hold.
Questions for the listing agent
- What do current leases actually rent for vs. the listed asking? Can we see a recent rent roll and the last 12 months of T-12 income?
- It's been on market 34 days. Have you received any prior offers? Is the seller open to a 23% concession, seller financing, or rate buy-down credit?
- Is there a deadline driving the sale (1031 exchange, divorce, estate, relocation)? That informs how much negotiation room exists.
- Schools are D-rated, which usually means shorter tenancies and higher turnover. Who's the typical renter profile here, and what's been the actual vacancy rate?
- Crime grade is F in this area — have there been break-ins, vandalism, or insurance claims at this property in the last 3 years? What carrier currently insures it and at what premium?
- The area grade is low — what's the realistic commute time and amenity access for the typical tenant pool here? Any planned neighborhood developments (good or bad) we should know about?
- What's the average days-on-market for RENTAL listings here right now (not sales)? A rising rental-DOM trend means longer vacancies and softer asking-rent achievability than the comps imply.
- What's the recent tenant-quality profile in this submarket — average credit score on applications, eviction rate, late-payment / NSF rate, and stable-employment percentage? A property-management company in the area should have these aggregated.
- How much new for-sale + rental construction is in the pipeline within 1–3 miles? Heavy new supply typically softens prices + rents 12–24 months out; constrained supply supports both.
Investment metrics
- 1% rule
- 0.77% ✗
- Cap rate
- 5.30%
- Cash-on-cash
- -3.53%
- DSCR
- 0.84
- GRM
- 10.8
CMA / ARV
- ARV (median comp)
- $212,073
- List price
- $194,000
- Delta
- -8.52%
- Verdict
- FAIR
- Comps
- 20 within 1.0 mi
Show comp detail 6 sales within ~0.75 mi
| Address | Dist | Beds/Ba | Sqft | Sold | Price | $/sf | Match |
|---|---|---|---|---|---|---|---|
| 70 N Park Ave | 0.05mi | 3/1.0 (-1) | 1,138 (-5%) | 21mo | $135,000 | $119 | 63 |
| 7133 5th St | 0.42mi | 4/2.0 | 1,308 (+10%) | 13mo | $118,000 | $90 | 54 |
| 14 Breydon Ct | 0.37mi | 3/2.0 (-1) | 1,346 (+13%) | 9mo | $243,350 | $181 | 49 |
| 56 Alan Dr | 0.53mi | 3/1.5 (-1) | 1,040 (-13%) | 9mo | $105,000 | $101 | 39 |
| 9 Breydon Ct | 0.42mi | 3/2.0 (-1) | 1,346 (+13%) | 22mo | $216,500 | $161 | 36 |
| 316 Fairway Ave | 0.71mi | 3/2.0 (-1) | 1,338 (+12%) | 17mo | $225,000 | $168 | 28 |
Match score weights: distance 35% · size 25% · config 20% · recency 20%. Top-matched comps best support the ARV.
Projected returns pro-forma
-3.0% appreciation · 6.15% rent growth · sell at horizon
- IRR
- -18.8%
- Equity multiple
- 0.32×
- Total profit
- $-36,709
- Equity at exit
- $28,926
- IRR
- -5.9%
- Equity multiple
- 0.57×
- Total profit
- $-23,590
- Equity at exit
- $16,774
Cash invested: $54,320 (down + closing). Projections, not guarantees.
Landlord ↔ Tenant lean methodology
- Overall (STATE)
- 90 Strongly Landlord-Friendly
- State Alabama
- 90 Strongly Landlord-Friendly · R+15
- County
- — inherits STATE
- City
- — inherits STATE
ZIP-level market 36608
- Rents YoY
- 6.2%
- Active inventory
- 338
- Price-to-rent
- 10.8×
Monthly cashflow live
- Estimated rent
- $1,495 high interval (Pro) →
- Mortgage (P&I)
- −$1,017
- Tax est. 1.5%
- −$242 /mo · $2,910/yr
- Insurance
- −$81
- HOA
- −$0
- Vacancy / Maint / Mgmt
- −$314
- Net cashflow
- $-160
Break-even live
UW: 25.0% down · 7.5% · 30yr · 1.5% tax · 5.0% vac · 8.0% maint · 8.0% mgmt
Financing live
Cash to close
- Down payment
- $48,500
- Closing costs
- $5,820
- Reserves months
- —
- Total cash needed
- —
Loan-product check · same deal, 3 products live
Conventional
25% down · 7.5% · 30yr
- Down + closing
- —
- Monthly P&I
- —
- Monthly cashflow
- —
- DSCR
- —
- Eligible?
- —
Personal DTI + credit; lowest rate.
DSCR
20% down · 8.5% · 30yr
- Down + closing
- —
- Monthly P&I
- —
- Monthly cashflow
- —
- DSCR
- —
- Eligible?
- —
No personal income docs; deal must DSCR.
Hard money
10% down · 12.0% · 12mo
- Down + closing
- —
- Monthly P&I
- —
- Monthly cashflow
- —
- DSCR
- —
- Eligible?
- —
Short-term bridge; refi at stabilization.
Rent comps 7 comps
| Address | Beds | Baths | Sqft | Rent | $/sqft | DOM | Units | Dist |
|---|---|---|---|---|---|---|---|---|
| 176 2nd Ave Mobile, AL | 3.0 | 1.0 | 1056 | $895 | $0.85 | 21d | 1 | 0.62mi |
| 101 Foreman Rd Mobile, AL | 1.0–3.0 | 1.0–2.0 | 835 | $1,279 | $1.53 | 43d | 9 | 0.65mi |
| 7601 Airport Blvd Mobile, AL | 2.0–4.0 | 2.0 | 1082 | $1,325 | $1.22 | 13d | 5 | 0.68mi |
| 6701 Dickens Ferry Rd #30 Mobile, AL | 3.0 | 2.5 | 1342 | $1,395 | $1.04 | 21d | 1 | 0.75mi |
| 6427 Airport Blvd Mobile, AL | 2.0–3.0 | 2.0–2.5 | 1214 | $1,537 | $1.27 | 43d | 10 | 1.28mi |
| 7380 Hitt Rd Mobile, AL | 1.0–3.0 | 1.0–2.0 | 892 | $1,357 | $1.52 | 13d | 13 | 1.31mi |
| 8050 Tanner Williams Rd Mobile, AL | 2.0–3.0 | 2.0–2.5 | 1028 | $1,345 | $1.31 | 21d | 3 | 1.37mi |
Listing history 18 events
-
2026-06-18days on market $194,000 Active 34 DOM
-
2026-06-17days on market $194,000 Active 33 DOM
-
2026-06-16days on market $194,000 Active 32 DOM
-
2026-06-15days on market $194,000 Active 31 DOM
-
2026-06-14days on market $194,000 Active 29 DOM
-
2026-06-13days on market $194,000 Active 28 DOM
-
2026-06-10days on market $194,000 Active 26 DOM
-
2026-06-09days on market $194,000 Active 25 DOM
-
2026-06-08days on market $194,000 Active 24 DOM
-
2026-06-07days on market $194,000 Active 23 DOM
-
2026-06-05days on market $194,000 Active 20 DOM
-
2026-06-03days on market $194,000 Active 19 DOM
-
2026-06-02days on market $194,000 Active 18 DOM
-
2026-06-01days on market $194,000 Active 17 DOM
-
2026-05-31days on market $194,000 Active 16 DOM
-
2026-05-30days on market $194,000 Active 15 DOM
-
2026-05-15$194,000 Active 1533-char remark
-
2005-09-01soldstatus $72,435
ⓘ Source: listings_history table (triggers on properties + properties_extension) + one-shot
backfill from property_details.listing_events for pre-trigger history.
Climate risk First Street
- Flood 1/10 Low FEMA zone X (unshaded) · 0% chance over 30 yrs
- Wildfire 2/10 Low
- Heat 9/10 Extreme 7 d/yr ≥104°F today · 21 d/yr by 30 yrs out
- Wind 9/10 Extreme 99% chance of damaging wind over 30 yrs
- Air quality 1/10 Low 0 unhealthy d/yr today · 0 by 30 yrs out
Nearby sold comps map
Loading sold comps map…
Walkable amenities ~0.75 mi
Loading nearby amenities…
Taxation est. · year 1
- Rental income
- $17,937
- − Mortgage interest
- −$10,867
- − Property taxes
- −$2,910
- − Insurance
- −$970
- − Repairs & maintenance
- −$1,435
- − Management
- −$1,435
- − Depreciation
- −$5,644
- Taxable loss
- −$5,324
- Est. tax savings @ 24.0%
- +$1,278
- After-tax cash flow
- $-641/yr
For passive investors: Depreciation is non-cash, so a rental often shows a tax loss while cash-flowing — sheltering income. Rental losses are passive: they offset passive income freely, and up to $25,000/yr can offset ordinary (W-2) income if you actively participate and your MAGI is under $100k (phasing out to $0 by $150k); unused losses carry forward. On sale, claimed depreciation is recaptured at up to 25%, and gains may owe capital-gains tax (a 1031 exchange can defer both). Figures are a year-1 estimate at your 24.0% rate — not tax advice; consult a CPA.
Schools (NCES district)
- District
- Mobile County
- NCES district ID
- 0102370
- Math proficiency
- 15% ▼ -28.00%
- Reading proficiency
- 39% ▬ 0.00%
- Median HH income
- $42,455
- Composite
- 22.9/100
- National rank
- #8002
- State rank
- #81 of 129 in AL
Livability — Mobile
- Score
- 75/100
- State rank
- #20
- US rank
- #4262
Category grades
Schools grade is shown separately in the Schools card above.
Census & demographics
- County
- Mobile County · 246,577 people
- City population
- 205,729
- Metro
- Mobile, AL
- Population (ZIP)
- 38,890
- Household income
- $61,146
- Rent vs Own
- Severe rent burden
- 1823.0
Population outlook (Mobile County) Hauer SSP2
- Today (2025)
- 415,303 people
- By 2030
- 411,755 · -0.9%
- By 2040
- 399,670 · -3.8%
- By 2050
- 382,616 · -7.9%
- By 2075
- 337,353 · -18.8%
- By 2100
- 283,391 · -31.8%
Race, ethnicity, and origin ACS 2023
- Neighborhood character
- Diverse neighborhood (Simpson 0.56)
- Race & ethnicity
- White 56% Black 35% Two or more races 4% Hispanic / Latino 4% Asian 2%
- Common ancestry
- Lithuanian 3% Italian 2% Slovak 2%
- Foreign-born
- 4% · Canada
- Languages at home
- 95% English-only · Spanish 2% Arabic 1% Other Indo-European 1%
Political lean MEDSL · Mobile
- 2024 margin
- R (+16.4) · D 41.3% · R 57.7%
- 2008→2024 swing
- -7.7pp toward R · 2008: -8.7pp · 2024: -16.4pp
- All cycles
- 2024: R+16.4 2020: R+11.9 2016: R+13.9 2012: R+9.3 2008: R+8.7
Not yet ingested
- Civics
- —
Market trends
- HPI YoY
- ▼ -224.52%
- Current HPI
- 198.9469
- Rent YoY
- ▲ 6.15%
- Metro
- Mobile, AL
- State GDP YoY
- ▲ 2.94%
- F500 in state
- 4
Industry mix (Fortune 500 HQ in AL)
| Industry | F500 HQs | Revenue |
|---|---|---|
| Financial Services | 1 | $8B |
|
||
| Healthcare | 1 | $5B |
|
||
Price history
+167.8% since first listed2 events — show timeline
- 2026-05-15 Listed $194,000 GCMLS AL
- 2005-09-01 Sold (Public Records) $72,435 Public Records
Property tax history
-3.1%/yrLatest (2025): $260 · +8.1% YoY. Source: county tax records.
Cash-flow waterfall
monthlySold comps — $/sqft
last 12 mo · ≤1 miLoading sold comps…