 🏗️ New Construction
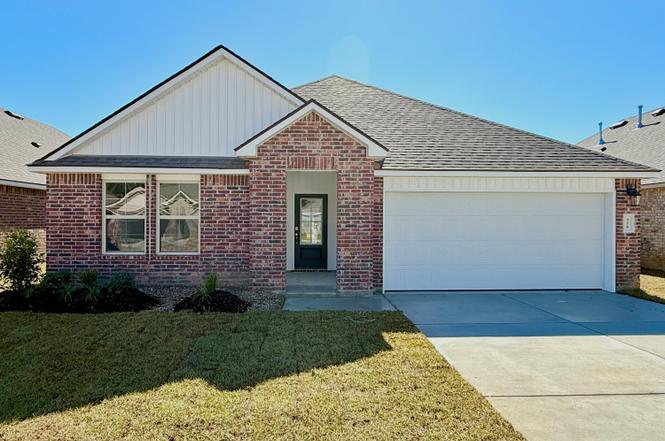
328 White Pine Dr · Lafayette, LA
Flood risk No data
- FEMA flood zone
- —
- Chance of flooding over 30 yrs
- —
- Est. flood insurance / yr
- —
Fire risk No data
- Est. fire insurance / yr
- —
Heat risk No data
- Hot days now (above threshold)
- —
- Hot days in 30 yrs
- —
Wind risk No data
- Chance of severe wind over 30 yrs
- —
Air-quality risk No data
- Unhealthy air days now
- —
- Unhealthy air days in 30 yrs
- —
Risk factors via First Street. Map © Google.
Why this score? — see what drove the D+ grade
The composite is a weighted blend of 9 inputs, each scored 0–100. Each bar is that input's sub-score; the figure is the points it added to the 100-point composite (weight × sub-score).
- Cash flow +17.8/30.0
- ARV discount +7.5/15.0
- DSCR +5.6/10.0
- 1% rule +4.9/10.0
- Rent growth +4.3/5.0
- Schools +3.6/10.0
- Livability +3.5/5.0
- Condition / age +2.5/5.0
- Appreciation +0.0/10.0
$254,500
🖨 Deal sheet 📄 Offer letter ✓ Due diligence
Listing remarks
Come by today to check out Cedar Creek, a new home community in Lafayette, Louisiana! This popular Lafayette Community, now in its second phase, is conveniently located near Louisiana Avenue and is a short way away from David Thibodeaux STEM Magnet Academy and Acadiana Park. Venture a little further and you're only minutes from 7 Different Private Schools, 2 Charter Schools, the University of Louisiana of Lafayette, and the beautiful Downtown Lafayette. Living here, you will enjoy a sense of community with easy access to many major employers, shopping, dining, and entertainment. While Lafayette has something for everyone to enjoy, it is especially known for its bright culture and delicious
Key facts
- Tile backsplash
- Walk-in pantry
- 6,098 sq ft lot
Tags
Neighborhood map
What this means for you Summary
Snapshot
- This is a 4-bed/2.0-bath single-family listed at $254k.
Deal economics
- At list price, monthly cash flow is $207 ($2k/yr) — positive.
- The deal already cash-flows at list — no discount required.
- To meet the 1% rule (rent ≥ 1% of price), the offer needs to be $252k (1.1% below list).
- Recommended offer: $224k (12.0% below list) — sets the bar for market timing.
- Cap rate 7.3% vs local median 4.7% in Lafayette — top-decile yield for the area; either an underpriced asset or a hidden risk that comps aren't pricing in. Stress-test before assuming the spread holds.
Location & tenants
- Location reads 70/100 on livability (#63 in LA) — a middle-class / working-renter tenant base. Strengths: cost of living A+, housing A+, health & safety A+; Watch: amenities C-, employment C-, crime F.
- Lafayette Parish (urban): math 38% / reading 46% proficiency, ranked #19 of 98 in LA (top 19%) — families likely to look elsewhere, expect single-tenant / working-renter base with shorter leases.
- Zoned schools: Evangeline Elementary School (math 20% / reading 33%, grade F, #372 of 646 statewide, top 58%, 613 students, 84% FRL); Acadian Middle School (math 13% / reading 27%, grade F, #166 of 218 statewide, top 76%, 372 students, 74% FRL); Northside High School (math 17% / reading 22%, grade F, #186 of 265 statewide, top 73%, 655 students, 83% FRL) — zoned schools average 80% FRL vs 56% district-wide (24 pts higher); higher-poverty schools than district average — tighter screening recommended.
- Zoned-school proficiency averages 22% at this address vs 42% district-wide (-20 pts) — the specific schools serving this property underperform the Lafayette Parish average; the district grade overstates school quality for this exact location.
- Market conditions: Rents rising fast (+7.3%/yr); 246 active listings in the ZIP; 2 comparable units currently listed for rent nearby; lower-income renter base — watch delinquency; 1,585 units permitted in Lafayette Parish in 2024 (10 in 5+ unit buildings).
- At $2,517/mo this rent would consume 91% of the median local household income ($33k/yr) (locally 2089% of renters already pay >50% of income on rent) — very limited rent-growth headroom before tenants either downsize or default.
Forward outlook
- Local home prices are declining (-3.0%/yr); year-one equity from $2k of loan paydown is wiped out by about $8k of value loss. Plan a longer hold.
- Lafayette County population projected at +34% by 2050 — long-run rental-demand tailwind backs the buy-and-hold thesis.
- At projected returns (-3.0% appreciation + 7.3% rent growth), your $71k cash investment doubles in ~10 years — after that, you're playing with house money.
Negotiation context
- It's been on market 245 days — a 12% lower offer ($224k) is reasonable based on typical stale-listing flexibility.
Questions for the listing agent
- It's been on market 245 days. Have you received any prior offers? Is the seller open to a 12% concession, seller financing, or rate buy-down credit?
- What does the HOA fee cover, when was the last increase, and are there any pending special assessments or reserve-fund shortfalls?
- Why hasn't it sold? Are there any deal-killer items the seller is aware of (foundation, flood, title, zoning, code violations)?
- Is there a deadline driving the sale (1031 exchange, divorce, estate, relocation)? That informs how much negotiation room exists.
- Schools are B-rated — typically a magnet for longer-tenancy family renters. What's the average tenant stay here, and is there a school-zone premium baked into asking?
- Crime grade is F in this area — have there been break-ins, vandalism, or insurance claims at this property in the last 3 years? What carrier currently insures it and at what premium?
- The area grade is low — what's the realistic commute time and amenity access for the typical tenant pool here? Any planned neighborhood developments (good or bad) we should know about?
- What's the average days-on-market for RENTAL listings here right now (not sales)? A rising rental-DOM trend means longer vacancies and softer asking-rent achievability than the comps imply.
- What's the recent tenant-quality profile in this submarket — average credit score on applications, eviction rate, late-payment / NSF rate, and stable-employment percentage? A property-management company in the area should have these aggregated.
- How much new for-sale + rental construction is in the pipeline within 1–3 miles? Heavy new supply typically softens prices + rents 12–24 months out; constrained supply supports both.
Investment metrics
- 1% rule
- 0.99% ✗
- Cap rate
- 7.27%
- Cash-on-cash
- 3.51%
- DSCR
- 1.16
- GRM
- 8.4
CMA / ARV
- ARV (on-the-fly)
- $252,990
- Comps found
- 12
Show comp detail 12 sales within ~0.75 mi
| Address | Dist | Beds/Ba | Sqft | Sold | Price | $/sf | Match |
|---|---|---|---|---|---|---|---|
| 323 White Pine Dr | 0.00mi | 4/2.0 | 1,874 (0%) | 1mo | $249,000 | $133 | 99 |
| 328 White Pine Dr | 0.00mi | 4/2.0 | 1,874 (0%) | 1mo | $254,500 | $136 | 99 |
| 120 Red Pine Dr | 0.13mi | 4/2.0 | 1,874 (0%) | 6mo | $239,900 | $128 | 89 |
| 204 White Pine Dr | 0.03mi | 4/2.0 | 1,786 (-5%) | 6mo | $236,000 | $132 | 86 |
| 335 White Pine Dr | 0.00mi | 4/2.0 | 1,704 (-9%) | 1mo | $237,000 | $139 | 84 |
| 332 White Pine Dr | 0.02mi | 4/2.0 | 2,079 (+11%) | 6mo | $269,000 | $129 | 76 |
| 423 Starlight Dr | 0.20mi | 4/2.0 | 1,700 (-9%) | 0mo | $230,000 | $135 | 75 |
| 330 White Pine Dr | 0.00mi | 5/3.0 (+1) | 2,087 (+11%) | 1mo | $269,500 | $129 | 71 |
| 319 White Pine Dr | 0.00mi | 3/2.0 (-1) | 1,613 (-14%) | 2mo | $235,500 | $146 | 70 |
| 333 White Pine Dr | 0.00mi | 3/2.0 (-1) | 1,613 (-14%) | 2mo | $235,000 | $146 | 70 |
| 336 White Pine Dr | 0.02mi | 3/2.0 (-1) | 1,616 (-14%) | 3mo | $242,000 | $150 | 68 |
| 102 Kingswood Dr | 0.59mi | 3/2.0 (-1) | 1,775 (-5%) | 4mo | $215,000 | $121 | 55 |
Match score weights: distance 35% · size 25% · config 20% · recency 20%. Top-matched comps best support the ARV.
Projected returns pro-forma
-3.0% appreciation · 7.35% rent growth · sell at horizon
- IRR
- -5.9%
- Equity multiple
- 0.77×
- Total profit
- $-16,256
- Equity at exit
- $37,722
- IRR
- 8.4%
- Equity multiple
- 1.77×
- Total profit
- $54,676
- Equity at exit
- $21,874
Cash invested: $70,837 (down + closing). Projections, not guarantees.
Landlord ↔ Tenant lean methodology
- Overall (STATE)
- 90 Strongly Landlord-Friendly
- State Louisiana
- 90 Strongly Landlord-Friendly · R+12
- County
- — inherits STATE
- City
- — inherits STATE
ZIP-level market 70501
- Rents YoY
- 7.3%
- Active inventory
- 246
- Price-to-rent
- 8.4×
Monthly cashflow live
- Estimated rent
- $2,517 medium interval (Pro) →
- Mortgage (P&I)
- −$1,327
- Tax est. 1.5%
- −$316 /mo · $3,795/yr
- Insurance
- −$105
- HOA
- −$33
- Vacancy / Maint / Mgmt
- −$529
- Net cashflow
- $207
Break-even live
UW: 25.0% down · 7.5% · 30yr · 1.5% tax · 5.0% vac · 8.0% maint · 8.0% mgmt
Financing live
Cash to close
- Down payment
- $63,248
- Closing costs
- $7,590
- Reserves months
- —
- Total cash needed
- —
Loan-product check · same deal, 3 products live
Conventional
25% down · 7.5% · 30yr
- Down + closing
- —
- Monthly P&I
- —
- Monthly cashflow
- —
- DSCR
- —
- Eligible?
- —
Personal DTI + credit; lowest rate.
DSCR
20% down · 8.5% · 30yr
- Down + closing
- —
- Monthly P&I
- —
- Monthly cashflow
- —
- DSCR
- —
- Eligible?
- —
No personal income docs; deal must DSCR.
Hard money
10% down · 12.0% · 12mo
- Down + closing
- —
- Monthly P&I
- —
- Monthly cashflow
- —
- DSCR
- —
- Eligible?
- —
Short-term bridge; refi at stabilization.
Rent comps 2 comps
| Address | Beds | Baths | Sqft | Rent | $/sqft | DOM | Units | Dist |
|---|---|---|---|---|---|---|---|---|
| 109 Red Pine Dr Lafayette, LA | 4.0 | 3.0 | 2087 | $3,500 | $1.68 | 13d | 1 | 0.10mi |
| 406 Starlight Dr Lafayette, LA | 4.0 | 2.0 | 1867 | $3,500 | $1.87 | 13d | 1 | 0.27mi |
HOA detail
- Monthly dues
- $33 · $396/yr
Listing history 4 events
-
2026-04-13status Pending
-
2026-04-01price $254,500
-
2026-03-11price $259,500
-
2025-08-11$262,000 Active
ⓘ Source: listings_history table (triggers on properties + properties_extension) + one-shot
backfill from property_details.listing_events for pre-trigger history.
Nearby sold comps map
Loading sold comps map…
Walkable amenities ~0.75 mi
Loading nearby amenities…
Taxation est. · year 1
- Rental income
- $30,203
- − Mortgage interest
- −$14,171
- − Property taxes
- −$3,795
- − Insurance
- −$1,265
- − Repairs & maintenance
- −$2,416
- − Management
- −$2,416
- − HOA
- −$396
- − Depreciation
- −$7,360
- Taxable loss
- −$1,617
- Est. tax savings @ 24.0%
- +$388
- After-tax cash flow
- $2,872/yr
For passive investors: Depreciation is non-cash, so a rental often shows a tax loss while cash-flowing — sheltering income. Rental losses are passive: they offset passive income freely, and up to $25,000/yr can offset ordinary (W-2) income if you actively participate and your MAGI is under $100k (phasing out to $0 by $150k); unused losses carry forward. On sale, claimed depreciation is recaptured at up to 25%, and gains may owe capital-gains tax (a 1031 exchange can defer both). Figures are a year-1 estimate at your 24.0% rate — not tax advice; consult a CPA.
Schools (NCES district)
- District
- Lafayette Parish
- NCES district ID
- 2200870
- Math proficiency
- 38% ▼ -32.00%
- Reading proficiency
- 46% ▼ -24.00%
- Median HH income
- $50,238
- Composite
- 36.15/100
- National rank
- #4741
- State rank
- #19 of 98 in LA
Livability — Lafayette
- Score
- 70/100
- State rank
- #63
- US rank
- #8133
Category grades
Schools grade is shown separately in the Schools card above.
Census & demographics
- Census place
- Lafayette, LA
- County
- Lafayette Parish · 207,544 people
- City population
- 158,114
- Metro
- Lafayette, LA
- Population (ZIP)
- 26,465
- Household income
- $33,365
- Rent vs Own
- Severe rent burden
- 2089.0
Population outlook (Lafayette County) Hauer SSP2
- Today (2025)
- 280,930 people
- By 2030
- 301,092 · +7.2%
- By 2040
- 339,456 · +20.8%
- By 2050
- 375,156 · +33.5%
- By 2075
- 451,672 · +60.8%
- By 2100
- 497,203 · +77.0%
Race, ethnicity, and origin ACS 2023
- Neighborhood character
- Predominantly Black (73%)
- Race & ethnicity
- Black 73% White 18% Two or more races 6% Hispanic / Latino 4%
- Common ancestry
- Lithuanian 4%
- Foreign-born
- 2% · Canada
- Languages at home
- 95% English-only · Spanish 3% French/Haitian/Cajun 2%
Political lean MEDSL · Lafayette
- 2024 margin
- Solid R (+31.4) · D 33.5% · R 64.8% · Other 1.7%
- 2008→2024 swing
- -0.1pp no change · 2008: -31.3pp · 2024: -31.4pp
- All cycles
- 2024: R+31.4 2020: R+28.7 2016: R+33.6 2012: R+33.7 2008: R+31.3
Not yet ingested
- Civics
- —
Market trends
- HPI YoY
- ▼ -108.63%
- Current HPI
- 81.2963
- Rent YoY
- ▲ 7.35%
- Metro
- Lafayette, LA
- State GDP YoY
- ▲ 3.29%
- F500 in state
- 10
Industry mix (Fortune 500 HQ in LA)
| Industry | F500 HQs | Revenue |
|---|---|---|
| Telecommunications | 2 | $23B |
|
||
| Utilities | 1 | $12B |
|
||
| Wholesale / Distribution | 1 | $5B |
|
||
| Advertising | 1 | $2B |
|
||
Price history
-2.9% since first listed4 events — show timeline
- 2026-04-13 Pending — AcadianaMLS
- 2026-04-01 Price Changed $254,500 AcadianaMLS
- 2026-03-11 Price Changed $259,500 AcadianaMLS
- 2025-08-11 Listed $262,000 AcadianaMLS
Cash-flow waterfall
monthlySold comps — $/sqft
last 12 mo · ≤1 miLoading sold comps…