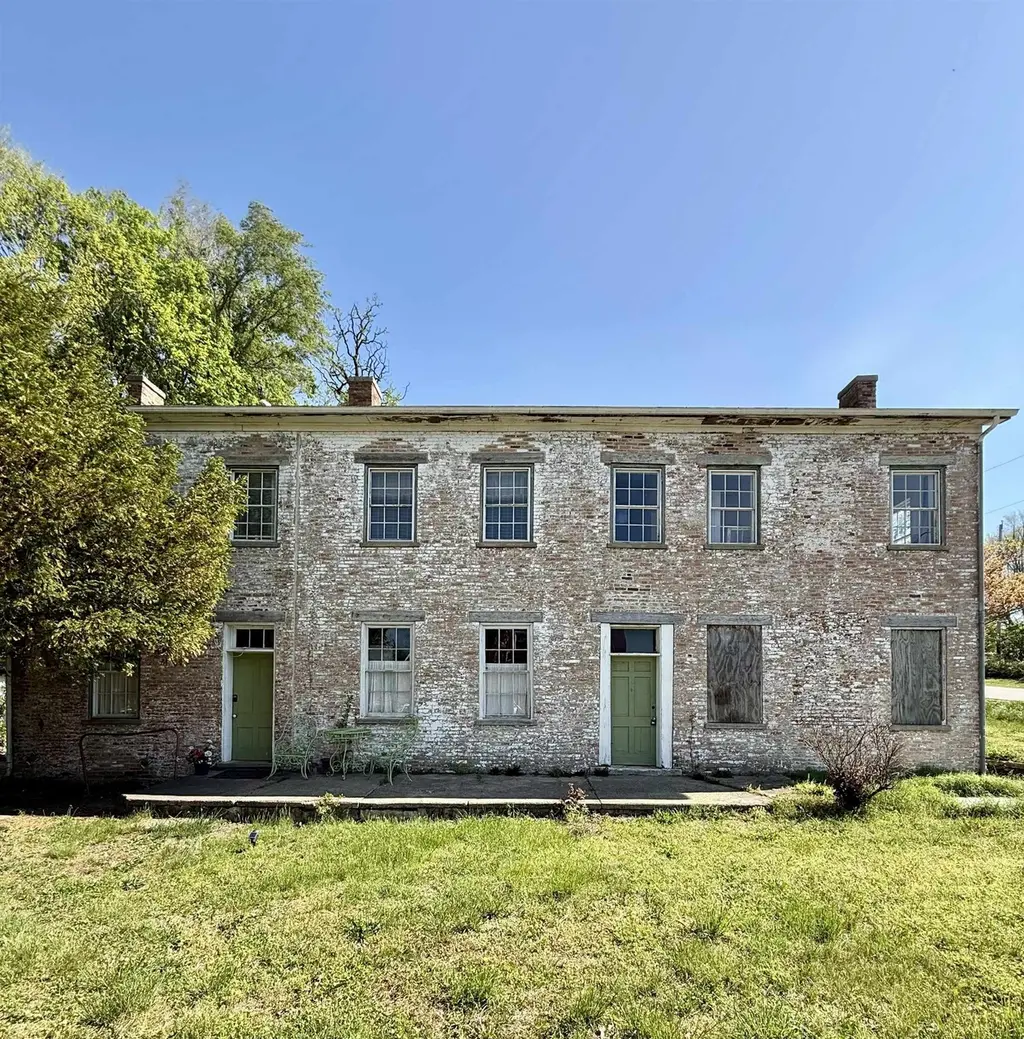
111 W Baltimore St · Laurel, IN
Flood risk 1/10 · Minimal
- FEMA flood zone
- X (unshaded)
- Chance of flooding over 30 yrs
- 0.0%
- Est. flood insurance / yr
- $507 – $1,088
Fire risk 1/10 · Minimal
- Est. fire insurance / yr
- $717 – $1,331
Heat risk 4/10 · Minor
- Hot days now (above 102°F)
- 7 days/yr
- Hot days in 30 yrs
- 20 days/yr
Wind risk 2/10 · Minimal
- Chance of severe wind over 30 yrs
- 1.0%
Air-quality risk 2/10 · Minimal
- Unhealthy air days now
- 1 days/yr
- Unhealthy air days in 30 yrs
- 2 days/yr
Risk factors via First Street. Map © Google.
Why this score? — see what drove the B+ grade
The composite is a weighted blend of 9 inputs, each scored 0–100. Each bar is that input's sub-score; the figure is the points it added to the 100-point composite (weight × sub-score).
- Cash flow +30.0/30.0
- 1% rule +10.0/10.0
- DSCR +10.0/10.0
- Appreciation +9.0/10.0
- ARV discount +7.5/15.0
- Schools +5.0/10.0
- Livability +3.1/5.0
- Rent growth +2.5/5.0
- Condition / age +2.5/5.0
$84,000
🖨 Deal sheet (PDF) 📄 Offer letter ✓ Due diligence
Listing remarks MLS
Don't miss this versatile investment property currently operating as a successful Airbnb! This duplex offers immediate income with one fully finished 1-bedroom unit, while the second side presents a great value-add opportunity. The unfinished unit has strong potential to be converted into a spacious 2-bedroom apartment, allowing for increased rental income and long-term equity growth. Whether you're looking to expand your short-term rental portfolio or create a dual-income long-term rental, this property offers flexibility to fit your investment strategy. Endless opportunities!
Key facts
- 8,000 sq ft lot
- Built 1900
- Listed 58 days
Property features AI
Finance
- Financial info: Gross income reported as 0; Expenses reported as 0; Unit 1 rent: $560 weekly; Unit 2 rent: $0 weekly
Exterior
- Utilities: No solid waste service listed
- Home design: Residential income duplex; 2 total units
- Construction: Stone foundation
- Exterior features: Vacant current use; County road access
Interior
- Kitchen: Kitchen in each unit
- Bedrooms: One 1-bedroom unit (2 levels); One 2-bedroom unit (2 levels)
- Heating & cooling: Baseboard heating; Window air conditioning units
- Interior features: Cellar basement
Neighborhood map
What this means for you Summary
Snapshot
- This is a 3-bed/1.0-bath single-family listed at $84k.
Deal economics
- At list price, monthly cash flow is $560 ($7k/yr) — positive.
- The deal already cash-flows at list — no discount required.
- Meets the 1% rule at list price ($1k rent vs $84k).
- Recommended offer: $81k (3.0% below list) — sets the bar for market timing.
Location & tenants
- Location reads 61/100 on livability (#488 in IN) — a middle-class / working-renter tenant base. Strengths: cost of living A+, health & safety A+, housing A-; Watch: schools F, crime D-, amenities F.
- Market conditions: 58 units permitted in Franklin County in 2024 (0 in 5+ unit buildings).
Forward outlook
- In year one you build about $7k of equity ($581 loan paydown + $7k appreciation (7.9% local appreciation)).
- Franklin County population projected to shrink 10% by 2050 — rents likely to lag national; underwrite the cash flow, not the appreciation.
- At projected returns (7.9% appreciation + 3.0% rent growth), your $24k cash investment doubles in ~2 years — after that, you're playing with house money.
- By year 5, paydown + projected appreciation supports a ~$33k cash-out refi (75% LTV) — recoverable capital for the next deal without selling this one.
Negotiation context
- It's been on market 59 days — a 3% lower offer ($81k) is reasonable based on typical stale-listing flexibility.
- 3 sale attempts with the ask held roughly flat each time — persistent listings suggest the price (not the market) is what's stuck; bring a comps-based counter.
Risks & watch-outs
- Watch-outs: built in 1900 — expect roof / HVAC / electrical / plumbing capex.
Questions for the listing agent
- It's been on market 59 days. Have you received any prior offers? Is the seller open to a 3% concession, seller financing, or rate buy-down credit?
- Built in 1900 — when were the roof, HVAC, electrical panel, plumbing, and water heater last replaced?
- Is there a deadline driving the sale (1031 exchange, divorce, estate, relocation)? That informs how much negotiation room exists.
- Schools are F-rated, which usually means shorter tenancies and higher turnover. Who's the typical renter profile here, and what's been the actual vacancy rate?
- Crime grade is D in this area — have there been break-ins, vandalism, or insurance claims at this property in the last 3 years? What carrier currently insures it and at what premium?
- What's the average days-on-market for RENTAL listings here right now (not sales)? A rising rental-DOM trend means longer vacancies and softer asking-rent achievability than the comps imply.
- What's the recent tenant-quality profile in this submarket — average credit score on applications, eviction rate, late-payment / NSF rate, and stable-employment percentage? A property-management company in the area should have these aggregated.
- How much new for-sale + rental construction is in the pipeline within 1–3 miles? Heavy new supply typically softens prices + rents 12–24 months out; constrained supply supports both.
Investment metrics
- 1% rule
- 1.72% ✓
- Cap rate
- 14.30%
- Cash-on-cash
- 28.59%
- DSCR
- 2.27
- GRM
- 4.8
CMA / ARV
No comps found within radius.
Projected returns pro-forma
7.94% appreciation · 3.0% rent growth · sell at horizon
- IRR
- 42.7%
- Equity multiple
- 3.98×
- Total profit
- $70,012
- Equity at exit
- $63,490
- IRR
- 38.3%
- Equity multiple
- 8.51×
- Total profit
- $176,651
- Equity at exit
- $125,717
Cash invested: $23,520 (down + closing). Projections, not guarantees.
Landlord ↔ Tenant lean methodology
- Overall (STATE)
- 90 Strongly Landlord-Friendly
- State Indiana
- 90 Strongly Landlord-Friendly · R+11
- County
- — inherits STATE
- City
- — inherits STATE
ZIP-level market 47024
- Home prices YoY
- 3.2%
- Price-to-rent
- 4.8×
Monthly cashflow live
- Estimated rent
- $1,449 medium interval (Pro) →
- Mortgage (P&I)
- −$441
- Tax from tax record
- −$108 /mo · $1,302/yr
- Insurance
- −$35
- HOA
- −$0
- Vacancy / Maint / Mgmt
- −$304
- Net cashflow
- $560
Break-even live
Sensitivity live
| Price | -10% $608 | -5% $584 | +0% $560 | +5% $537 | +10% $513 |
|---|---|---|---|---|---|
| Rent | -10% $446 | -5% $503 | +0% $560 | +5% $618 | +10% $675 |
| Rate | -1.0pp $603 | -0.5pp $582 | base $560 | +0.5pp $539 | +1.0pp $516 |
UW: 25.0% down · 7.5% · 30yr · 1.5% tax · 5.0% vac · 8.0% maint · 8.0% mgmt
Financing live
Cash to close
- Down payment
- $21,000
- Closing costs
- $2,520
- Reserves months
- —
- Total cash needed
- —
Loan-product check · same deal, 3 products live
Conventional
25% down · 7.5% · 30yr
- Down + closing
- —
- Monthly P&I
- —
- Monthly cashflow
- —
- DSCR
- —
- Eligible?
- —
Personal DTI + credit; lowest rate.
DSCR
20% down · 8.5% · 30yr
- Down + closing
- —
- Monthly P&I
- —
- Monthly cashflow
- —
- DSCR
- —
- Eligible?
- —
No personal income docs; deal must DSCR.
Hard money
10% down · 12.0% · 12mo
- Down + closing
- —
- Monthly P&I
- —
- Monthly cashflow
- —
- DSCR
- —
- Eligible?
- —
Short-term bridge; refi at stabilization.
Listing history 18 events
-
2026-06-21days on market $84,000 Active 59 DOM
-
2026-06-18days on market $84,000 Active 56 DOM
-
2026-06-17days on market $84,000 Active 55 DOM
-
2026-06-16days on market $84,000 Active 54 DOM
-
2026-06-15days on market $84,000 Active 53 DOM
-
2026-06-13days on market $84,000 Active 51 DOM
-
2026-06-13days on market $84,000 Active 50 DOM
-
2026-06-09days on market $84,000 Active 47 DOM
-
2026-06-08days on market $84,000 Active 46 DOM
-
2026-06-07days on market $84,000 Active 45 DOM
-
2026-06-04days on market $84,000 Active 42 DOM
-
2026-06-03days on market $84,000 Active 41 DOM
-
2026-06-02days on market $84,000 Active 40 DOM
-
2026-06-01days on market $84,000 Active 39 DOM
-
2026-05-31days on market $84,000 Active 38 DOM
-
2026-04-22$84,000 Active 584-char remark
Show marketing remark (584 chars)
Don't miss this versatile investment property currently operating as a successful Airbnb! This duplex offers immediate income with one fully finished 1-bedroom unit, while the second side presents a great value-add opportunity. The unfinished unit has strong potential to be converted into a spacious 2-bedroom apartment, allowing for increased rental income and long-term equity growth. Whether you're looking to expand your short-term rental portfolio or create a dual-income long-term rental, this property offers flexibility to fit your investment strategy. Endless opportunities!
-
2026-04-22$84,000 Active
Show marketing remark (584 chars)
Don't miss this versatile investment property currently operating as a successful Airbnb! This duplex offers immediate income with one fully finished 1-bedroom unit, while the second side presents a great value-add opportunity. The unfinished unit has strong potential to be converted into a spacious 2-bedroom apartment, allowing for increased rental income and long-term equity growth. Whether you're looking to expand your short-term rental portfolio or create a dual-income long-term rental, this property offers flexibility to fit your investment strategy. Endless opportunities!
ⓘ Source: listings_history table (triggers on properties + properties_extension) + one-shot
backfill from property_details.listing_events for pre-trigger history.
Tax reassessment forecast IN · Partial reset (capped growth)
- Current annual tax
- $1,302 · $108/mo
- Projected year-2 tax
- $1,302 · $108/mo
- Expected delta
- $0/yr ($0/mo · 0.0%)
ⓘ Screening estimate from a state-policy table — verify with the county assessor before closing.
Climate risk First Street
- Flood 1/10 Low FEMA zone X (unshaded) · 0% chance over 30 yrs
- Wildfire 1/10 Low
- Heat 4/10 Moderate 7 d/yr ≥102°F today · 20 d/yr by 30 yrs out
- Wind 2/10 Low 100% chance of damaging wind over 30 yrs
- Air quality 2/10 Low 1 unhealthy d/yr today · 2 by 30 yrs out
Nearby sold comps map
Loading sold comps map…
Walkable amenities ~0.75 mi
Loading nearby amenities…
Taxation est. · year 1
- Rental income
- $17,383
- − Mortgage interest
- −$4,705
- − Property taxes
- −$1,302
- − Insurance
- −$420
- − Repairs & maintenance
- −$1,391
- − Management
- −$1,391
- − Depreciation
- −$2,444
- Taxable income
- $5,731
- Est. tax owed @ 24.0%
- −$1,375
- After-tax cash flow
- $5,349/yr
For passive investors: Depreciation is non-cash, so a rental often shows a tax loss while cash-flowing — sheltering income. Rental losses are passive: they offset passive income freely, and up to $25,000/yr can offset ordinary (W-2) income if you actively participate and your MAGI is under $100k (phasing out to $0 by $150k); unused losses carry forward. On sale, claimed depreciation is recaptured at up to 25%, and gains may owe capital-gains tax (a 1031 exchange can defer both). Figures are a year-1 estimate at your 24.0% rate — not tax advice; consult a CPA.
Schools (NCES district)
No district data.
Livability — Laurel
- Score
- 61/100
- State rank
- #488
- US rank
- #17449
Category grades
Schools grade is shown separately in the Schools card above.
Census & demographics
- Census place
- Laurel, IN
- Population (ZIP)
- 2,909
Population outlook (Franklin County) Hauer SSP2
- Today (2025)
- 22,796 people
- By 2030
- 22,556 · -1.1%
- By 2040
- 21,762 · -4.5%
- By 2050
- 20,575 · -9.7%
- By 2075
- 17,810 · -21.9%
- By 2100
- 13,698 · -39.9%
Race, ethnicity, and origin ACS 2023
- Neighborhood character
- Predominantly White (93%)
- Race & ethnicity
- White 93% Two or more races 4% Hispanic / Latino 2%
- Common ancestry
- Slovak 2% Italian 2% Romanian 2%
- Languages at home
- 98% English-only · German/W. Germanic 1%
Political lean MEDSL · Franklin
- 2024 margin
- Solid R (+64.4) · D 17.1% · R 81.5% · Other 1.3%
- 2008→2024 swing
- -30.3pp toward R · 2008: -34.1pp · 2024: -64.4pp
- All cycles
- 2024: R+64.4 2020: R+63.0 2016: R+60.9 2012: R+42.8 2008: R+34.1
Not yet ingested
- Civics
- —
Market trends
- HPI YoY
- ▲ 7.94%
- Current HPI
- 255.8207
- Rent YoY
- —
- Metro
- —
- State GDP YoY
- ▲ 2.90%
- F500 in state
- 18
Industry mix (Fortune 500 HQ in IN)
| Industry | F500 HQs | Revenue |
|---|---|---|
| Industrial Machinery | 2 | $37B |
|
||
| Healthcare | 1 | $177B |
|
||
| Pharmaceuticals | 1 | $45B |
|
||
| Metals / Steel | 1 | $18B |
|
||
| Agriculture | 1 | $17B |
|
||
| Packaging | 1 | $12B |
|
||
Price history
+0.0% since first listed3 events — show timeline
- 2026-04-22 Listed $84,000 MIBOR as Distributed by MLS Grid
- 2026-04-22 Listed $84,000 ECIAOR
- 2026-04-22 Listed $84,000 SEIBR
Property tax history
+3.2%/yrLatest (2024): $1,302 · +4.0% YoY. Source: county tax records.
Cash-flow waterfall
monthlySold comps — $/sqft
last 12 mo · ≤1 miLoading sold comps…