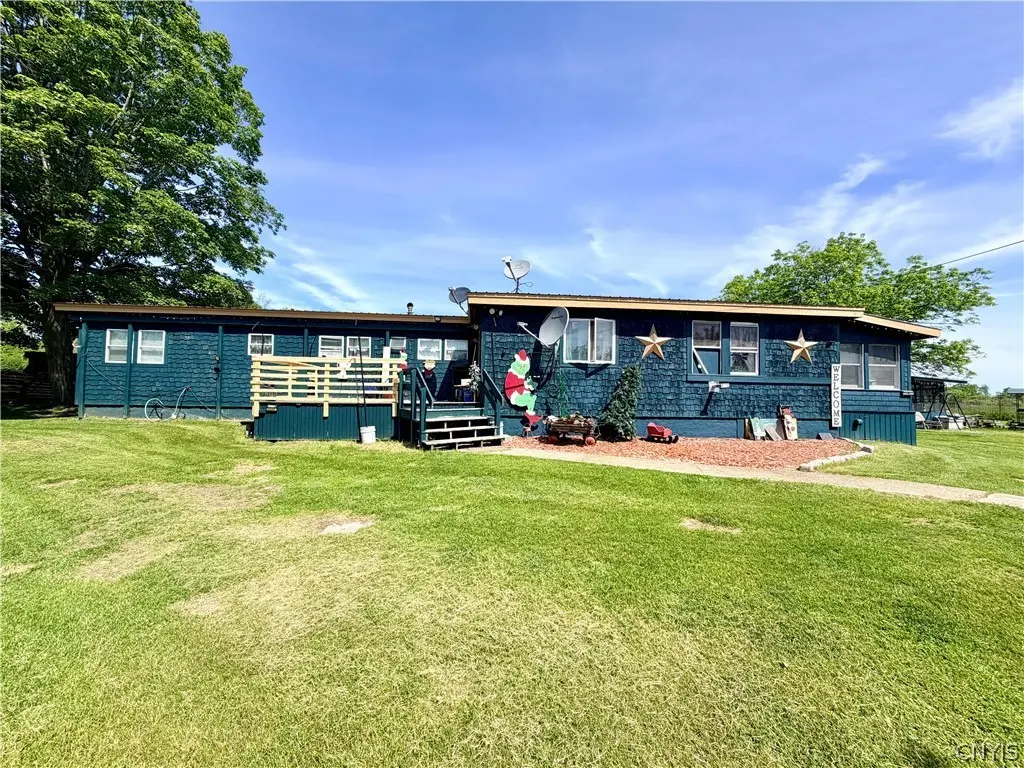
34777 Clayton Center Rd · Depauville, NY
Flood risk 1/10 · Minimal
- FEMA flood zone
- X
- Chance of flooding over 30 yrs
- 0.0%
- Est. flood insurance / yr
- $507 – $1,088
Fire risk 3/10 · Minor
- Est. fire insurance / yr
- $691 – $1,283
Heat risk 2/10 · Minimal
- Hot days now (above 92°F)
- 7 days/yr
- Hot days in 30 yrs
- 15 days/yr
Wind risk 1/10 · Minimal
- Chance of severe wind over 30 yrs
- 1.0%
Air-quality risk 2/10 · Minimal
- Unhealthy air days now
- 1 days/yr
- Unhealthy air days in 30 yrs
- 1 days/yr
Risk factors via First Street. Map © Google.
Why this score? — see what drove the D- grade
The composite is a weighted blend of 9 inputs, each scored 0–100. Each bar is that input's sub-score; the figure is the points it added to the 100-point composite (weight × sub-score).
- Appreciation +9.7/10.0
- ARV discount +7.5/15.0
- Cash flow +5.8/30.0
- Schools +5.0/10.0
- Livability +2.7/5.0
- Rent growth +2.5/5.0
- Condition / age +2.5/5.0
- DSCR +0.2/10.0
- 1% rule +0.1/10.0
$200,000
🖨 Deal sheet (PDF) 📄 Offer letter ✓ Due diligence
Listing remarks
If you need room for all your toys, cars, ATVs, snowmobiles, and dream of space to spread out, this nearly 4-acre property delivers. Tucked just 5 miles from the St. Lawrence River in the charming village of Clayton and 9 miles from Lake Ontario in Chaumont. This 3-bedroom, 1.5-bath home has been completely renovated inside and out, with thoughtful additions and a layout that flows beautifully, each bedroom has its own easy exit, ideal for rental potential. The opportunities here are endless. A massive 4-bay garage stores your gear or generates rental income, with potential living space above ready to become an in-law suite or rental unit. Enjoy the gazebo with electric and hot/cold water,
Key facts
- Completely renovated
- Massive 4 bay garage
- 3.82 acre lot
Tags
Property features AI
Exterior
- Parking: Detached garage; Four garage spaces
- Utilities: Electricity connected; Well water; Septic tank
- Home design: Single-story home; Single wide body type (mobile home)
- Construction: Cedar construction; Slab foundation; Existing (previously built)
- Exterior features: Gravel driveway; Hot tub / spa; Barn(s); Gazebo; Outbuilding; Poultry coop; Shed(s); Storage
Interior
- Kitchen: Gas cooktop; Refrigerator
- Bedrooms: Three main-level bedrooms
- Flooring: Carpet; Tile; Vinyl; Varies
- Bathrooms: One full bathroom; One half bathroom; Two main-level bathrooms
- Heating & cooling: Wood stove heating
- Interior features: Separate/formal living room; Kitchen and family room combo; Bedroom on main level; Workshop; Crawl space basement
- Laundry & utility: Main-level laundry; Water heater
Neighborhood map
What this means for you Summary
Snapshot
- This is a 3-bed/1.5-bath manufactured listed at $200k.
Deal economics
- At list price, monthly cash flow is $-396 ($-5k/yr) — negative.
- To cash-flow at today's rent, offer at most $130k (34.9% below list).
- To meet the 1% rule (rent ≥ 1% of price), the offer needs to be $101k (49.3% below list).
- Recommended offer: $101k (49.3% below list) — sets the bar for 1% rule.
Location & tenants
- Location reads 54/100 on livability (#1,147 in NY) — a working-class tenant base; expect higher turnover. Strengths: employment A+, crime A; Watch: health & safety D, amenities F, commute F.
- Thousand Islands Central School District (rural): math 60% / reading 56% proficiency, ranked #262 of 590 in NY (top 44%) — acceptable for families but not a draw, mixed tenant base, ~2y average lease.
- Zoned schools: Guardino Elementary School (math 57% / reading 52%, grade C, #908 of 2,108 statewide, top 46%, 293 students, 44% FRL); Thousand Islands Middle School (math 50% / reading 56%, grade C+, #233 of 729 statewide, top 32%, 209 students, 50% FRL); Thousand Islands High School (math 92% / reading 70%, grade A, #495 of 1,100 statewide, top 46%, 247 students, 47% FRL) — zoned schools average 47% FRL vs 29% district-wide (18 pts higher); higher-poverty schools than district average — tighter screening recommended.
- Market conditions: 57 active listings in the ZIP; 196 units permitted in Jefferson County in 2024 (0 in 5+ unit buildings).
Forward outlook
- In year one you build about $20k of equity ($1k loan paydown + $19k appreciation (9.4% local appreciation)).
- Jefferson County population projected at -12% by 2050 — secular population decline; favor cash flow + early exit over multi-decade hold.
- By year 2, paydown + projected appreciation supports a ~$32k cash-out refi (75% LTV) — recoverable capital for the next deal without selling this one.
Negotiation context
- It's been on market 19 days — a 2% lower offer ($197k) is reasonable based on typical stale-listing flexibility.
Questions for the listing agent
- What do current leases actually rent for vs. the listed asking? Can we see a recent rent roll and the last 12 months of T-12 income?
- Is there a deadline driving the sale (1031 exchange, divorce, estate, relocation)? That informs how much negotiation room exists.
- Schools are F-rated, which usually means shorter tenancies and higher turnover. Who's the typical renter profile here, and what's been the actual vacancy rate?
- The area grade is low — what's the realistic commute time and amenity access for the typical tenant pool here? Any planned neighborhood developments (good or bad) we should know about?
- What's the average days-on-market for RENTAL listings here right now (not sales)? A rising rental-DOM trend means longer vacancies and softer asking-rent achievability than the comps imply.
- What's the recent tenant-quality profile in this submarket — average credit score on applications, eviction rate, late-payment / NSF rate, and stable-employment percentage? A property-management company in the area should have these aggregated.
- How much new for-sale + rental construction is in the pipeline within 1–3 miles? Heavy new supply typically softens prices + rents 12–24 months out; constrained supply supports both.
Investment metrics
- 1% rule
- 0.51% ✗
- Cap rate
- 3.92%
- Cash-on-cash
- -8.48%
- DSCR
- 0.62
- GRM
- 16.4
CMA / ARV
No comps found within radius.
Projected returns pro-forma
9.39% appreciation · 3.0% rent growth · sell at horizon
- IRR
- 16.9%
- Equity multiple
- 2.34×
- Total profit
- $75,309
- Equity at exit
- $171,320
- IRR
- 16.0%
- Equity multiple
- 5.28×
- Total profit
- $239,459
- Equity at exit
- $360,425
Cash invested: $56,000 (down + closing). Projections, not guarantees.
Landlord ↔ Tenant lean methodology
- Overall (STATE)
- 15 Strongly Tenant-Friendly
- State New York
- 15 Strongly Tenant-Friendly · D+10
- County
- — inherits STATE
- City
- — inherits STATE
ZIP-level market 13624
- Home prices YoY
- 2.3%
- Active inventory
- 57
- Price-to-rent
- 16.4×
Monthly cashflow live
- Estimated rent
- $1,015 medium interval (Pro) →
- Mortgage (P&I)
- −$1,049
- Tax from tax record
- −$65 /mo · $781/yr
- Insurance
- −$83
- HOA
- −$0
- Lot rent leased land?
- −$0
- Vacancy / Maint / Mgmt
- −$213
- Net cashflow
- $-396
Break-even live
Sensitivity live
| Price | -10% $-282 | -5% $-339 | +0% $-396 | +5% $-452 | +10% $-509 |
|---|---|---|---|---|---|
| Rent | -10% $-476 | -5% $-436 | +0% $-396 | +5% $-355 | +10% $-315 |
| Rate | -1.0pp $-295 | -0.5pp $-345 | base $-396 | +0.5pp $-447 | +1.0pp $-500 |
UW: 25.0% down · 7.5% · 30yr · 1.5% tax · 5.0% vac · 8.0% maint · 8.0% mgmt
Financing live
Cash to close
- Down payment
- $50,000
- Closing costs
- $6,000
- Reserves months
- —
- Total cash needed
- —
Loan-product check · same deal, 3 products live
Conventional
25% down · 7.5% · 30yr
- Down + closing
- —
- Monthly P&I
- —
- Monthly cashflow
- —
- DSCR
- —
- Eligible?
- —
Personal DTI + credit; lowest rate.
DSCR
20% down · 8.5% · 30yr
- Down + closing
- —
- Monthly P&I
- —
- Monthly cashflow
- —
- DSCR
- —
- Eligible?
- —
No personal income docs; deal must DSCR.
Hard money
10% down · 12.0% · 12mo
- Down + closing
- —
- Monthly P&I
- —
- Monthly cashflow
- —
- DSCR
- —
- Eligible?
- —
Short-term bridge; refi at stabilization.
Listing history 13 events
-
2026-06-22days on market $200,000 Active 19 DOM
-
2026-06-19days on market $200,000 Active 16 DOM
-
2026-06-18days on market $200,000 Active 15 DOM
-
2026-06-17days on market $200,000 Active 14 DOM
-
2026-06-16days on market $200,000 Active 13 DOM
-
2026-06-16price $200,000 Active 12 DOM
-
2026-06-15days on market $225,000 Active 12 DOM
-
2026-06-14days on market $225,000 Active 10 DOM
-
2026-06-12days on market $225,000 Active 9 DOM
-
2026-06-09days on market $225,000 Active 6 DOM
-
2026-06-08days on market $225,000 Active 5 DOM
-
2026-06-07remarks 699-char remark
-
2026-06-07$225,000 Active 4 DOM
ⓘ Source: listings_history table (triggers on properties + properties_extension) + one-shot
backfill from property_details.listing_events for pre-trigger history.
Tax reassessment forecast NY · Partial reset (capped growth)
- Current annual tax
- $781 · $65/mo
- Projected year-2 tax
- $2,081 · $173/mo
- Expected delta
- +$1,299/yr (+$108/mo · 166.3%)
ⓘ Screening estimate from a state-policy table — verify with the county assessor before closing.
Climate risk First Street
- Flood 1/10 Low FEMA zone X · 0% chance over 30 yrs
- Wildfire 3/10 Moderate
- Heat 2/10 Low 7 d/yr ≥92°F today · 15 d/yr by 30 yrs out
- Wind 1/10 Low 100% chance of damaging wind over 30 yrs
- Air quality 2/10 Low 1 unhealthy d/yr today · 1 by 30 yrs out
Nearby sold comps map
Loading sold comps map…
Walkable amenities ~0.75 mi
Loading nearby amenities…
Taxation est. · year 1
- Rental income
- $12,178
- − Mortgage interest
- −$11,203
- − Property taxes
- −$781
- − Insurance
- −$1,000
- − Repairs & maintenance
- −$974
- − Management
- −$974
- − Depreciation
- −$5,818
- Taxable loss
- −$8,573
- Est. tax savings @ 24.0%
- +$2,058
- After-tax cash flow
- $-2,689/yr
For passive investors: Depreciation is non-cash, so a rental often shows a tax loss while cash-flowing — sheltering income. Rental losses are passive: they offset passive income freely, and up to $25,000/yr can offset ordinary (W-2) income if you actively participate and your MAGI is under $100k (phasing out to $0 by $150k); unused losses carry forward. On sale, claimed depreciation is recaptured at up to 25%, and gains may owe capital-gains tax (a 1031 exchange can defer both). Figures are a year-1 estimate at your 24.0% rate — not tax advice; consult a CPA.
Schools (NCES district)
- District
- Thousand Islands Central School District
- NCES district ID
- 3607650
- Math proficiency
- 60% ▼ -2.00%
- Reading proficiency
- 56% ▼ -2.00%
- Median HH income
- $55,233
- Composite
- 49.94/100
- National rank
- #1930
- State rank
- #262 of 590 in NY
Livability — Depauville
- Score
- 54/100
- State rank
- #1147
- US rank
- #23925
Category grades
Schools grade is shown separately in the Schools card above.
Census & demographics
- City population
- 128
- Population (ZIP)
- 4,438
Population outlook (Jefferson County) Hauer SSP2
- Today (2025)
- 111,748 people
- By 2030
- 109,370 · -2.1%
- By 2040
- 103,828 · -7.1%
- By 2050
- 98,523 · -11.8%
- By 2075
- 91,422 · -18.2%
- By 2100
- 78,214 · -30.0%
Race, ethnicity, and origin ACS 2023
- Neighborhood character
- Predominantly White (86%)
- Race & ethnicity
- White 86% Black 6% Hispanic / Latino 4% Two or more races 3%
- Common ancestry
- Lithuanian 9% Romanian 5% Slovak 3%
- Foreign-born
- 4% · Canada, China
- Languages at home
- 94% English-only · Spanish 3% Other Indo-European 2% French/Haitian/Cajun 1%
Political lean MEDSL · Jefferson
- 2024 margin
- Strong R (+23.6) · D 38.2% · R 61.8%
- 2008→2024 swing
- -18.3pp toward R · 2008: -5.3pp · 2024: -23.6pp
- All cycles
- 2024: R+23.6 2020: R+19.0 2016: R+22.4 2012: R+2.9 2008: R+5.3
Not yet ingested
- Civics
- —
Market trends
- HPI YoY
- ▲ 9.39%
- Current HPI
- 418.5008
- Rent YoY
- —
- Metro
- —
- State GDP YoY
- ▲ 2.60%
- F500 in state
- 92
Industry mix (Fortune 500 HQ in NY)
| Industry | F500 HQs | Revenue |
|---|---|---|
| Financial Services | 10 | $950B |
|
||
| Consumer Goods | 9 | $162B |
|
||
| Insurance | 4 | $225B |
|
||
| Telecommunications | 2 | $144B |
|
||
| Pharmaceuticals | 2 | $112B |
|
||
| Media / Entertainment | 2 | $69B |
|
||
Price history
1 event — show timeline
- 2026-06-02 Listed $225,000 CNYIS
Property tax history
+0.9%/yrLatest (2025): $781 · -2.6% YoY. Source: county tax records.
Cash-flow waterfall
monthlySold comps — $/sqft
last 12 mo · ≤1 miLoading sold comps…