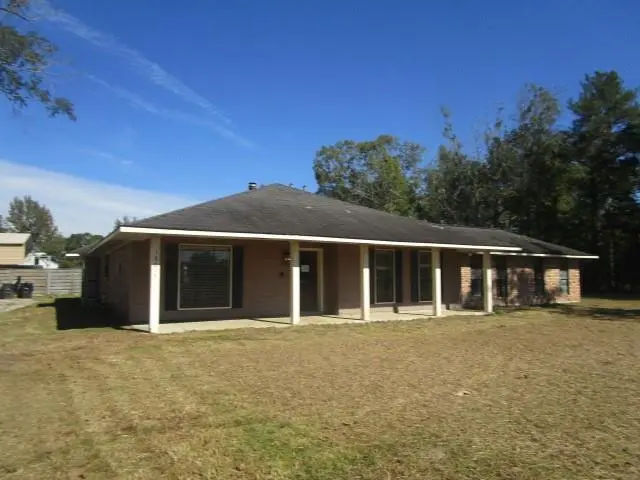
18215 Hoo Shoo Too Rd · Old Jefferson, LA
Flood risk 1/10 · Minimal
- FEMA flood zone
- X
- Chance of flooding over 30 yrs
- 0.0%
- Est. flood insurance / yr
- $507 – $1,088
Fire risk 1/10 · Minimal
- Est. fire insurance / yr
- $1,269 – $2,357
Heat risk 8/10 · Major
- Hot days now (above 108°F)
- 7 days/yr
- Hot days in 30 yrs
- 21 days/yr
Wind risk 9/10 · Severe
- Chance of severe wind over 30 yrs
- 99.0%
Air-quality risk 3/10 · Minor
- Unhealthy air days now
- 2 days/yr
- Unhealthy air days in 30 yrs
- 3 days/yr
Risk factors via First Street. Map © Google.
Why this score? — see what drove the C+ grade
The composite is a weighted blend of 9 inputs, each scored 0–100. Each bar is that input's sub-score; the figure is the points it added to the 100-point composite (weight × sub-score).
- Cash flow +21.4/30.0
- ARV discount +15.0/15.0
- DSCR +6.8/10.0
- 1% rule +5.6/10.0
- Livability +3.7/5.0
- Rent growth +3.0/5.0
- Condition / age +2.5/5.0
- Schools +2.4/10.0
- Appreciation +0.0/10.0
$219,000
🖨 Deal sheet 📄 Offer letter ✓ Due diligence
Listing remarks MLS
Spacious property located on beautiful lot and it is in flood zone X.
Key facts
- 1.22 acre lot
- Parking
- Built 1965
Neighborhood map
What this means for you Summary
Snapshot
- This is a 3-bed/3.0-bath other listed at $219k.
Deal economics
- At list price, monthly cash flow is $326 ($4k/yr) — positive.
- The deal already cash-flows at list — no discount required.
- Meets the 1% rule at list price ($2k rent vs $219k).
- Recommended offer: $193k (12.0% below list) — sets the bar for market timing.
- Cap rate 8.1% vs local median 4.4% in Old Jefferson — top-decile yield for the area; either an underpriced asset or a hidden risk that comps aren't pricing in. Stress-test before assuming the spread holds.
Location & tenants
- Location reads 73/100 on livability (#36 in LA) — a middle-class / working-renter tenant base. Strengths: schools A+, housing A+, employment A; Watch: amenities F, commute F.
- East Baton Rouge Parish (urban): math 22% / reading 34% proficiency, ranked #47 of 98 in LA (top 48%) — low school quality limits family demand, transient renter base, plan for 1-2y turnover; 77% free/reduced lunch — lower-income household profile, screen leases tightly.
- Market conditions: Rents rising (+2.0%/yr); 360 active listings in the ZIP; 6 comparable units currently listed for rent nearby; rentals at typical pace (median 19d on market — plan ~3-4 weeks tenant-placement turnaround); solid renter incomes; 2,252 units permitted in East Baton Rouge Parish in 2024 (440 in 5+ unit buildings).
Forward outlook
- Local home prices are declining (-3.0%/yr); year-one equity from $2k of loan paydown is wiped out by about $7k of value loss. Plan a longer hold.
- East Baton Rouge County population projected at +4% by 2050 — modest demand growth; plan on rents tracking national, not racing it.
Negotiation context
- It's been on market 169 days — a 12% lower offer ($193k) is reasonable based on typical stale-listing flexibility.
- 6 sale attempts since 27y ago; this cycle's ask has dropped $80k (27%) from the opening price — seller is motivated, your offer sets the floor, not the list.
Risks & watch-outs
- Climate carrying-cost: severe wind risk, 99% chance of damaging wind over 30y; extreme-heat days projected 7→21/yr by 2055 (HVAC capex compounding) — expect insurance premiums to compound above CPI over the hold.
Questions for the listing agent
- It's been on market 169 days. Have you received any prior offers? Is the seller open to a 12% concession, seller financing, or rate buy-down credit?
- Built in 1965 — when were the roof, HVAC, electrical panel, plumbing, and water heater last replaced?
- Why hasn't it sold? Are there any deal-killer items the seller is aware of (foundation, flood, title, zoning, code violations)?
- Is there a deadline driving the sale (1031 exchange, divorce, estate, relocation)? That informs how much negotiation room exists.
- Schools are A-rated — typically a magnet for longer-tenancy family renters. What's the average tenant stay here, and is there a school-zone premium baked into asking?
- What's the average days-on-market for RENTAL listings here right now (not sales)? A rising rental-DOM trend means longer vacancies and softer asking-rent achievability than the comps imply.
- What's the recent tenant-quality profile in this submarket — average credit score on applications, eviction rate, late-payment / NSF rate, and stable-employment percentage? A property-management company in the area should have these aggregated.
- How much new for-sale + rental construction is in the pipeline within 1–3 miles? Heavy new supply typically softens prices + rents 12–24 months out; constrained supply supports both.
Investment metrics
- 1% rule
- 1.06% ✓
- Cap rate
- 8.08%
- Cash-on-cash
- 6.37%
- DSCR
- 1.28
- GRM
- 7.8
CMA / ARV
- ARV (median comp)
- $313,821
- List price
- $219,000
- Delta
- -30.22%
- Verdict
- UNDERPRICED
- Comps
- 20 within 1.0 mi
Projected returns pro-forma
-3.0% appreciation · 2.05% rent growth · sell at horizon
- IRR
- -7.6%
- Equity multiple
- 0.72×
- Total profit
- $-16,922
- Equity at exit
- $32,654
- IRR
- 0.8%
- Equity multiple
- 1.05×
- Total profit
- $3,232
- Equity at exit
- $18,935
Cash invested: $61,320 (down + closing). Projections, not guarantees.
Landlord ↔ Tenant lean methodology
- Overall (STATE)
- 90 Strongly Landlord-Friendly
- State Louisiana
- 90 Strongly Landlord-Friendly · R+12
- County
- — inherits STATE
- City
- — inherits STATE
ZIP-level market 70817
- Rents YoY
- 2.0%
- Active inventory
- 360
- Price-to-rent
- 7.8×
Monthly cashflow live
- Estimated rent
- $2,328 high interval (Pro) →
- Mortgage (P&I)
- −$1,148
- Tax est. 1.5%
- −$274 /mo · $3,285/yr
- Insurance
- −$91
- HOA
- −$0
- Vacancy / Maint / Mgmt
- −$489
- Net cashflow
- $326
Break-even live
UW: 25.0% down · 7.5% · 30yr · 1.5% tax · 5.0% vac · 8.0% maint · 8.0% mgmt
Financing live
Cash to close
- Down payment
- $54,750
- Closing costs
- $6,570
- Reserves months
- —
- Total cash needed
- —
Loan-product check · same deal, 3 products live
Conventional
25% down · 7.5% · 30yr
- Down + closing
- —
- Monthly P&I
- —
- Monthly cashflow
- —
- DSCR
- —
- Eligible?
- —
Personal DTI + credit; lowest rate.
DSCR
20% down · 8.5% · 30yr
- Down + closing
- —
- Monthly P&I
- —
- Monthly cashflow
- —
- DSCR
- —
- Eligible?
- —
No personal income docs; deal must DSCR.
Hard money
10% down · 12.0% · 12mo
- Down + closing
- —
- Monthly P&I
- —
- Monthly cashflow
- —
- DSCR
- —
- Eligible?
- —
Short-term bridge; refi at stabilization.
Rent comps 6 comps
| Address | Beds | Baths | Sqft | Rent | $/sqft | DOM | Units | Dist |
|---|---|---|---|---|---|---|---|---|
| 18585 Lakefield Ave Baton Rouge, LA | 3.0 | 2.0 | 1616 | $2,100 | $1.30 | 19d | 1 | 0.27mi |
| 18482 Lake Iris Ave Baton Rouge, LA | 3.0 | 2.0 | 1580 | $2,895 | $1.83 | 19d | 1 | 0.34mi |
| 16632 Highland Club Ave Baton Rouge, LA | 3.0 | 2.5 | 2076 | $2,400 | $1.16 | 43d | 1 | 0.82mi |
| 10028 Savannah Jane Ln Baton Rouge, LA | 4.0 | 2.0 | 1870 | $2,250 | $1.20 | 43d | 1 | 1.27mi |
| 10028 Savannah Jane Ln Baton Rouge, LA | 4.0 | 2.0 | 1870 | $2,250 | $1.20 | 19d | 1 | 1.27mi |
| 17653 Carlisle Ave Baton Rouge, LA | 4.0 | 2.0 | 1601 | $2,125 | $1.33 | 14d | 1 | 1.46mi |
Listing history 21 events
-
2026-05-13status Pending 69-char remark
Show marketing remark (69 chars)
Spacious property located on beautiful lot and it is in flood zone X.
-
2026-05-13status Pending 69-char remark
Show marketing remark (69 chars)
Spacious property located on beautiful lot and it is in flood zone X.
-
2026-04-14price $219,000 69-char remark
Show marketing remark (69 chars)
Spacious property located on beautiful lot and it is in flood zone X.
-
2026-04-14price $219,000 69-char remark
Show marketing remark (69 chars)
Spacious property located on beautiful lot and it is in flood zone X.
-
2026-03-30price $229,000 69-char remark
Show marketing remark (69 chars)
Spacious property located on beautiful lot and it is in flood zone X.
-
2026-03-30price $229,000 69-char remark
Show marketing remark (69 chars)
Spacious property located on beautiful lot and it is in flood zone X.
-
2026-02-25price $249,000 69-char remark
Show marketing remark (69 chars)
Spacious property located on beautiful lot and it is in flood zone X.
-
2026-02-25price $249,000 69-char remark
Show marketing remark (69 chars)
Spacious property located on beautiful lot and it is in flood zone X.
-
2026-01-30price $269,000 69-char remark
Show marketing remark (69 chars)
Spacious property located on beautiful lot and it is in flood zone X.
-
2026-01-28price $269,000 69-char remark
Show marketing remark (69 chars)
Spacious property located on beautiful lot and it is in flood zone X.
-
2025-12-30price $285,000 69-char remark
Show marketing remark (69 chars)
Spacious property located on beautiful lot and it is in flood zone X.
-
2025-12-30price $285,000 69-char remark
Show marketing remark (69 chars)
Spacious property located on beautiful lot and it is in flood zone X.
-
2025-11-24$299,000 Active 69-char remark
Show marketing remark (69 chars)
Spacious property located on beautiful lot and it is in flood zone X.
-
2025-11-24$299,000 Active 69-char remark
Show marketing remark (69 chars)
Spacious property located on beautiful lot and it is in flood zone X.
-
2017-08-18soldstatus Sold
-
2017-06-13historical
-
2017-06-12status Pending
-
2017-06-08$379,000 Active
-
2017-05-02$379,000 Active
-
2017-04-28$379,000
-
1999-01-12$189,900
ⓘ Source: listings_history table (triggers on properties + properties_extension) + one-shot
backfill from property_details.listing_events for pre-trigger history.
Climate risk First Street
- Flood 1/10 Low FEMA zone X · 0% chance over 30 yrs
- Wildfire 1/10 Low
- Heat 8/10 Severe 7 d/yr ≥108°F today · 21 d/yr by 30 yrs out
- Wind 9/10 Extreme 99% chance of damaging wind over 30 yrs
- Air quality 3/10 Moderate 2 unhealthy d/yr today · 3 by 30 yrs out
Nearby sold comps map
Loading sold comps map…
Walkable amenities ~0.75 mi
Loading nearby amenities…
Taxation est. · year 1
- Rental income
- $27,934
- − Mortgage interest
- −$12,267
- − Property taxes
- −$3,285
- − Insurance
- −$1,095
- − Repairs & maintenance
- −$2,235
- − Management
- −$2,235
- − Depreciation
- −$6,371
- Taxable income
- $447
- Est. tax owed @ 24.0%
- −$107
- After-tax cash flow
- $3,799/yr
For passive investors: Depreciation is non-cash, so a rental often shows a tax loss while cash-flowing — sheltering income. Rental losses are passive: they offset passive income freely, and up to $25,000/yr can offset ordinary (W-2) income if you actively participate and your MAGI is under $100k (phasing out to $0 by $150k); unused losses carry forward. On sale, claimed depreciation is recaptured at up to 25%, and gains may owe capital-gains tax (a 1031 exchange can defer both). Figures are a year-1 estimate at your 24.0% rate — not tax advice; consult a CPA.
Schools (NCES district)
- District
- East Baton Rouge Parish
- NCES district ID
- 2200540
- Math proficiency
- 22% ▼ -36.00%
- Reading proficiency
- 34% ▼ -31.00%
- Median HH income
- $46,263
- Composite
- 24.14/100
- National rank
- #7745
- State rank
- #47 of 98 in LA
Livability — Old Jefferson
- Score
- 73/100
- State rank
- #36
- US rank
- #5501
Category grades
Schools grade is shown separately in the Schools card above.
Census & demographics
- Census place
- Old Jefferson, LA
- County
- East Baton Rouge Parish · 399,686 people
- Metro
- Baton Rouge, LA
- Population (ZIP)
- 33,482
- Household income
- $102,639
- Rent vs Own
- Severe rent burden
- 755.0
Population outlook (East Baton Rouge County) Hauer SSP2
- Today (2025)
- 464,810 people
- By 2030
- 472,137 · +1.6%
- By 2040
- 480,243 · +3.3%
- By 2050
- 484,422 · +4.2%
- By 2075
- 492,069 · +5.9%
- By 2100
- 476,347 · +2.5%
Race, ethnicity, and origin ACS 2023
- Neighborhood character
- Majority White (64%)
- Race & ethnicity
- White 64% Black 21% Two or more races 9% Hispanic / Latino 5% Asian 3%
- Common ancestry
- Lithuanian 13% Italian 2% Serbian 2%
- Foreign-born
- 6% · Canada, Vietnam, China
- Languages at home
- 91% English-only · Spanish 3% Arabic 1% Vietnamese 1%
Political lean MEDSL · East Baton Rouge
- 2024 margin
- D (+11.1) · D 54.5% · R 43.4% · Other 2.1%
- 2008→2024 swing
- +8.9pp toward D · 2008: 2.2pp · 2024: 11.1pp
- All cycles
- 2024: D+11.1 2020: D+13.1 2016: D+9.2 2012: D+5.2 2008: D+2.2
Not yet ingested
- Civics
- —
Market trends
- HPI YoY
- ▼ -149.27%
- Current HPI
- 170.6826
- Rent YoY
- ▲ 2.05%
- Metro
- Baton Rouge, LA
- State GDP YoY
- ▲ 3.29%
- F500 in state
- 10
Industry mix (Fortune 500 HQ in LA)
| Industry | F500 HQs | Revenue |
|---|---|---|
| Telecommunications | 2 | $23B |
|
||
| Utilities | 1 | $12B |
|
||
| Wholesale / Distribution | 1 | $5B |
|
||
| Advertising | 1 | $2B |
|
||
Price history
+15.3% since first listed21 events — show timeline
- 2026-05-13 Pending — AcadianaMLS
- 2026-05-13 Pending — GSREIN
- 2026-04-14 Price Changed $219,000 AcadianaMLS
- 2026-04-14 Price Changed $219,000 GSREIN
- 2026-03-30 Price Changed $229,000 AcadianaMLS
- 2026-03-30 Price Changed $229,000 GSREIN
- 2026-02-25 Price Changed $249,000 AcadianaMLS
- 2026-02-25 Price Changed $249,000 GSREIN
- 2026-01-30 Price Changed $269,000 AcadianaMLS
- 2026-01-28 Price Changed $269,000 GSREIN
- 2025-12-30 Price Changed $285,000 AcadianaMLS
- 2025-12-30 Price Changed $285,000 GSREIN
- 2025-11-24 Listed $299,000 GSREIN
- 2025-11-24 Listed $299,000 AcadianaMLS
- 2017-08-18 Sold (MLS) — GBRMLS
- 2017-06-13 Delisted — GBRMLS
- 2017-06-12 Pending — GBRMLS
- 2017-06-08 Listed $379,000 GBRMLS
- 2017-05-02 Listed $379,000 GBRMLS
- 2017-04-28 Listed $379,000 AcadianaMLS
- 1999-01-12 Listed $189,900 AcadianaMLS
Property tax history
-28.3%/yrLatest (2017): $92 · -70.3% YoY. Source: county tax records.
Cash-flow waterfall
monthlySold comps — $/sqft
last 12 mo · ≤1 miLoading sold comps…