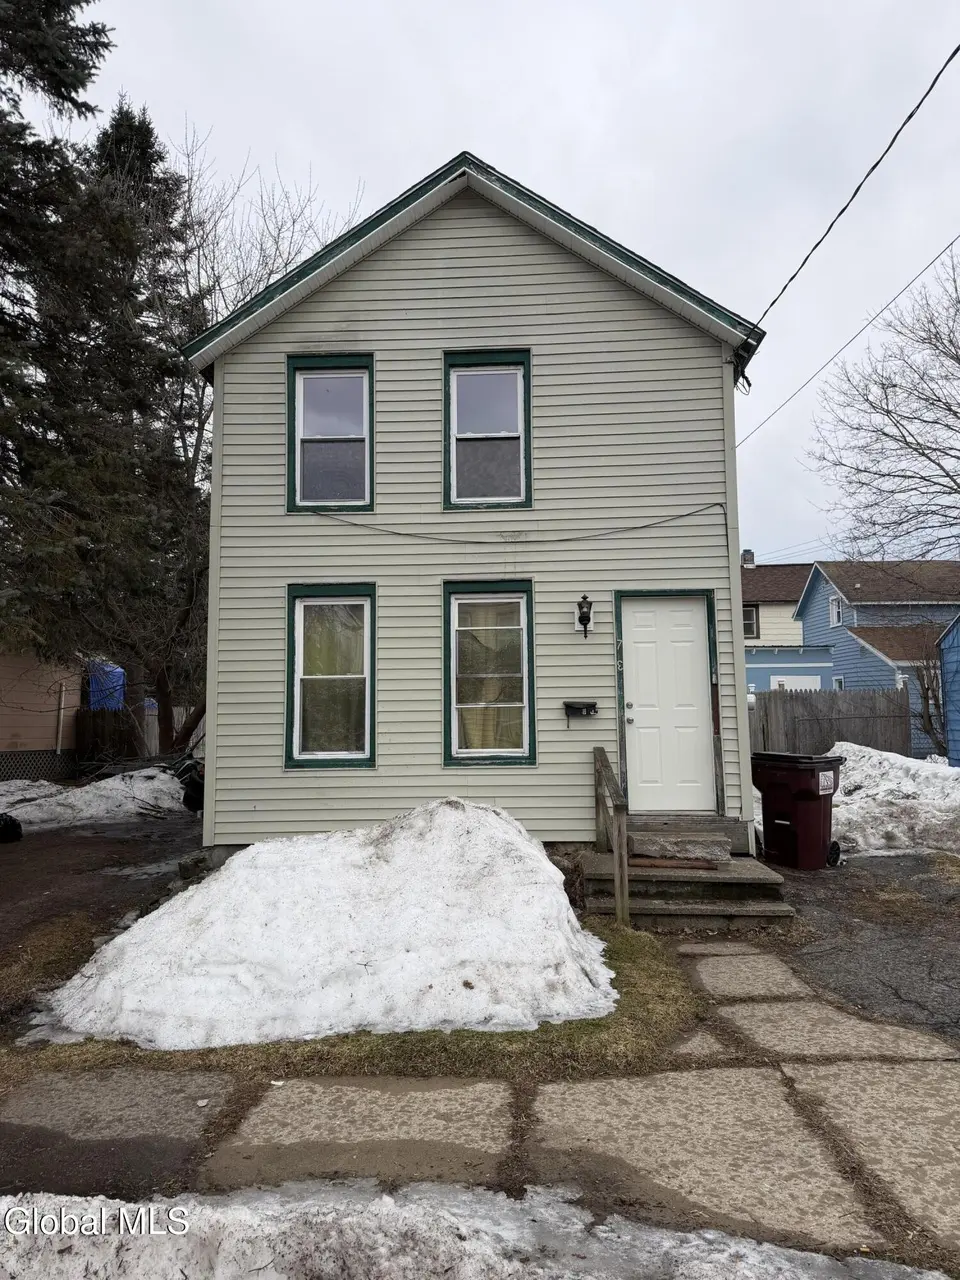
173 N Arlington Ave · Gloversville, NY
Flood risk 9/10 · Severe
- FEMA flood zone
- AE
- Chance of flooding over 30 yrs
- 0.99%
- Est. flood insurance / yr
- $2,026 – $9,024
Fire risk 1/10 · Minimal
- Est. fire insurance / yr
- $691 – $1,283
Heat risk 2/10 · Minimal
- Hot days now (above 93°F)
- 7 days/yr
- Hot days in 30 yrs
- 16 days/yr
Wind risk 2/10 · Minimal
- Chance of severe wind over 30 yrs
- 3.0%
Air-quality risk 1/10 · Minimal
- Unhealthy air days now
- 0 days/yr
- Unhealthy air days in 30 yrs
- 0 days/yr
Risk factors via First Street. Map © Google.
Why this score? — see what drove the B+ grade
The composite is a weighted blend of 9 inputs, each scored 0–100. Each bar is that input's sub-score; the figure is the points it added to the 100-point composite (weight × sub-score).
- Cash flow +30.0/30.0
- 1% rule +10.0/10.0
- DSCR +10.0/10.0
- Appreciation +10.0/10.0
- ARV discount +7.5/15.0
- Livability +4.1/5.0
- Schools +2.8/10.0
- Rent growth +2.5/5.0
- Condition / age +2.5/5.0
$55,000
🖨 Deal sheet 📄 Offer letter ✓ Due diligence
Listing remarks MLS
2 Unit Dwelling - great for a small owner occupied or first investor - Lower unit occupied, $950 incl utilities, upper unit updated/vacant Being sold ''as is'' Cash only!
Key facts
- 4,356 sq ft lot
- 2 parking spots
- Built 1890
Neighborhood map
What this means for you Summary
Snapshot
- This is a 3-bed/1.0-bath single-family listed at $55k.
Deal economics
- At list price, monthly cash flow is $445 ($5k/yr) — positive.
- The deal already cash-flows at list — no discount required.
- Meets the 1% rule at list price ($2k rent vs $55k).
- Recommended offer: $53k (3.0% below list) — sets the bar for market timing.
- Cap rate 26.0% vs local median 8.7% in Gloversville — top-decile yield for the area; either an underpriced asset or a hidden risk that comps aren't pricing in. Stress-test before assuming the spread holds.
Location & tenants
- Location reads 82/100 on livability (#70 in NY, #1,048 nationally) — a professional / high-income tenant draw. Strengths: amenities A+, commute A+, cost of living A+; Watch: schools D, employment F.
- Gloversville City School District (town): math 26% / reading 42% proficiency, ranked #565 of 590 in NY (top 96%) — families likely to look elsewhere, expect single-tenant / working-renter base with shorter leases.
- Market conditions: 165 active listings in the ZIP; 1 comparable units currently listed for rent nearby; 112 units permitted in Fulton County in 2024 (50 in 5+ unit buildings).
Forward outlook
- In year one you build about $6k of equity ($380 loan paydown + $6k appreciation (10.0% local appreciation)).
- Fulton County population projected at -23% by 2050 — secular population decline; favor cash flow + early exit over multi-decade hold.
- At projected returns (10.0% appreciation + 3.0% rent growth), your $15k cash investment doubles in ~2 years — after that, you're playing with house money.
- By year 6, paydown + projected appreciation supports a ~$35k cash-out refi (75% LTV) — recoverable capital for the next deal without selling this one.
Negotiation context
- It's been on market 58 days — a 3% lower offer ($53k) is reasonable based on typical stale-listing flexibility.
- Current owner paid $10k; list at $55k implies a 450% gain — meaningful room to come down on a strong offer.
Risks & watch-outs
- Watch-outs: flood insurance adds $460/mo; built in 1890 — expect roof / HVAC / electrical / plumbing capex.
- Climate carrying-cost: in FEMA flood zone AE (mandatory federal flood insurance) — expect insurance premiums to compound above CPI over the hold.
Questions for the listing agent
- It's been on market 58 days. Have you received any prior offers? Is the seller open to a 3% concession, seller financing, or rate buy-down credit?
- Built in 1890 — when were the roof, HVAC, electrical panel, plumbing, and water heater last replaced?
- What's the actual annual flood-insurance premium (NFIP or private), and is the property in a SFHA with mandatory coverage?
- Is there a deadline driving the sale (1031 exchange, divorce, estate, relocation)? That informs how much negotiation room exists.
- Schools are D-rated, which usually means shorter tenancies and higher turnover. Who's the typical renter profile here, and what's been the actual vacancy rate?
- What's the average days-on-market for RENTAL listings here right now (not sales)? A rising rental-DOM trend means longer vacancies and softer asking-rent achievability than the comps imply.
- What's the recent tenant-quality profile in this submarket — average credit score on applications, eviction rate, late-payment / NSF rate, and stable-employment percentage? A property-management company in the area should have these aggregated.
- How much new for-sale + rental construction is in the pipeline within 1–3 miles? Heavy new supply typically softens prices + rents 12–24 months out; constrained supply supports both.
Investment metrics
- 1% rule
- 3.00% ✓
- Cap rate
- 26.05%
- Cash-on-cash
- 70.55%
- DSCR
- 4.14
- GRM
- 2.8
CMA / ARV
- ARV (median comp)
- $167,700
- List price
- $55,000
- Delta
- -67.20%
- Verdict
- UNDERPRICED
- Comps
- 20 within 1.0 mi
Show comp detail 12 sales within ~0.75 mi
| Address | Dist | Beds/Ba | Sqft | Sold | Price | $/sf | Match |
|---|---|---|---|---|---|---|---|
| 44 W 8th Ave | 0.28mi | 3/1.5 | 1,408 (+2%) | 5mo | $141,000 | $100 | 77 |
| 6 Highland Ter | 0.30mi | 3/1.0 | 1,300 (-6%) | 6mo | $176,900 | $136 | 72 |
| 7 N Mcnab Ave | 0.32mi | 3/1.0 | 1,434 (+4%) | 11mo | $160,000 | $112 | 68 |
| 108 Yale St | 0.48mi | 4/1.5 (+1) | 1,410 (+2%) | 2mo | $185,394 | $131 | 65 |
| 177 N Arlington Ave | 0.02mi | 2/1.5 (-1) | 1,202 (-13%) | 13mo | $37,000 | $31 | 60 |
| 62 3rd Ave | 0.54mi | 3/2.0 | 1,209 (-12%) | 3mo | $135,000 | $112 | 48 |
| 50 Summer St | 0.68mi | 2/1.0 (-1) | 1,470 (+7%) | 6mo | $110,000 | $75 | 47 |
| 32 W 12th Ave | 0.57mi | 4/1.5 (+1) | 1,530 (+11%) | 6mo | $200,000 | $131 | 43 |
| 72 3rd Ave | 0.57mi | 3/2.5 | 1,504 (+9%) | 12mo | $179,000 | $119 | 42 |
| 3 State Cir | 0.67mi | 3/1.0 | 1,189 (-14%) | 6mo | $219,000 | $184 | 41 |
| 56 W State St | 0.70mi | 3/1.0 | 1,172 (-15%) | 6mo | $195,000 | $166 | 38 |
| 86 W State St | 0.70mi | 2/1.0 (-1) | 1,548 (+12%) | 12mo | $180,000 | $116 | 32 |
Match score weights: distance 35% · size 25% · config 20% · recency 20%. Top-matched comps best support the ARV.
Projected returns pro-forma
10.0% appreciation · 3.0% rent growth · sell at horizon
- IRR
- 51.0%
- Equity multiple
- 4.81×
- Total profit
- $58,612
- Equity at exit
- $49,548
- IRR
- 44.8%
- Equity multiple
- 10.80×
- Total profit
- $150,951
- Equity at exit
- $106,853
Cash invested: $15,400 (down + closing). Projections, not guarantees.
Landlord ↔ Tenant lean methodology
- Overall (STATE)
- 15 Strongly Tenant-Friendly
- State New York
- 15 Strongly Tenant-Friendly · D+10
- County
- — inherits STATE
- City
- — inherits STATE
ZIP-level market 12078
- Home prices YoY
- 12.2%
- Active inventory
- 165
- Price-to-rent
- 2.8×
Monthly cashflow live
- Estimated rent
- $1,650 medium interval (Pro) →
- Mortgage (P&I)
- −$288
- Tax from tax record
- −$87 /mo · $1,042/yr
- Insurance
- −$23
- Flood insurance flood zone
- −$460 /mo · $5,525/yr
- HOA
- −$0
- Vacancy / Maint / Mgmt
- −$346
- Net cashflow
- $445
Break-even live
UW: 25.0% down · 7.5% · 30yr · 1.5% tax · 5.0% vac · 8.0% maint · 8.0% mgmt
Financing live
Cash to close
- Down payment
- $13,750
- Closing costs
- $1,650
- Reserves months
- —
- Total cash needed
- —
Loan-product check · same deal, 3 products live
Conventional
25% down · 7.5% · 30yr
- Down + closing
- —
- Monthly P&I
- —
- Monthly cashflow
- —
- DSCR
- —
- Eligible?
- —
Personal DTI + credit; lowest rate.
DSCR
20% down · 8.5% · 30yr
- Down + closing
- —
- Monthly P&I
- —
- Monthly cashflow
- —
- DSCR
- —
- Eligible?
- —
No personal income docs; deal must DSCR.
Hard money
10% down · 12.0% · 12mo
- Down + closing
- —
- Monthly P&I
- —
- Monthly cashflow
- —
- DSCR
- —
- Eligible?
- —
Short-term bridge; refi at stabilization.
Rent comps 1 comps
| Address | Beds | Baths | Sqft | Rent | $/sqft | DOM | Units | Dist |
|---|---|---|---|---|---|---|---|---|
| 11 Fremont St Gloversville, NY | 2.0–3.0 | 1.5–2.0 | 1612 | $1,650 | $1.02 | 44d | 3 | 0.51mi |
Listing history 5 events
-
2026-05-13status Pending 170-char remark
Show marketing remark (170 chars)
2 Unit Dwelling - great for a small owner occupied or first investor - Lower unit occupied, $950 incl utilities, upper unit updated/vacant Being sold ''as is'' Cash only!
-
2026-05-09price $55,000 170-char remark
Show marketing remark (170 chars)
2 Unit Dwelling - great for a small owner occupied or first investor - Lower unit occupied, $950 incl utilities, upper unit updated/vacant Being sold ''as is'' Cash only!
-
2026-04-06price $65,000 170-char remark
Show marketing remark (170 chars)
2 Unit Dwelling - great for a small owner occupied or first investor - Lower unit occupied, $950 incl utilities, upper unit updated/vacant Being sold ''as is'' Cash only!
-
2026-03-13$75,000 Active 170-char remark
Show marketing remark (170 chars)
2 Unit Dwelling - great for a small owner occupied or first investor - Lower unit occupied, $950 incl utilities, upper unit updated/vacant Being sold ''as is'' Cash only!
-
2001-09-10soldstatus $10,000
ⓘ Source: listings_history table (triggers on properties + properties_extension) + one-shot
backfill from property_details.listing_events for pre-trigger history.
Tax reassessment forecast NY · Partial reset (capped growth)
- Current annual tax
- $1,042 · $87/mo
- Projected year-2 tax
- $1,042 · $87/mo
- Expected delta
- $0/yr ($0/mo · 0.0%)
ⓘ Screening estimate from a state-policy table — verify with the county assessor before closing.
Climate risk First Street
- Flood 9/10 Extreme FEMA zone AE · 99% chance over 30 yrs
- Wildfire 1/10 Low
- Heat 2/10 Low 7 d/yr ≥93°F today · 16 d/yr by 30 yrs out
- Wind 2/10 Low 3% chance of damaging wind over 30 yrs
- Air quality 1/10 Low 0 unhealthy d/yr today · 0 by 30 yrs out
Nearby sold comps map
Loading sold comps map…
Walkable amenities ~0.75 mi
Loading nearby amenities…
Taxation est. · year 1
- Rental income
- $19,800
- − Mortgage interest
- −$3,081
- − Property taxes
- −$1,042
- − Insurance
- −$5,800
- − Repairs & maintenance
- −$1,584
- − Management
- −$1,584
- − Depreciation
- −$1,600
- Taxable income
- $5,110
- Est. tax owed @ 24.0%
- −$1,226
- After-tax cash flow
- $4,113/yr
For passive investors: Depreciation is non-cash, so a rental often shows a tax loss while cash-flowing — sheltering income. Rental losses are passive: they offset passive income freely, and up to $25,000/yr can offset ordinary (W-2) income if you actively participate and your MAGI is under $100k (phasing out to $0 by $150k); unused losses carry forward. On sale, claimed depreciation is recaptured at up to 25%, and gains may owe capital-gains tax (a 1031 exchange can defer both). Figures are a year-1 estimate at your 24.0% rate — not tax advice; consult a CPA.
Schools (NCES district)
- District
- Gloversville City School District
- NCES district ID
- 3612270
- Math proficiency
- 26% ▼ -6.00%
- Reading proficiency
- 42% ▲ 7.00%
- Median HH income
- $36,775
- Composite
- 28.2/100
- National rank
- #6806
- State rank
- #565 of 590 in NY
Livability — Gloversville
- Score
- 82/100
- State rank
- #70
- US rank
- #1048
Category grades
Schools grade is shown separately in the Schools card above.
Census & demographics
- Census place
- Gloversville, NY
- Population (ZIP)
- 23,087
Population outlook (Fulton County) Hauer SSP2
- Today (2025)
- 51,132 people
- By 2030
- 49,114 · -3.9%
- By 2040
- 44,373 · -13.2%
- By 2050
- 39,321 · -23.1%
- By 2075
- 28,503 · -44.3%
- By 2100
- 19,268 · -62.3%
Race, ethnicity, and origin ACS 2023
- Neighborhood character
- Predominantly White (86%)
- Race & ethnicity
- White 86% Two or more races 8% Hispanic / Latino 5% Black 2% Asian 1%
- Hispanic origin (detail)
- Puerto Rican 3%
- Common ancestry
- Lithuanian 5% Romanian 4% Iranian 4%
- Foreign-born
- 2% · Canada, China
- Languages at home
- 97% English-only · Spanish 2%
Political lean MEDSL · Fulton
- 2024 margin
- Solid R (+35.9) · D 32.1% · R 67.9%
- 2008→2024 swing
- -26.6pp toward R · 2008: -9.2pp · 2024: -35.9pp
- All cycles
- 2024: R+35.9 2020: R+31.4 2016: R+35.5 2012: R+10.5 2008: R+9.2
Not yet ingested
- Civics
- —
Market trends
- HPI YoY
- ▲ 34.22%
- Current HPI
- 315.1368
- Rent YoY
- —
- Metro
- —
- State GDP YoY
- ▲ 2.60%
- F500 in state
- 92
Industry mix (Fortune 500 HQ in NY)
| Industry | F500 HQs | Revenue |
|---|---|---|
| Financial Services | 10 | $950B |
|
||
| Consumer Goods | 9 | $162B |
|
||
| Insurance | 4 | $225B |
|
||
| Telecommunications | 2 | $144B |
|
||
| Pharmaceuticals | 2 | $112B |
|
||
| Media / Entertainment | 2 | $69B |
|
||
Price history
+450.0% since first listed5 events — show timeline
- 2026-05-13 Pending — Global MLS
- 2026-05-09 Price Changed $55,000 Global MLS
- 2026-04-06 Price Changed $65,000 Global MLS
- 2026-03-13 Listed $75,000 Global MLS
- 2001-09-10 Sold (Public Records) $10,000 Public Records
Property tax history
+0.9%/yrLatest (2025): $1,042 · +3.4% YoY. Source: county tax records.
Cash-flow waterfall
monthlySold comps — $/sqft
last 12 mo · ≤1 miLoading sold comps…