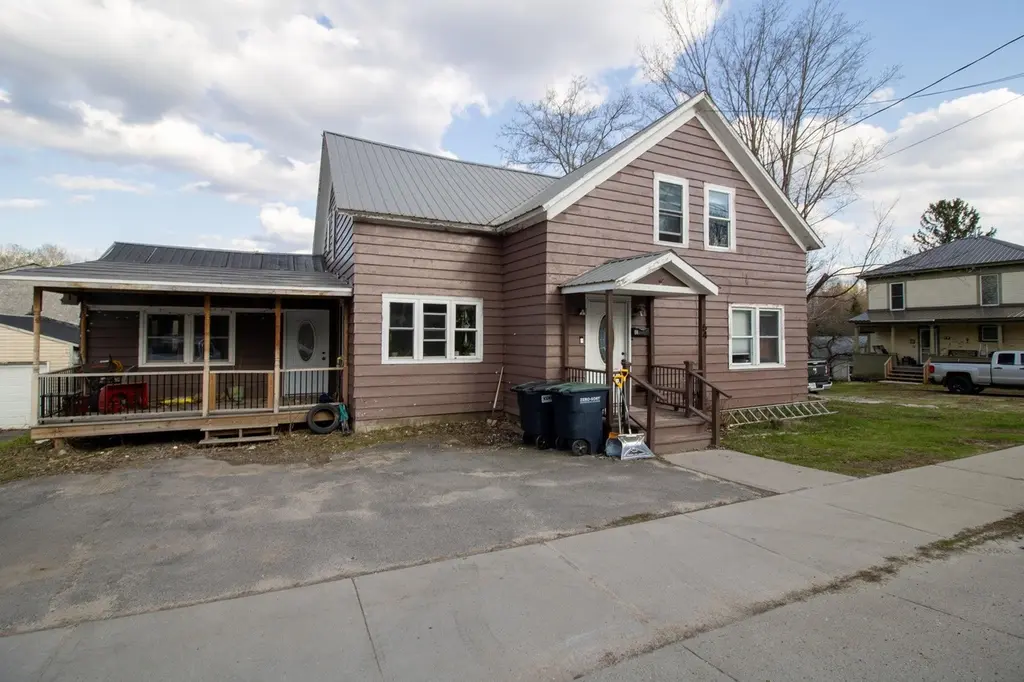
64 North Main St · Norwood, NY
Flood risk 1/10 · Minimal
- FEMA flood zone
- X
- Chance of flooding over 30 yrs
- 0.0%
- Est. flood insurance / yr
- $473 – $860
Fire risk 2/10 · Minimal
- Est. fire insurance / yr
- $691 – $1,283
Heat risk 2/10 · Minimal
- Hot days now (above 93°F)
- 7 days/yr
- Hot days in 30 yrs
- 15 days/yr
Wind risk 1/10 · Minimal
- Chance of severe wind over 30 yrs
- —
Air-quality risk 1/10 · Minimal
- Unhealthy air days now
- 0 days/yr
- Unhealthy air days in 30 yrs
- 0 days/yr
Risk factors via First Street. Map © Google.
Why this score? — see what drove the C grade
The composite is a weighted blend of 9 inputs, each scored 0–100. Each bar is that input's sub-score; the figure is the points it added to the 100-point composite (weight × sub-score).
- Cash flow +15.4/30.0
- ARV discount +15.0/15.0
- Appreciation +6.8/10.0
- 1% rule +5.9/10.0
- DSCR +4.7/10.0
- Livability +3.4/5.0
- Schools +2.8/10.0
- Rent growth +2.5/5.0
- Condition / age +2.5/5.0
$125,000
🖨 Deal sheet 📄 Offer letter ✓ Due diligence
Listing remarks
Charming 4-bedroom home in the Village of Norwood with a first-floor bedroom and bathroom and an oversized backyard! Starting with a welcoming entryway that opens into the bright living room with hardwood floors and natural light that continues through the dining room. There, a sliding glass door provides access to the back porch, which overlooks an expansive fenced-in yard. The gallery kitchen creates a cohesive layout leading to the family room addition. This additional family room is nothing short of grand, a true highlight of the home. Plus, the first floor also has an extra-large laundry room, a bedroom, and a bathroom. The second floor hosts three generously sized bedrooms and an addi
Key facts
- First floor bathroom
- Gallery kitchen
- Family room addition
Tags
Property features AI
Exterior
- Utilities: Public water; Public sewer; Cable available; Natural gas available
- Home design: Residential property; 2 stories
- Construction: Wood siding
- Exterior features: Covered patio/porch; Deck; Porch; Fenced yard; Metal roof
Interior
- Kitchen: Gas cooktop; Dishwasher; Refrigerator
- Bedrooms: Total rooms: 10
- Flooring: Hardwood; Wood
- Bathrooms: 1 full bathroom; 1 half bathroom
- Heating & cooling: Forced air heating; Natural gas
- Interior features: Walk-in closet(s); Entrance foyer; Basement
- Laundry & utility: Washer; Dryer; Laundry on main level; Gas water heater
Neighborhood map
What this means for you Summary
Snapshot
- This is a 5-bed/1.5-bath single-family listed at $125k.
Deal economics
- At list price, monthly cash flow is $49 ($585/yr) — positive.
- The deal already cash-flows at list — no discount required.
- Meets the 1% rule at list price ($1k rent vs $125k).
Location & tenants
- Location reads 68/100 on livability (#541 in NY) — a middle-class / working-renter tenant base. Strengths: cost of living A+, housing A+, crime A-; Watch: health & safety C-, schools D+, amenities F.
- Norwood-Norfolk Central School District (rural): math 30% / reading 36% proficiency, ranked #568 of 590 in NY (top 96%) — families likely to look elsewhere, expect single-tenant / working-renter base with shorter leases.
- Market conditions: 26 active listings in the ZIP; 215 units permitted in St. Lawrence County in 2024 (0 in 5+ unit buildings).
Forward outlook
- In year one you build about $5k of equity ($864 loan paydown + $4k appreciation (3.6% local appreciation)).
- St. Lawrence County population projected at -14% by 2050 — secular population decline; favor cash flow + early exit over multi-decade hold.
- At projected returns (3.6% appreciation + 3.0% rent growth), your $35k cash investment doubles in ~6 years — after that, you're playing with house money.
- By year 7, paydown + projected appreciation supports a ~$34k cash-out refi (75% LTV) — recoverable capital for the next deal without selling this one.
Negotiation context
- Only 13 days on market — expect competitive offers; lowballing is unlikely to land.
- 7 sale attempts since 11y ago with the ask held roughly flat each time — persistent listings suggest the price (not the market) is what's stuck; bring a comps-based counter.
- Current owner paid $83k; list at $125k implies a 51% gain — meaningful room to come down on a strong offer.
Risks & watch-outs
- Watch-outs: property tax is 3.1% of price; built in 1930 — expect roof / HVAC / electrical / plumbing capex.
Questions for the listing agent
- Built in 1930 — when were the roof, HVAC, electrical panel, plumbing, and water heater last replaced?
- Property tax is high relative to price — has the assessment been appealed recently, and will the sale trigger a re-assessment?
- Is there a deadline driving the sale (1031 exchange, divorce, estate, relocation)? That informs how much negotiation room exists.
- Schools are D-rated, which usually means shorter tenancies and higher turnover. Who's the typical renter profile here, and what's been the actual vacancy rate?
- What's the average days-on-market for RENTAL listings here right now (not sales)? A rising rental-DOM trend means longer vacancies and softer asking-rent achievability than the comps imply.
- What's the recent tenant-quality profile in this submarket — average credit score on applications, eviction rate, late-payment / NSF rate, and stable-employment percentage? A property-management company in the area should have these aggregated.
- How much new for-sale + rental construction is in the pipeline within 1–3 miles? Heavy new supply typically softens prices + rents 12–24 months out; constrained supply supports both.
Investment metrics
- 1% rule
- 1.09% ✓
- Cap rate
- 6.76%
- Cash-on-cash
- 1.67%
- DSCR
- 1.07
- GRM
- 7.7
CMA / ARV
- ARV (median comp)
- $155,121
- List price
- $125,000
- Delta
- -19.42%
- Verdict
- UNDERPRICED
- Comps
- 20 within 1.0 mi
Projected returns pro-forma
3.6% appreciation · 3.0% rent growth · sell at horizon
- IRR
- 10.7%
- Equity multiple
- 1.64×
- Total profit
- $22,286
- Equity at exit
- $60,466
- IRR
- 12.7%
- Equity multiple
- 3.01×
- Total profit
- $70,339
- Equity at exit
- $96,643
Cash invested: $35,000 (down + closing). Projections, not guarantees.
Landlord ↔ Tenant lean methodology
- Overall (STATE)
- 15 Strongly Tenant-Friendly
- State New York
- 15 Strongly Tenant-Friendly · D+10
- County
- — inherits STATE
- City
- — inherits STATE
ZIP-level market 13668
- Home prices YoY
- 1.1%
- Active inventory
- 26
- Price-to-rent
- 7.7×
Monthly cashflow live
- Estimated rent
- $1,361 medium interval (Pro) →
- Mortgage (P&I)
- −$656
- Tax from tax record
- −$319 /mo · $3,828/yr
- Insurance
- −$52
- HOA
- −$0
- Vacancy / Maint / Mgmt
- −$286
- Net cashflow
- $49
Break-even live
UW: 25.0% down · 7.5% · 30yr · 1.5% tax · 5.0% vac · 8.0% maint · 8.0% mgmt
Financing live
Cash to close
- Down payment
- $31,250
- Closing costs
- $3,750
- Reserves months
- —
- Total cash needed
- —
Loan-product check · same deal, 3 products live
Conventional
25% down · 7.5% · 30yr
- Down + closing
- —
- Monthly P&I
- —
- Monthly cashflow
- —
- DSCR
- —
- Eligible?
- —
Personal DTI + credit; lowest rate.
DSCR
20% down · 8.5% · 30yr
- Down + closing
- —
- Monthly P&I
- —
- Monthly cashflow
- —
- DSCR
- —
- Eligible?
- —
No personal income docs; deal must DSCR.
Hard money
10% down · 12.0% · 12mo
- Down + closing
- —
- Monthly P&I
- —
- Monthly cashflow
- —
- DSCR
- —
- Eligible?
- —
Short-term bridge; refi at stabilization.
Listing history 20 events
-
2026-05-07status Pending 785-char remark
-
2026-04-24$125,000 Active 785-char remark
-
2025-11-14price $95,000
-
2025-09-23price $110,000
-
2025-09-19status Active
-
2025-09-13status Pending
-
2025-08-29price $115,000
-
2025-08-19price $120,000
-
2025-08-09$122,000 Active
-
2025-04-06status Active
-
2025-02-25$129,000 Active
-
2022-04-21soldstatus $83,000
-
2022-04-21soldstatus $83,000
-
2021-11-08$90,000
-
2016-04-14soldstatus $73,000
-
2016-04-14soldstatus $73,000
-
2015-12-14$77,500
-
2004-04-19soldstatus $48,500
-
1999-12-23soldstatus $40,000
-
1993-09-07soldstatus $35,000
ⓘ Source: listings_history table (triggers on properties + properties_extension) + one-shot
backfill from property_details.listing_events for pre-trigger history.
Tax reassessment forecast NY · Partial reset (capped growth)
- Current annual tax
- $3,828 · $319/mo
- Projected year-2 tax
- $3,828 · $319/mo
- Expected delta
- $0/yr ($0/mo · 0.0%)
ⓘ Screening estimate from a state-policy table — verify with the county assessor before closing.
Climate risk First Street
- Flood 1/10 Low FEMA zone X · 0% chance over 30 yrs
- Wildfire 2/10 Low
- Heat 2/10 Low 7 d/yr ≥93°F today · 15 d/yr by 30 yrs out
- Wind 1/10 Low
- Air quality 1/10 Low 0 unhealthy d/yr today · 0 by 30 yrs out
Nearby sold comps map
Loading sold comps map…
Walkable amenities ~0.75 mi
Loading nearby amenities…
Taxation est. · year 1
- Rental income
- $16,334
- − Mortgage interest
- −$7,002
- − Property taxes
- −$3,828
- − Insurance
- −$625
- − Repairs & maintenance
- −$1,307
- − Management
- −$1,307
- − Depreciation
- −$3,636
- Taxable loss
- −$1,371
- Est. tax savings @ 24.0%
- +$329
- After-tax cash flow
- $914/yr
For passive investors: Depreciation is non-cash, so a rental often shows a tax loss while cash-flowing — sheltering income. Rental losses are passive: they offset passive income freely, and up to $25,000/yr can offset ordinary (W-2) income if you actively participate and your MAGI is under $100k (phasing out to $0 by $150k); unused losses carry forward. On sale, claimed depreciation is recaptured at up to 25%, and gains may owe capital-gains tax (a 1031 exchange can defer both). Figures are a year-1 estimate at your 24.0% rate — not tax advice; consult a CPA.
Schools (NCES district)
- District
- Norwood-Norfolk Central School District
- NCES district ID
- 3621360
- Math proficiency
- 30% ▼ -8.00%
- Reading proficiency
- 36% ▼ -4.00%
- Median HH income
- $43,492
- Composite
- 28.05/100
- National rank
- #6841
- State rank
- #568 of 590 in NY
Livability — Norwood
- Score
- 68/100
- State rank
- #541
- US rank
- #9728
Category grades
Schools grade is shown separately in the Schools card above.
Census & demographics
- Census place
- Norwood, NY
- City population
- 3,313
- Population (ZIP)
- 3,313
Population outlook (St. Lawrence County) Hauer SSP2
- Today (2025)
- 110,027 people
- By 2030
- 107,455 · -2.3%
- By 2040
- 100,492 · -8.7%
- By 2050
- 94,254 · -14.3%
- By 2075
- 80,175 · -27.1%
- By 2100
- 63,140 · -42.6%
Race, ethnicity, and origin ACS 2023
- Neighborhood character
- Predominantly White (95%)
- Race & ethnicity
- White 95% Two or more races 3% Hispanic / Latino 2%
- Common ancestry
- Lithuanian 13% Portuguese 2% Slovak 2%
- Foreign-born
- 1% · Canada
- Languages at home
- 99% English-only · French/Haitian/Cajun 1%
Political lean MEDSL · St. Lawrence
- 2024 margin
- R (+18.0) · D 41.0% · R 59.0%
- 2008→2024 swing
- -34.3pp toward R · 2008: 16.3pp · 2024: -18.0pp
- All cycles
- 2024: R+18.0 2020: R+11.7 2016: R+10.8 2012: D+16.6 2008: D+16.3
Not yet ingested
- Civics
- —
Market trends
- HPI YoY
- ▲ 3.60%
- Current HPI
- 318.2533
- Rent YoY
- —
- Metro
- —
- State GDP YoY
- ▲ 2.60%
- F500 in state
- 92
Industry mix (Fortune 500 HQ in NY)
| Industry | F500 HQs | Revenue |
|---|---|---|
| Financial Services | 10 | $950B |
|
||
| Consumer Goods | 9 | $162B |
|
||
| Insurance | 4 | $225B |
|
||
| Telecommunications | 2 | $144B |
|
||
| Pharmaceuticals | 2 | $112B |
|
||
| Media / Entertainment | 2 | $69B |
|
||
Price history
+257.1% since first listed20 events — show timeline
- 2026-05-07 Pending — SLCMLS
- 2026-04-24 Listed $125,000 SLCMLS
- 2025-11-14 Price Changed $95,000 SLCMLS
- 2025-09-23 Price Changed $110,000 SLCMLS
- 2025-09-19 Relisted — SLCMLS
- 2025-09-13 Pending — SLCMLS
- 2025-08-29 Price Changed $115,000 SLCMLS
- 2025-08-19 Price Changed $120,000 SLCMLS
- 2025-08-09 Listed $122,000 SLCMLS
- 2025-04-06 Relisted — SLCMLS
- 2025-02-25 Listed $129,000 SLCMLS
- 2022-04-21 Sold (Public Records) $83,000 Public Records
- 2022-04-21 Sold (MLS) $83,000 SLCMLS
- 2021-11-08 Listed $90,000 SLCMLS
- 2016-04-14 Sold (Public Records) $73,000 Public Records
- 2016-04-14 Sold (MLS) $73,000 SLCMLS
- 2015-12-14 Listed $77,500 SLCMLS
- 2004-04-19 Sold (Public Records) $48,500 Public Records
- 1999-12-23 Sold (Public Records) $40,000 Public Records
- 1993-09-07 Sold (Public Records) $35,000 Public Records
Property tax history
+6.2%/yrLatest (2025): $3,828 · -10.1% YoY. Source: county tax records.
Cash-flow waterfall
monthlySold comps — $/sqft
last 12 mo · ≤1 miLoading sold comps…