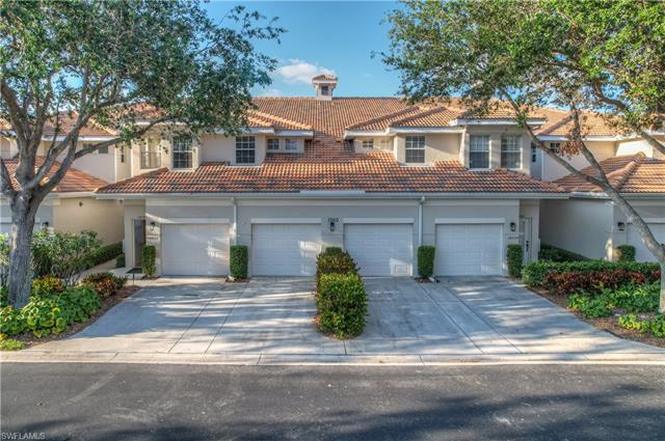
3060 Horizon Ln #1404 · Pelican Marsh, FL
Flood risk 3/10 · Minor
- FEMA flood zone
- X (unshaded)
- Chance of flooding over 30 yrs
- 0.1%
- Est. flood insurance / yr
- $507 – $1,088
Fire risk 1/10 · Minimal
- Est. fire insurance / yr
- $947 – $1,759
Heat risk 10/10 · Severe
- Hot days now (above 107°F)
- 7 days/yr
- Hot days in 30 yrs
- 29 days/yr
Wind risk 10/10 · Severe
- Chance of severe wind over 30 yrs
- 99.0%
Air-quality risk 2/10 · Minimal
- Unhealthy air days now
- 2 days/yr
- Unhealthy air days in 30 yrs
- 2 days/yr
Risk factors via First Street. Map © Google.
Why this score? — see what drove the D grade
The composite is a weighted blend of 9 inputs, each scored 0–100. Each bar is that input's sub-score; the figure is the points it added to the 100-point composite (weight × sub-score).
- Cash flow +9.8/30.0
- ARV discount +7.5/15.0
- Appreciation +5.1/10.0
- Schools +5.0/10.0
- 1% rule +4.0/10.0
- DSCR +2.8/10.0
- Rent growth +2.7/5.0
- Livability +2.5/5.0
- Condition / age +2.5/5.0
$545,000
🖨 Deal sheet (PDF) 📄 Offer letter ✓ Due diligence
Listing remarks
Come and relax in a serene and well-appointed community. This second-floor carriage home is located in the beautiful Bridgewater Bay gated community. This inviting retreat offers three spacious bedrooms each furnished with a comfortable king-size bed. There are 2.5 bathrooms and the split floor plan provides privacy. The attached 1-car garage includes an additional small storage area. The lanai, which overlooks a scenic lake, is perfect for relaxing. Bridgewater Bay is nestled within 131 acres of preserves, 12 lakes, and lush landscaping, which adds to the overall beauty of the area. The resort-style pool, spa and lap pool, along with other amenities such as tennis, bocce, and fitness cente
Key facts
- Fitness center
- Resort style pool
- Scenic lake
Tags
Property features AI
Finance
- Other: Multi-unit building: 8 units in the building, 64 units in the complex; 2 units per floor; single-story
- HOA & community: Mandatory HOA; Quarterly HOA fees (master and association fees apply); Professional management; Maintenance covers cable, internet/WiFi access, irrigation water, lawn/land maintenance, legal/accounting, manager, recreation facilities, reserve, street lights, and street maintenance; Community amenities include clubhouse, community pool, spa/hot tub, exercise room, tennis, pickleball, bocce, basketball, play area, and sauna
Exterior
- Parking: Attached 1-car garage; 1 assigned parking space; Paved driveway
- Security: Gated community
- Utilities: Central water; Central sewer; Cable available
- Home design: Residential property in a low-rise (1–3) carriage/coach building; Built in 2001; Rear exposure faces north; Located in the Bridgewater Bay development (Turtle Bay sub-condo, lot/unit 1404)
- Construction: Concrete block construction
- Exterior features: Stucco exterior; Tile roof; Single-hung windows; Gated community; Lake view; Central irrigation; Zero lot line; Deeded restrictions (limited number vehicles, no commercial, no RV)
Interior
- Kitchen: Pantry; Electric cooktop; Range; Self-cleaning oven; Microwave; Disposal; Refrigerator/ice maker
- Bedrooms: 3 bedrooms — split bedroom layout
- Flooring: Laminate flooring; Tile flooring
- Bathrooms: 2 full bathrooms; 1 half bathroom; Master bath with dual sinks and a shower (no tub)
- Heating & cooling: Central electric heat; Central electric air conditioning; Ceiling fans
- Interior features: Built-in cabinets; Cable prewire; Fire sprinkler system; Foyer; High-speed internet available; Pantry; Smoke detectors; Vaulted ceiling; Walk-in closet; Window coverings; Great room; Screened lanai/porch; Turnkey (furnished)
- Laundry & utility: Washer and dryer included; Washer/dryer hookup; Laundry in residence; Auto garage door
Neighborhood map
What this means for you Summary
Snapshot
- This is a 3-bed/2.5-bath condo listed at $545k.
Deal economics
- At list price, monthly cash flow is $-347 ($-4k/yr) — negative.
- To cash-flow at today's rent, offer at most $484k (11.3% below list).
- To meet the 1% rule (rent ≥ 1% of price), the offer needs to be $490k (10.1% below list).
- Recommended offer: $480k (12.0% below list) — sets the bar for market timing.
Location & tenants
- Location reads: area grade D — affects rentability + tenant quality, not the cash-flow math above.
- Collier (suburban): math 60% / reading 56% proficiency, ranked #16 of 73 in FL (top 22%) — acceptable for families but not a draw, mixed tenant base, ~2y average lease.
- Zoned schools: Osceola Elementary School (math 78% / reading 74%, grade A, #198 of 2,144 statewide, top 10%, 621 students, 32% FRL); Pine Ridge Middle School (math 74% / reading 70%, grade A, #52 of 571 statewide, top 10%, 832 students, 31% FRL); Barron Collier High School (math 62% / reading 68%, grade B, #76 of 667 statewide, top 11%, 1,650 students, 26% FRL) — zoned schools average 30% FRL vs 55% district-wide (25 pts lower); this property's tenant base skews higher-income than the district average.
- Zoned-school proficiency averages 71% at this address vs 58% district-wide (+13 pts) — the actual schools serving this property are materially stronger than the Collier average implies; a family-tenant draw the district grade alone would hide.
- Market conditions: Rents flat; 424 active listings in the ZIP; 40 comparable units currently listed for rent nearby; rentals at typical pace (median 25d on market — plan ~3-4 weeks tenant-placement turnaround); solid renter incomes; 3,520 units permitted in Collier County in 2024 (959 in 5+ unit buildings).
- At $4,902/mo this rent would consume 64% of the median local household income ($92k/yr) (locally 1712% of renters already pay >50% of income on rent) — very limited rent-growth headroom before tenants either downsize or default.
Forward outlook
- In year one you build about $5k of equity ($4k loan paydown + $2k appreciation (0.3% local appreciation)).
- Collier County population projected at +30% by 2050 — long-run rental-demand tailwind backs the buy-and-hold thesis.
- By year 6, paydown + projected appreciation supports a ~$35k cash-out refi (75% LTV) — recoverable capital for the next deal without selling this one.
Negotiation context
- It's been on market 299 days — a 12% lower offer ($480k) is reasonable based on typical stale-listing flexibility.
- 5 sale attempts since 4y ago; this cycle's ask is 10381% above the opening price — seller raised mid-cycle; expect resistance to lowballs.
- Current owner paid $173k; list at $545k implies a 216% gain — meaningful room to come down on a strong offer.
Risks & watch-outs
- Climate carrying-cost: severe wind risk, 99% chance of damaging wind over 30y; extreme-heat days projected 7→29/yr by 2055 (HVAC capex compounding) — expect insurance premiums to compound above CPI over the hold.
Questions for the listing agent
- What do current leases actually rent for vs. the listed asking? Can we see a recent rent roll and the last 12 months of T-12 income?
- It's been on market 299 days. Have you received any prior offers? Is the seller open to a 12% concession, seller financing, or rate buy-down credit?
- What does the HOA fee cover, when was the last increase, and are there any pending special assessments or reserve-fund shortfalls?
- Any open or pending special assessments — roof, HVAC, plumbing, elevator, façade? What's the per-unit balance and payoff schedule, and is the seller paying it off at close or rolling it to the buyer?
- Why hasn't it sold? Are there any deal-killer items the seller is aware of (foundation, flood, title, zoning, code violations)?
- Is there a deadline driving the sale (1031 exchange, divorce, estate, relocation)? That informs how much negotiation room exists.
- The area grade is low — what's the realistic commute time and amenity access for the typical tenant pool here? Any planned neighborhood developments (good or bad) we should know about?
- What's the average days-on-market for RENTAL listings here right now (not sales)? A rising rental-DOM trend means longer vacancies and softer asking-rent achievability than the comps imply.
- What's the recent tenant-quality profile in this submarket — average credit score on applications, eviction rate, late-payment / NSF rate, and stable-employment percentage? A property-management company in the area should have these aggregated.
- How much new apartment / multifamily construction is in the pipeline within 1–3 miles? Heavy new supply (>2% of stock underway) typically softens rents 12–24 months out; light construction supports rent growth.
Investment metrics
- 1% rule
- 0.90% ✗
- Cap rate
- 5.53%
- Cash-on-cash
- -2.73%
- DSCR
- 0.88
- GRM
- 9.3
CMA / ARV
No comps found within radius.
Projected returns pro-forma
0.29% appreciation · 0.92% rent growth · sell at horizon
- IRR
- -5.6%
- Equity multiple
- 0.74×
- Total profit
- $-40,170
- Equity at exit
- $166,335
- IRR
- -1.3%
- Equity multiple
- 0.86×
- Total profit
- $-21,405
- Equity at exit
- $206,513
Cash invested: $152,600 (down + closing). Projections, not guarantees.
Landlord ↔ Tenant lean methodology
- Overall (STATE)
- 87 Strongly Landlord-Friendly
- State Florida
- 87 Strongly Landlord-Friendly · R+3
- County
- — inherits STATE
- City
- — inherits STATE
ZIP-level market 34109
- Home prices YoY
- 0.1%
- Rents YoY
- 0.9%
- Active inventory
- 424
- Price-to-rent
- 9.3×
Monthly cashflow live
- Estimated rent
- $4,902 high interval (Pro) →
- Mortgage (P&I)
- −$2,858
- Tax from tax record
- −$328 /mo · $3,935/yr
- Insurance
- −$227
- HOA
- −$807
- Vacancy / Maint / Mgmt
- −$1,029
- Net cashflow
- $-347
Break-even live
Sensitivity live
| Price | -10% $-39 | -5% $-193 | +0% $-347 | +5% $-502 | +10% $-656 |
|---|---|---|---|---|---|
| Rent | -10% $-735 | -5% $-541 | +0% $-347 | +5% $-154 | +10% $40 |
| Rate | -1.0pp $-73 | -0.5pp $-209 | base $-347 | +0.5pp $-489 | +1.0pp $-632 |
UW: 25.0% down · 7.5% · 30yr · 1.5% tax · 5.0% vac · 8.0% maint · 8.0% mgmt
Financing live
Cash to close
- Down payment
- $136,250
- Closing costs
- $16,350
- Reserves months
- —
- Total cash needed
- —
Loan-product check · same deal, 3 products live
Conventional
25% down · 7.5% · 30yr
- Down + closing
- —
- Monthly P&I
- —
- Monthly cashflow
- —
- DSCR
- —
- Eligible?
- —
Personal DTI + credit; lowest rate.
DSCR
20% down · 8.5% · 30yr
- Down + closing
- —
- Monthly P&I
- —
- Monthly cashflow
- —
- DSCR
- —
- Eligible?
- —
No personal income docs; deal must DSCR.
Hard money
10% down · 12.0% · 12mo
- Down + closing
- —
- Monthly P&I
- —
- Monthly cashflow
- —
- DSCR
- —
- Eligible?
- —
Short-term bridge; refi at stabilization.
Rent comps 40 comps
| Address | Beds | Baths | Sqft | Rent | $/sqft | DOM | Units | Dist |
|---|---|---|---|---|---|---|---|---|
| 3015 Horizon Ln #2702 Naples, FL | 3.0 | 2.0 | 1399 | $1,790 | $1.28 | 25d | 1 | 0.05mi |
| 3051 Horizon Ln #1803 Naples, FL | 2.0 | 2.0 | 1482 | $5,100 | $3.44 | 25d | 1 | 0.08mi |
| 3009 Driftwood Way #2802 Naples, FL | 3.0 | 2.0 | 1399 | $2,000 | $1.43 | 25d | 1 | 0.11mi |
| 3048 Horizon Ln #1104 Naples, FL | 3.0 | 2.5 | 1818 | $5,150 | $2.83 | 25d | 1 | 0.11mi |
| 3035 Horizon Ln #2206 Naples, FL | 2.0 | 2.0 | 1246 | $6,000 | $4.82 | 25d | 1 | 0.12mi |
| 3062 Driftwood Way #4301 Naples, FL | 3.0 | 2.0 | 1573 | $6,500 | $4.13 | 25d | 1 | 0.13mi |
| 2880 Citrus Lake Dr Unit Q201 Naples, FL | 3.0 | 2.0 | 1590 | $2,495 | $1.57 | 15d | 1 | 0.15mi |
| 3057 Driftwood Way #4004 Naples, FL | 3.0 | 2.5 | 1818 | $6,400 | $3.52 | 25d | 1 | 0.15mi |
| 3017 Driftwood Way #3001 Naples, FL | 3.0 | 2.0 | 1385 | $5,000 | $3.61 | 25d | 1 | 0.17mi |
| 2860 Citrus Lake Dr Unit R202 Naples, FL | 3.0 | 2.0 | 1590 | $5,000 | $3.14 | 25d | 1 | 0.19mi |
| 2860 Citrus Lake Dr Unit R-202 Naples, FL | 3.0 | 2.0 | 1590 | $5,000 | $3.14 | 15d | 1 | 0.19mi |
| 3296 Twilight Ln #6202 Naples, FL | 3.0 | 2.5 | 2133 | $6,500 | $3.05 | 15d | 1 | 0.19mi |
| 3049 Driftwood Way #3806 Naples, FL | 3.0 | 2.5 | 1818 | $4,700 | $2.59 | 25d | 1 | 0.21mi |
| 2885 Citrus Lake Dr Unit N103 Naples, FL | 2.0 | 2.0 | 1249 | $5,250 | $4.20 | 15d | 1 | 0.21mi |
| 3025 Driftwood Way #3203 Naples, FL | 2.0 | 2.0 | 1248 | $3,900 | $3.12 | 25d | 1 | 0.22mi |
| 3029 Driftwood Way #3303 Naples, FL | 2.0 | 2.0 | 1248 | $4,000 | $3.21 | 25d | 1 | 0.25mi |
| 3037 Driftwood Way #3505 Naples, FL | 2.0 | 2.0 | 1248 | $2,500 | $2.00 | 25d | 1 | 0.27mi |
| 2864 Mizzen Way Unit Y106 Naples, FL | 2.0 | 2.0 | 1350 | $5,200 | $3.85 | 15d | 1 | 0.29mi |
| 7030 Lone Oak Blvd Naples, FL | 3.0 | 2.0 | 1700 | $6,400 | $3.76 | 15d | 1 | 0.34mi |
| 2731 Citrus Lake Dr #202 Naples, FL | 2.0 | 2.0 | 1260 | $2,500 | $1.98 | 15d | 1 | 0.35mi |
| 2730 Sailors Way Naples, FL | 3.0 | 3.0 | 1700 | $9,000 | $5.29 | 25d | 1 | 0.36mi |
| 2711 Citrus Lake Dr Unit F305 Naples, FL | 3.0 | 2.0 | 1480 | $5,500 | $3.72 | 15d | 1 | 0.38mi |
| 2711 Citrus Lake Dr Unit F302 Naples, FL | 2.0 | 2.0 | 1272 | $4,500 | $3.54 | 15d | 1 | 0.38mi |
| 2835 Mizzen Way Naples, FL | 3.0 | 2.0 | 1641 | $2,900 | $1.77 | 25d | 1 | 0.40mi |
| 7699 Groves Rd Naples, FL | 3.0 | 2.0 | 2259 | $10,000 | $4.43 | 25d | 1 | 0.42mi |
| 2671 Citrus Lake Dr Unit E-201 Naples, FL | 3.0 | 2.0 | 1380 | $5,250 | $3.80 | 15d | 1 | 0.42mi |
| 2671 Citrus Lake Dr Unit E-303 Naples, FL | 2.0 | 2.0 | 1380 | $3,500 | $2.54 | 15d | 1 | 0.42mi |
| 7710 Ahoy Ave Naples, FL | 3.0 | 2.0 | 1580 | $2,950 | $1.87 | 25d | 1 | 0.43mi |
| 2476 Orchid Bay Dr Unit W201 Naples, FL | 3.0 | 2.0 | 1928 | $2,600 | $1.35 | 15d | 1 | 0.43mi |
| 2651 Citrus Lake Dr Unit D302 Naples, FL | 2.0 | 2.0 | 1250 | $5,000 | $4.00 | 15d | 1 | 0.46mi |
| 2516 Orchid Bay Dr #203 Naples, FL | 2.0 | 2.0 | 1360 | $4,750 | $3.49 | 25d | 1 | 0.47mi |
| 2729 Branch Ln Naples, FL | 3.0 | 2.0 | 1800 | $3,650 | $2.03 | 25d | 1 | 0.48mi |
| 3664 El Segundo Ct Naples, FL | 2.0 | 2.0 | 1680 | $5,500 | $3.27 | 25d | 1 | 0.49mi |
| 7720 Gardner Dr #201 Naples, FL | 3.0 | 3.0 | 1960 | $5,500 | $2.81 | 25d | 1 | 0.49mi |
| 2611 Citrus Lake Dr Unit C-203 Naples, FL | 3.0 | 2.0 | 1710 | $5,500 | $3.22 | 15d | 1 | 0.50mi |
| 3687 El Segundo Ct Naples, FL | 2.0 | 2.0 | 1680 | $5,000 | $2.98 | 25d | 1 | 0.53mi |
| 7762 Gardner Dr #102 Naples, FL | 2.0 | 2.0 | 1607 | $6,000 | $3.73 | 25d | 1 | 0.56mi |
| 7518 Silver Trumpet Ln Unit Q102 Naples, FL | 2.0 | 2.0 | 1300 | $2,600 | $2.00 | 15d | 1 | 0.56mi |
| 2608 Sailors Way #122 Naples, FL | 2.0 | 2.0 | 1387 | $5,500 | $3.97 | 25d | 1 | 0.57mi |
| 2541 Citrus Lake Dr Unit A-205 Naples, FL | 3.0 | 2.0 | 1590 | $5,250 | $3.30 | 15d | 1 | 0.57mi |
HOA detail condo
- Monthly dues
- $807 · $9,684/yr
- Likely covers
- waterlandscapingpoolsecurity
- Assessments
- None detected in remarks — confirm with the listing agent.
Listing history 26 events
-
2026-06-22days on market $545,000 Active 299 DOM
-
2026-06-18days on market $545,000 Active 296 DOM
-
2026-06-17days on market $545,000 Active 295 DOM
-
2026-06-16days on market $545,000 Active 294 DOM
-
2026-06-15days on market $545,000 Active 293 DOM
-
2026-06-10days on market $545,000 Active 288 DOM
-
2026-06-09days on market $545,000 Active 287 DOM
-
2026-06-08days on market $545,000 Active 286 DOM
-
2026-06-07days on market $545,000 Active 285 DOM
-
2026-06-02days on market $545,000 Active 280 DOM
-
2026-06-01days on market $545,000 Active 279 DOM
-
2026-05-31days on market $545,000 Active 278 DOM
-
2026-05-30days on market $545,000 Active 277 DOM
-
2026-03-11price $545,000
-
2026-01-08$5,200
-
2026-01-08historical $5,200
-
2025-11-13price $570,000
-
2025-10-31price $5,200
-
2025-08-26$590,000 Active
-
2025-06-01$6,000
-
2025-06-01historical $6,000
-
2024-11-14$6,000
-
2023-10-03historical
-
2023-04-05price $615,000
-
2022-12-05$629,000 Active
-
2002-01-08soldstatus $172,600
ⓘ Source: listings_history table (triggers on properties + properties_extension) + one-shot
backfill from property_details.listing_events for pre-trigger history.
Tax reassessment forecast FL · Resets to sale price
- Current annual tax
- $3,935 · $328/mo
- Projected year-2 tax
- $4,524 · $377/mo
- Expected delta
- +$589/yr (+$49/mo · 15.0%)
ⓘ Screening estimate from a state-policy table — verify with the county assessor before closing.
Climate risk First Street
- Flood 3/10 Moderate FEMA zone X (unshaded) · 10% chance over 30 yrs
- Wildfire 1/10 Low
- Heat 10/10 Extreme 7 d/yr ≥107°F today · 29 d/yr by 30 yrs out
- Wind 10/10 Extreme 99% chance of damaging wind over 30 yrs
- Air quality 2/10 Low 2 unhealthy d/yr today · 2 by 30 yrs out
Nearby sold comps map
Loading sold comps map…
Walkable amenities ~0.75 mi
Loading nearby amenities…
Taxation est. · year 1
- Rental income
- $58,824
- − Mortgage interest
- −$30,528
- − Property taxes
- −$3,935
- − Insurance
- −$2,725
- − Repairs & maintenance
- −$4,706
- − Management
- −$4,706
- − HOA
- −$9,684
- − Depreciation
- −$15,855
- Taxable loss
- −$13,314
- Est. tax savings @ 24.0%
- +$3,195
- After-tax cash flow
- $-974/yr
For passive investors: Depreciation is non-cash, so a rental often shows a tax loss while cash-flowing — sheltering income. Rental losses are passive: they offset passive income freely, and up to $25,000/yr can offset ordinary (W-2) income if you actively participate and your MAGI is under $100k (phasing out to $0 by $150k); unused losses carry forward. On sale, claimed depreciation is recaptured at up to 25%, and gains may owe capital-gains tax (a 1031 exchange can defer both). Figures are a year-1 estimate at your 24.0% rate — not tax advice; consult a CPA.
Schools (NCES district)
- District
- Collier
- NCES district ID
- 1200330
- Math proficiency
- 60% ▼ -4.00%
- Reading proficiency
- 56% ▼ -2.00%
- Median HH income
- $58,275
- Composite
- 50.23/100
- National rank
- #1892
- State rank
- #16 of 73 in FL
Livability — Pelican Marsh
No livability data for this city. (Only ~50 U.S. cities are tracked.)
Census & demographics
- County
- Collier County · 396,295 people
- Metro
- Naples-Marco Island, FL
- Population (ZIP)
- 27,273
- Household income
- $92,259
- Rent vs Own
- Severe rent burden
- 1712.0
Population outlook (Collier County) Hauer SSP2
- Today (2025)
- 420,858 people
- By 2030
- 450,054 · +6.9%
- By 2040
- 502,232 · +19.3%
- By 2050
- 544,932 · +29.5%
- By 2075
- 627,203 · +49.0%
- By 2100
- 659,015 · +56.6%
Race, ethnicity, and origin ACS 2023
- Neighborhood character
- Predominantly White (78%)
- Race & ethnicity
- White 78% Hispanic / Latino 11% Two or more races 9% Black 4% Asian 4%
- Hispanic origin (detail)
- Mexican 1% Puerto Rican 1% Cuban 3%
- Common ancestry
- Romanian 5% Scotch-Irish 3% Lithuanian 2%
- Foreign-born
- 20% · Canada, Jamaica, Vietnam
- Languages at home
- 77% English-only · Spanish 10% Other Indo-European 5% Russian/Polish/Slavic 3%
Political lean MEDSL · Collier
- 2024 margin
- Solid R (+33.1) · D 33.1% · R 66.2%
- 2008→2024 swing
- -10.6pp toward R · 2008: -22.5pp · 2024: -33.1pp
- All cycles
- 2024: R+33.1 2020: R+24.7 2016: R+26.0 2012: R+30.1 2008: R+22.5
Not yet ingested
- Civics
- —
Market trends
- HPI YoY
- ▲ 0.29%
- Current HPI
- 279.357
- Rent YoY
- ▲ 0.92%
- Metro
- Naples-Marco Island, FL
- State GDP YoY
- ▲ 3.28%
- F500 in state
- 36
Industry mix (Fortune 500 HQ in FL)
| Industry | F500 HQs | Revenue |
|---|---|---|
| Industrial Technology | 2 | $29B |
|
||
| Insurance | 2 | $17B |
|
||
| Retail | 1 | $60B |
|
||
| Technology Distribution | 1 | $58B |
|
||
| Homebuilding | 1 | $35B |
|
||
| Technology Manufacturing | 1 | $35B |
|
||
Price history
+215.8% since first listed13 events — show timeline
- 2026-03-11 Price Changed $545,000 NAPLESMLS
- 2026-01-08 Listed for Rent $5,200 FGCMLS
- 2026-01-08 Rental Removed $5,200 NAPLESMLS
- 2025-11-13 Price Changed $570,000 NAPLESMLS
- 2025-10-31 Price Changed $5,200 NAPLESMLS
- 2025-08-26 Listed $590,000 NAPLESMLS
- 2025-06-01 Listed for Rent $6,000 NAPLESMLS
- 2025-06-01 Rental Removed $6,000 NAPLESMLS
- 2024-11-14 Listed for Rent $6,000 NAPLESMLS
- 2023-10-03 Listing Removed — NAPLESMLS
- 2023-04-05 Price Changed $615,000 NAPLESMLS
- 2022-12-05 Listed $629,000 NAPLESMLS
- 2002-01-08 Sold (Public Records) $172,600 Public Records
Property tax history
+5.4%/yrLatest (2025): $3,935 · +2.0% YoY. Source: county tax records.
Cash-flow waterfall
monthlySold comps — $/sqft
last 12 mo · ≤1 miLoading sold comps…