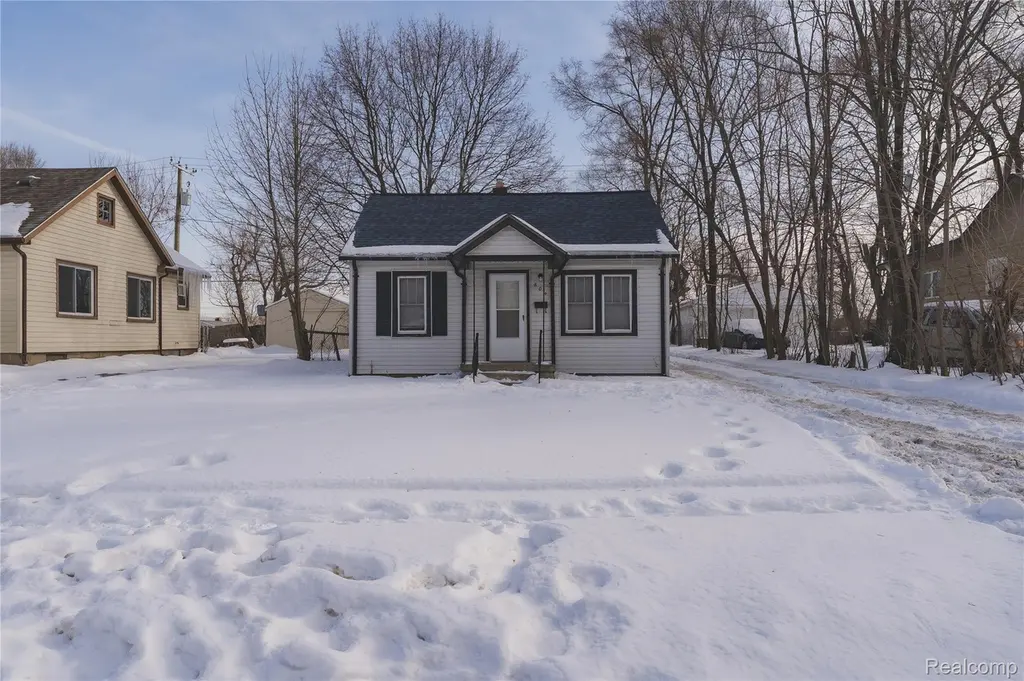
804 Emerson Ave · Pontiac, MI
Flood risk 1/10 · Minimal
- FEMA flood zone
- X (unshaded)
- Chance of flooding over 30 yrs
- 0.0%
- Est. flood insurance / yr
- $507 – $1,088
Fire risk 1/10 · Minimal
- Est. fire insurance / yr
- $784 – $1,456
Heat risk 2/10 · Minimal
- Hot days now (above 97°F)
- 7 days/yr
- Hot days in 30 yrs
- 15 days/yr
Wind risk 2/10 · Minimal
- Chance of severe wind over 30 yrs
- —
Air-quality risk 3/10 · Minor
- Unhealthy air days now
- 2 days/yr
- Unhealthy air days in 30 yrs
- 4 days/yr
Risk factors via First Street. Map © Google.
Why this score? — see what drove the B grade
The composite is a weighted blend of 9 inputs, each scored 0–100. Each bar is that input's sub-score; the figure is the points it added to the 100-point composite (weight × sub-score).
- Cash flow +29.1/30.0
- ARV discount +13.4/15.0
- DSCR +10.0/10.0
- 1% rule +7.4/10.0
- Rent growth +3.7/5.0
- Livability +3.2/5.0
- Condition / age +2.5/5.0
- Schools +1.0/10.0
- Appreciation +0.0/10.0
$105,000
🖨 Deal sheet 📄 Offer letter ✓ Due diligence
Listing remarks MLS
Quiet street, lots of updates, great first time buyers or investment house.
Key facts
- 6,098 sq ft lot
- Built 1920
- Listed 119 days
Neighborhood map
What this means for you Summary
Snapshot
- This is a 2-bed/1.0-bath single-family listed at $105k.
Deal economics
- At list price, monthly cash flow is $361 ($4k/yr) — positive.
- The deal already cash-flows at list — no discount required.
- Meets the 1% rule at list price ($1k rent vs $105k).
- Recommended offer: $96k (9.0% below list) — sets the bar for market timing.
- Cap rate 10.4% vs local median 6.7% in Pontiac — top-decile yield for the area; either an underpriced asset or a hidden risk that comps aren't pricing in. Stress-test before assuming the spread holds.
Location & tenants
- Location reads 64/100 on livability (#499 in MI) — a middle-class / working-renter tenant base. Strengths: commute A+, cost of living A+, housing A+; Watch: health & safety D, schools F, crime F.
- Pontiac City School District (urban): math 8% / reading 17% proficiency, ranked #514 of 540 in MI (top 95%) — low school quality limits family demand, transient renter base, plan for 1-2y turnover; 81% free/reduced lunch — lower-income household profile, screen leases tightly.
- Market conditions: Rents rising fast (+4.7%/yr); 83 active listings in the ZIP; 14 comparable units currently listed for rent nearby; rentals lingering (median 44d on market — plan ~5-8 weeks vacancy on turnover, expect pricing pressure); 50% of comp listings sitting > 30 days — soft ceiling on asking rent; 2,614 units permitted in Oakland County in 2024 (721 in 5+ unit buildings).
- This rent runs 33% of the median local income ($48k/yr) — at the standard rent-burdened threshold; future hikes will face affordability resistance.
Forward outlook
- Local home prices are declining (-3.0%/yr); year-one equity from $726 of loan paydown is wiped out by about $3k of value loss. Plan a longer hold.
- Oakland County population projected at +10% by 2050 — modest demand growth; plan on rents tracking national, not racing it.
- At projected returns (-3.0% appreciation + 4.7% rent growth), your $29k cash investment doubles in ~8 years — after that, you're playing with house money.
Negotiation context
- It's been on market 119 days — a 9% lower offer ($96k) is reasonable based on typical stale-listing flexibility.
- 6 sale attempts since 23y ago; this cycle's ask has dropped $35k (25%) from the opening price — seller is motivated, your offer sets the floor, not the list.
Risks & watch-outs
- Watch-outs: built in 1920 — expect roof / HVAC / electrical / plumbing capex.
Questions for the listing agent
- It's been on market 119 days. Have you received any prior offers? Is the seller open to a 9% concession, seller financing, or rate buy-down credit?
- Built in 1920 — when were the roof, HVAC, electrical panel, plumbing, and water heater last replaced?
- Why hasn't it sold? Are there any deal-killer items the seller is aware of (foundation, flood, title, zoning, code violations)?
- Is there a deadline driving the sale (1031 exchange, divorce, estate, relocation)? That informs how much negotiation room exists.
- Schools are F-rated, which usually means shorter tenancies and higher turnover. Who's the typical renter profile here, and what's been the actual vacancy rate?
- Crime grade is F in this area — have there been break-ins, vandalism, or insurance claims at this property in the last 3 years? What carrier currently insures it and at what premium?
- What's the average days-on-market for RENTAL listings here right now (not sales)? A rising rental-DOM trend means longer vacancies and softer asking-rent achievability than the comps imply.
- What's the recent tenant-quality profile in this submarket — average credit score on applications, eviction rate, late-payment / NSF rate, and stable-employment percentage? A property-management company in the area should have these aggregated.
- How much new for-sale + rental construction is in the pipeline within 1–3 miles? Heavy new supply typically softens prices + rents 12–24 months out; constrained supply supports both.
Investment metrics
- 1% rule
- 1.24% ✓
- Cap rate
- 10.42%
- Cash-on-cash
- 14.75%
- DSCR
- 1.66
- GRM
- 6.7
CMA / ARV
- ARV (median comp)
- $120,761
- List price
- $105,000
- Delta
- -13.05%
- Verdict
- UNDERPRICED
- Comps
- 20 within 1.0 mi
Show comp detail 12 sales within ~0.75 mi
| Address | Dist | Beds/Ba | Sqft | Sold | Price | $/sf | Match |
|---|---|---|---|---|---|---|---|
| 725 Emerson Ave | 0.15mi | 3/1.0 (+1) | 902 (+3%) | 5mo | $136,000 | $151 | 79 |
| 785 Kenilworth Ave | 0.14mi | 2/1.5 | 799 (-9%) | 7mo | $87,500 | $110 | 70 |
| 710 Melrose St | 0.24mi | 3/1.0 (+1) | 952 (+8%) | 3mo | $142,000 | $149 | 67 |
| 506 Emerson Ave | 0.52mi | 3/1.0 (+1) | 900 (+2%) | 1mo | $135,000 | $150 | 66 |
| 973 Kettering Ave | 0.32mi | 2/1.0 | 796 (-9%) | 6mo | $97,500 | $122 | 64 |
| 509 Cameron Ave | 0.52mi | 3/1.0 (+1) | 860 (-2%) | 6mo | $42,000 | $49 | 62 |
| 414 Kenilworth Ave | 0.72mi | 3/1.0 (+1) | 884 (+1%) | 4mo | $155,000 | $175 | 57 |
| 674 Parkwood Ave | 0.46mi | 3/1.0 (+1) | 961 (+9%) | 3mo | $100,000 | $104 | 55 |
| 667 Raskob St | 0.67mi | 3/1.0 (+1) | 866 (-2%) | 8mo | $95,000 | $110 | 55 |
| 428 Jordon Rd | 0.72mi | 3/1.0 (+1) | 887 (+1%) | 7mo | $153,000 | $172 | 54 |
| 635 Wesbrook St | 0.74mi | 3/1.0 (+1) | 842 (-4%) | 2mo | $135,000 | $160 | 52 |
| 638 Raskob St | 0.72mi | 2/1.0 | 809 (-8%) | 2mo | $104,000 | $129 | 51 |
Match score weights: distance 35% · size 25% · config 20% · recency 20%. Top-matched comps best support the ARV.
Projected returns pro-forma
-3.0% appreciation · 4.73% rent growth · sell at horizon
- IRR
- 7.1%
- Equity multiple
- 1.28×
- Total profit
- $8,280
- Equity at exit
- $15,656
- IRR
- 17.8%
- Equity multiple
- 2.58×
- Total profit
- $46,552
- Equity at exit
- $9,078
Cash invested: $29,400 (down + closing). Projections, not guarantees.
Landlord ↔ Tenant lean methodology
- Overall (STATE)
- 62 Landlord-Friendly
- State Michigan
- 62 Landlord-Friendly · EVEN
- County
- — inherits STATE
- City
- — inherits STATE
ZIP-level market 48340
- Rents YoY
- 4.7%
- Active inventory
- 83
- Price-to-rent
- 6.7×
Monthly cashflow live
- Estimated rent
- $1,300 high interval (Pro) →
- Mortgage (P&I)
- −$551
- Tax from tax record
- −$71 /mo · $853/yr
- Insurance
- −$44
- HOA
- −$0
- Vacancy / Maint / Mgmt
- −$273
- Net cashflow
- $361
Break-even live
UW: 25.0% down · 7.5% · 30yr · 1.5% tax · 5.0% vac · 8.0% maint · 8.0% mgmt
Financing live
Cash to close
- Down payment
- $26,250
- Closing costs
- $3,150
- Reserves months
- —
- Total cash needed
- —
Loan-product check · same deal, 3 products live
Conventional
25% down · 7.5% · 30yr
- Down + closing
- —
- Monthly P&I
- —
- Monthly cashflow
- —
- DSCR
- —
- Eligible?
- —
Personal DTI + credit; lowest rate.
DSCR
20% down · 8.5% · 30yr
- Down + closing
- —
- Monthly P&I
- —
- Monthly cashflow
- —
- DSCR
- —
- Eligible?
- —
No personal income docs; deal must DSCR.
Hard money
10% down · 12.0% · 12mo
- Down + closing
- —
- Monthly P&I
- —
- Monthly cashflow
- —
- DSCR
- —
- Eligible?
- —
Short-term bridge; refi at stabilization.
Rent comps 14 comps
| Address | Beds | Baths | Sqft | Rent | $/sqft | DOM | Units | Dist |
|---|---|---|---|---|---|---|---|---|
| 750 Scottwood St Pontiac, MI | 3.0 | 1.0 | 920 | $1,395 | $1.52 | 12d | 1 | 0.35mi |
| 957 Perry St Pontiac, MI | 1.0–3.0 | 1.0 | 835 | $974 | $1.17 | 43d | 1 | 0.67mi |
| 1173 Featherstone Rd Pontiac, MI | 3.0 | 1.5 | 970 | $1,495 | $1.54 | 24d | 1 | 0.80mi |
| 695 1st Ave Pontiac, MI | 3.0 | 1.0 | 986 | $1,295 | $1.31 | 43d | 1 | 0.81mi |
| 611 E Madison Ave Pontiac, MI | 3.0 | 1.5 | 950 | $1,395 | $1.47 | 43d | 1 | 0.82mi |
| 672 Linda Vista Dr Pontiac, MI | 3.0 | 1.0 | 900 | $1,500 | $1.67 | 3d | 1 | 0.88mi |
| 505 Old Oak Ct Pontiac, MI | 2.0 | 1.0 | 1100 | $1,299 | $1.18 | 43d | 1 | 0.89mi |
| 505 Old Oak Ct Unit 507 Pontiac, MI | 1.0 | 1.0 | 770 | $1,049 | $1.36 | 43d | 1 | 0.93mi |
| 505 Old Oak Ct Unit 7 Pontiac, MI | 2.0 | 1.0 | 950 | $1,279 | $1.35 | 43d | 1 | 0.93mi |
| 188 Vernon Dr Pontiac, MI | 3.0 | 1.0 | 1100 | $1,500 | $1.36 | 24d | 1 | 0.95mi |
| 16 Victory Dr Unit 18 Pontiac, MI | 2.0 | 1.0 | 1114 | $1,150 | $1.03 | 24d | 1 | 1.14mi |
| 16 Victory Dr Unit 18 Pontiac, MI | 2.0 | 1.0 | 1118 | $1,150 | $1.03 | 43d | 1 | 1.14mi |
| 860 Walton Blvd Pontiac, MI | 2.0 | 2.0 | 1025 | $1,295 | $1.26 | 1d | 3 | 1.21mi |
| 1221 Colony Ln Pontiac, MI | 1.0–2.0 | 1.0–1.5 | 950 | $1,250 | $1.32 | 1d | 3 | 1.25mi |
Listing history 29 events
-
2026-06-13statusdays on market $105,000 Pending 119 DOM
-
2026-06-09days on market $105,000 Active 118 DOM
-
2026-06-08days on market $105,000 Active 117 DOM
-
2026-06-07days on market $105,000 Active 116 DOM
-
2026-06-04days on market $105,000 Active 113 DOM
-
2026-06-03days on market $105,000 Active 112 DOM
-
2026-06-02days on market $105,000 Active 111 DOM
-
2026-06-01days on market $105,000 Active 110 DOM
-
2026-05-31days on market $105,000 Active 109 DOM
-
2026-04-15price $105,000 75-char remark
Show marketing remark (75 chars)
Quiet street, lots of updates, great first time buyers or investment house.
-
2026-04-15price $105,000 75-char remark
Show marketing remark (75 chars)
Quiet street, lots of updates, great first time buyers or investment house.
-
2026-03-25price $109,000 75-char remark
Show marketing remark (75 chars)
Quiet street, lots of updates, great first time buyers or investment house.
-
2026-03-25price $109,000 75-char remark
Show marketing remark (75 chars)
Quiet street, lots of updates, great first time buyers or investment house.
-
2026-03-18price $115,000 75-char remark
Show marketing remark (75 chars)
Quiet street, lots of updates, great first time buyers or investment house.
-
2026-03-18price $115,000 75-char remark
Show marketing remark (75 chars)
Quiet street, lots of updates, great first time buyers or investment house.
-
2026-03-07status Active 75-char remark
Show marketing remark (75 chars)
Quiet street, lots of updates, great first time buyers or investment house.
-
2026-03-07historical 75-char remark
Show marketing remark (75 chars)
Quiet street, lots of updates, great first time buyers or investment house.
-
2026-02-20price $125,000 75-char remark
Show marketing remark (75 chars)
Quiet street, lots of updates, great first time buyers or investment house.
-
2026-02-20price $125,000 75-char remark
Show marketing remark (75 chars)
Quiet street, lots of updates, great first time buyers or investment house.
-
2026-02-11$139,900 Active 75-char remark
Show marketing remark (75 chars)
Quiet street, lots of updates, great first time buyers or investment house.
-
2026-02-11$139,900 Active 75-char remark
Show marketing remark (75 chars)
Quiet street, lots of updates, great first time buyers or investment house.
-
2018-03-02soldstatus $700,000
-
2009-01-04historical
-
2008-11-18$8,000
-
2004-01-30soldstatus $60,000
-
2003-10-20historical
-
2003-10-13$63,900
-
2003-09-02historical
-
2003-04-29$59,899
ⓘ Source: listings_history table (triggers on properties + properties_extension) + one-shot
backfill from property_details.listing_events for pre-trigger history.
Tax reassessment forecast MI · Partial reset (capped growth)
- Current annual tax
- $853 · $71/mo
- Projected year-2 tax
- $1,235 · $103/mo
- Expected delta
- +$382/yr (+$32/mo · 44.8%)
ⓘ Screening estimate from a state-policy table — verify with the county assessor before closing.
Climate risk First Street
- Flood 1/10 Low FEMA zone X (unshaded) · 0% chance over 30 yrs
- Wildfire 1/10 Low
- Heat 2/10 Low 7 d/yr ≥97°F today · 15 d/yr by 30 yrs out
- Wind 2/10 Low
- Air quality 3/10 Moderate 2 unhealthy d/yr today · 4 by 30 yrs out
Nearby sold comps map
Loading sold comps map…
Walkable amenities ~0.75 mi
Loading nearby amenities…
Taxation est. · year 1
- Rental income
- $15,596
- − Mortgage interest
- −$5,882
- − Property taxes
- −$853
- − Insurance
- −$525
- − Repairs & maintenance
- −$1,248
- − Management
- −$1,248
- − Depreciation
- −$3,055
- Taxable income
- $2,787
- Est. tax owed @ 24.0%
- −$669
- After-tax cash flow
- $3,667/yr
For passive investors: Depreciation is non-cash, so a rental often shows a tax loss while cash-flowing — sheltering income. Rental losses are passive: they offset passive income freely, and up to $25,000/yr can offset ordinary (W-2) income if you actively participate and your MAGI is under $100k (phasing out to $0 by $150k); unused losses carry forward. On sale, claimed depreciation is recaptured at up to 25%, and gains may owe capital-gains tax (a 1031 exchange can defer both). Figures are a year-1 estimate at your 24.0% rate — not tax advice; consult a CPA.
Schools (NCES district)
- District
- Pontiac City School District
- NCES district ID
- 2628740
- Math proficiency
- 8% ▼ -5.00%
- Reading proficiency
- 17% ▼ -3.00%
- Median HH income
- $33,888
- Composite
- 10.12/100
- National rank
- #9802
- State rank
- #514 of 540 in MI
Livability — Pontiac
- Score
- 64/100
- State rank
- #499
- US rank
- #14703
Category grades
Schools grade is shown separately in the Schools card above.
Census & demographics
- Census place
- Pontiac, MI
- County
- Oakland County · 1,009,092 people
- City population
- 44,593
- Metro
- Detroit-Warren-Dearborn, MI
- Population (ZIP)
- 25,669
- Household income
- $47,891
- Rent vs Own
- Severe rent burden
- 1460.0
Population outlook (Oakland County) Hauer SSP2
- Today (2025)
- 1,335,747 people
- By 2030
- 1,375,100 · +2.9%
- By 2040
- 1,435,385 · +7.5%
- By 2050
- 1,469,250 · +10.0%
- By 2075
- 1,531,946 · +14.7%
- By 2100
- 1,450,485 · +8.6%
Race, ethnicity, and origin ACS 2023
- Neighborhood character
- Highly diverse neighborhood (Simpson 0.73)
- Race & ethnicity
- Black 31% Hispanic / Latino 31% White 29% Two or more races 22% Asian 4%
- Hispanic origin (detail)
- Mexican 18% Puerto Rican 7%
- Common ancestry
- Lithuanian 2% Romanian 2% Serbian 1%
- Foreign-born
- 11% · Canada, China
- Languages at home
- 74% English-only · Spanish 23% Other Asian/Pacific 2% Chinese 1%
Political lean MEDSL · Oakland
- 2024 margin
- D (+10.6) · D 54.4% · R 43.8% · Other 1.9%
- 2008→2024 swing
- -3.9pp toward R · 2008: 14.5pp · 2024: 10.6pp
- All cycles
- 2024: D+10.6 2020: D+14.1 2016: D+8.1 2012: D+8.1 2008: D+14.5
Not yet ingested
- Civics
- —
Market trends
- HPI YoY
- ▼ -295.80%
- Current HPI
- 177.961
- Rent YoY
- ▲ 4.73%
- Metro
- Detroit-Warren-Dearborn, MI
- State GDP YoY
- ▲ 1.37%
- F500 in state
- 28
Industry mix (Fortune 500 HQ in MI)
| Industry | F500 HQs | Revenue |
|---|---|---|
| Automotive Parts | 3 | $48B |
|
||
| Automotive | 2 | $372B |
|
||
| Chemicals | 1 | $45B |
|
||
| Automotive Retail | 1 | $29B |
|
||
| Healthcare / Medical Devices | 1 | $23B |
|
||
| Automotive Technology | 1 | $20B |
|
||
Price history
+75.3% since first listed20 events — show timeline
- 2026-04-15 Price Changed $105,000 MiRealSource-MiMLS
- 2026-04-15 Price Changed $105,000 REALCOMP
- 2026-03-25 Price Changed $109,000 MiRealSource-MiMLS
- 2026-03-25 Price Changed $109,000 REALCOMP
- 2026-03-18 Price Changed $115,000 MiRealSource-MiMLS
- 2026-03-18 Price Changed $115,000 REALCOMP
- 2026-03-07 Relisted — REALCOMP
- 2026-03-07 Listing Removed — REALCOMP
- 2026-02-20 Price Changed $125,000 MiRealSource-MiMLS
- 2026-02-20 Price Changed $125,000 REALCOMP
- 2026-02-11 Listed $139,900 REALCOMP
- 2026-02-11 Listed $139,900 MiRealSource-MiMLS
- 2018-03-02 Sold (Public Records) $700,000 Public Records
- 2009-01-04 Listing Removed — REALCOMP
- 2008-11-18 Listed $8,000 REALCOMP
- 2004-01-30 Sold (Public Records) $60,000 Public Records
- 2003-10-20 Listing Removed — REALCOMP
- 2003-10-13 Listed $63,900 REALCOMP
- 2003-09-02 Listing Removed — REALCOMP
- 2003-04-29 Listed $59,899 REALCOMP
Property tax history
+4.5%/yrLatest (2025): $853 · -48.4% YoY. Source: county tax records.
Cash-flow waterfall
monthlySold comps — $/sqft
last 12 mo · ≤1 miLoading sold comps…