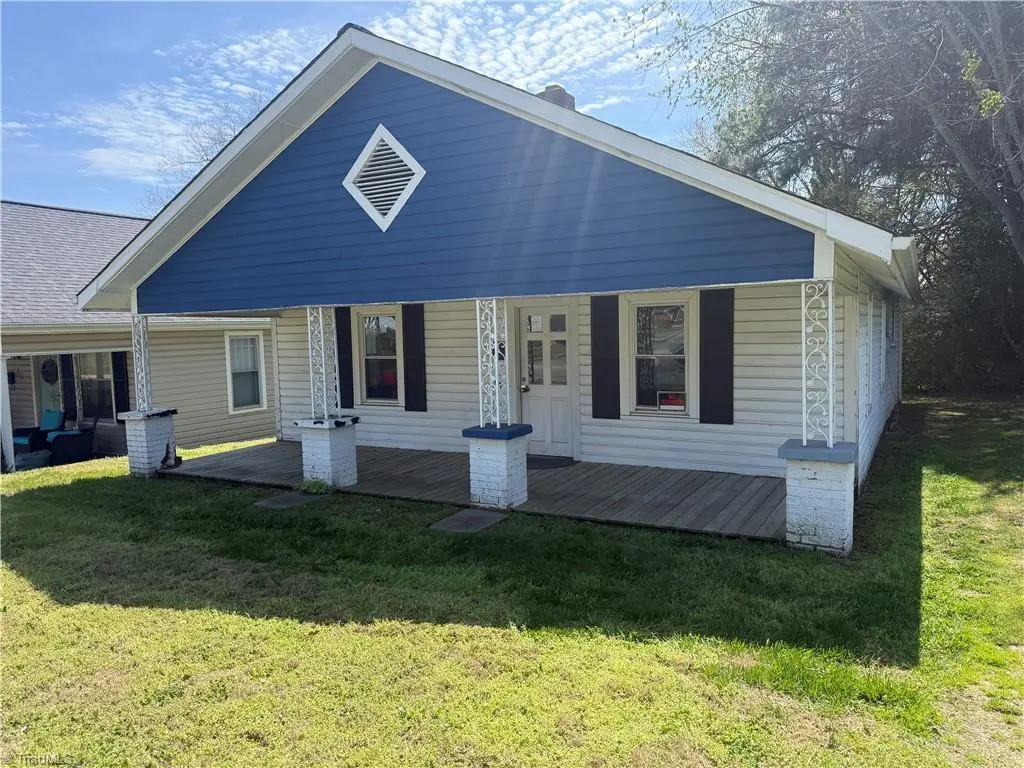
213 W Decatur St · Madison, NC
Flood risk 1/10 · Minimal
- FEMA flood zone
- X (unshaded)
- Chance of flooding over 30 yrs
- 0.0%
- Est. flood insurance / yr
- $507 – $1,088
Fire risk 3/10 · Minor
- Est. fire insurance / yr
- $906 – $1,684
Heat risk 6/10 · Moderate
- Hot days now (above 103°F)
- 7 days/yr
- Hot days in 30 yrs
- 19 days/yr
Wind risk 4/10 · Minor
- Chance of severe wind over 30 yrs
- 8.0%
Air-quality risk 2/10 · Minimal
- Unhealthy air days now
- 2 days/yr
- Unhealthy air days in 30 yrs
- 2 days/yr
Risk factors via First Street. Map © Google.
Why this score? — see what drove the B grade
The composite is a weighted blend of 9 inputs, each scored 0–100. Each bar is that input's sub-score; the figure is the points it added to the 100-point composite (weight × sub-score).
- Cash flow +29.8/30.0
- ARV discount +15.0/15.0
- DSCR +10.0/10.0
- 1% rule +7.6/10.0
- Livability +3.5/5.0
- Schools +3.3/10.0
- Rent growth +2.5/5.0
- Condition / age +2.5/5.0
- Appreciation +0.0/10.0
$110,000
🖨 Deal sheet 📄 Offer letter ✓ Due diligence
Listing remarks
Great Investment opportunity in Downtown Madison! This home can be a single family or a duplex for maximum income potential. Walking distance to dining and shopping! The home is a shell and ready for construction. The homeowner has gutted everything out and ran some electrical. No permits were pulled. This is a great opportunity to come in and make it your own. Home could have LR, Kitchen, 2 bdrms and 2 bath or each duplex could have LR, 1 bedrooom, Kitchen and one bath-you decide! Call today for your tour!
Key facts
- 8,668 sq ft lot
- Built 1926
- Listed 83 days
Tags
Property features AI
Finance
- Other: Building area reported as 1,120 (unit not listed)
- HOA & community: Associated with High Point community (no association required)
Exterior
- Parking: Driveway
- Utilities: Public water; Public sewer; No water heater reported
- Home design: Residential stick/site-built house; One story; Built in 1926; Existing structure
- Construction: Vinyl siding and wood siding; No fireplaces reported
- Exterior features: City lot, cleared and level; No fencing; Lot dimensions approximately 75 x 175 x 75 x 175; Public maintained road
Interior
- Bathrooms: 2 full bathrooms
- Heating & cooling: Cooling: Other (see remarks); Heating: See remarks
- Interior features: Primary bedroom on main level; Attic access only; Crawl space basement
Neighborhood map
What this means for you Summary
Snapshot
- This is a 2-bed/2.0-bath single-family listed at $110k.
Deal economics
- At list price, monthly cash flow is $405 ($5k/yr) — positive.
- The deal already cash-flows at list — no discount required.
- Meets the 1% rule at list price ($1k rent vs $110k).
- Recommended offer: $103k (6.0% below list) — sets the bar for market timing.
- Cap rate 10.7% vs local median 2.9% in Madison — top-decile yield for the area; either an underpriced asset or a hidden risk that comps aren't pricing in. Stress-test before assuming the spread holds.
Location & tenants
- Location reads 69/100 on livability (#158 in NC) — a middle-class / working-renter tenant base. Strengths: cost of living A+, housing A+, crime A; Watch: employment D, amenities F, commute F.
- Rockingham County Schools (rural): math 38% / reading 40% proficiency, ranked #120 of 178 in NC (top 67%) — families likely to look elsewhere, expect single-tenant / working-renter base with shorter leases.
- Zoned schools: John W Dillard Academy (math 37% / reading 37%, grade F, #771 of 1,410 statewide, top 57%, 284 students, 66% FRL); Western Rockingham Middle (math 39% / reading 40%, grade F, #232 of 475 statewide, top 50%, 556 students, 63% FRL); Dalton Mcmichael High (math 42% / reading 47%, grade F, #352 of 535 statewide, top 68%, 723 students, 59% FRL).
- Market conditions: 53 active listings in the ZIP; 6 comparable units currently listed for rent nearby; rentals at typical pace (median 23d on market — plan ~3-4 weeks tenant-placement turnaround); 344 units permitted in Rockingham County in 2024 (0 in 5+ unit buildings).
Forward outlook
- Local home prices are declining (-3.0%/yr); year-one equity from $761 of loan paydown is wiped out by about $3k of value loss. Plan a longer hold.
- Rockingham County population projected at -22% by 2050 — secular population decline; favor cash flow + early exit over multi-decade hold.
- At projected returns (-3.0% appreciation + 3.0% rent growth), your $31k cash investment doubles in ~8 years — after that, you're playing with house money.
Negotiation context
- It's been on market 83 days — a 6% lower offer ($103k) is reasonable based on typical stale-listing flexibility.
- Current owner paid $24k; list at $110k implies a 368% gain — meaningful room to come down on a strong offer.
Risks & watch-outs
- Watch-outs: built in 1926 — expect roof / HVAC / electrical / plumbing capex.
- Climate carrying-cost: extreme-heat days projected 7→19/yr by 2055 (HVAC capex compounding) — expect insurance premiums to compound above CPI over the hold.
Questions for the listing agent
- It's been on market 83 days. Have you received any prior offers? Is the seller open to a 6% concession, seller financing, or rate buy-down credit?
- Built in 1926 — when were the roof, HVAC, electrical panel, plumbing, and water heater last replaced?
- Why hasn't it sold? Are there any deal-killer items the seller is aware of (foundation, flood, title, zoning, code violations)?
- Is there a deadline driving the sale (1031 exchange, divorce, estate, relocation)? That informs how much negotiation room exists.
- Schools are D-rated, which usually means shorter tenancies and higher turnover. Who's the typical renter profile here, and what's been the actual vacancy rate?
- What's the average days-on-market for RENTAL listings here right now (not sales)? A rising rental-DOM trend means longer vacancies and softer asking-rent achievability than the comps imply.
- What's the recent tenant-quality profile in this submarket — average credit score on applications, eviction rate, late-payment / NSF rate, and stable-employment percentage? A property-management company in the area should have these aggregated.
- How much new for-sale + rental construction is in the pipeline within 1–3 miles? Heavy new supply typically softens prices + rents 12–24 months out; constrained supply supports both.
Investment metrics
- 1% rule
- 1.26% ✓
- Cap rate
- 10.71%
- Cash-on-cash
- 15.78%
- DSCR
- 1.70
- GRM
- 6.6
CMA / ARV
- ARV (on-the-fly)
- $210,560
- Comps found
- 12
Show comp detail 12 sales within ~0.75 mi
| Address | Dist | Beds/Ba | Sqft | Sold | Price | $/sf | Match |
|---|---|---|---|---|---|---|---|
| 102 E Gene Hairston St | 0.36mi | 3/2.0 (+1) | 1,120 (0%) | 5mo | $230,000 | $205 | 74 |
| 505 W Decatur St | 0.31mi | 2/1.0 | 1,173 (+5%) | 2mo | $185,500 | $158 | 72 |
| 109 S Lonesome Rd | 0.53mi | 3/2.0 (+1) | 1,120 (0%) | 2mo | $210,000 | $188 | 68 |
| 411 Gene Hairston St | 0.36mi | 3/2.0 (+1) | 1,232 (+10%) | 3mo | $235,000 | $191 | 59 |
| 602 Nichols St | 0.51mi | 3/2.0 (+1) | 1,183 (+6%) | 15mo | $150,000 | $127 | 49 |
| 709 Sunset Ave | 0.65mi | 2/2.0 | 1,214 (+8%) | 12mo | $185,000 | $152 | 46 |
| 507 West End Blvd | 0.58mi | 3/2.0 (+1) | 1,250 (+12%) | 9mo | $240,500 | $192 | 42 |
| 515 West End Blvd | 0.57mi | 3/2.0 (+1) | 1,260 (+12%) | 9mo | $237,500 | $188 | 40 |
| 511 West End Blvd | 0.58mi | 3/2.0 (+1) | 1,250 (+12%) | 12mo | $235,000 | $188 | 39 |
| 503 West End Blvd | 0.58mi | 3/2.0 (+1) | 1,260 (+12%) | 10mo | $239,500 | $190 | 39 |
| 800 Mcgehee St | 0.63mi | 3/1.5 (+1) | 1,024 (-9%) | 17mo | $133,000 | $130 | 35 |
| 709 W Academy St | 0.73mi | 3/1.5 (+1) | 1,008 (-10%) | 9mo | $170,000 | $169 | 35 |
Match score weights: distance 35% · size 25% · config 20% · recency 20%. Top-matched comps best support the ARV.
Projected returns pro-forma
-3.0% appreciation · 3.0% rent growth · sell at horizon
- IRR
- 6.6%
- Equity multiple
- 1.26×
- Total profit
- $7,955
- Equity at exit
- $16,401
- IRR
- 16.0%
- Equity multiple
- 2.30×
- Total profit
- $40,066
- Equity at exit
- $9,511
Cash invested: $30,800 (down + closing). Projections, not guarantees.
Landlord ↔ Tenant lean methodology
- Overall (STATE)
- 85 Strongly Landlord-Friendly
- State North Carolina
- 85 Strongly Landlord-Friendly · R+3
- County
- — inherits STATE
- City
- — inherits STATE
ZIP-level market 27025
- Home prices YoY
- -12.0%
- Active inventory
- 53
- Price-to-rent
- 6.6×
Monthly cashflow live
- Estimated rent
- $1,389 high interval (Pro) →
- Mortgage (P&I)
- −$577
- Tax from tax record
- −$70 /mo · $835/yr
- Insurance
- −$46
- HOA
- −$0
- Vacancy / Maint / Mgmt
- −$292
- Net cashflow
- $405
Break-even live
UW: 25.0% down · 7.5% · 30yr · 1.5% tax · 5.0% vac · 8.0% maint · 8.0% mgmt
Financing live
Cash to close
- Down payment
- $27,500
- Closing costs
- $3,300
- Reserves months
- —
- Total cash needed
- —
Loan-product check · same deal, 3 products live
Conventional
25% down · 7.5% · 30yr
- Down + closing
- —
- Monthly P&I
- —
- Monthly cashflow
- —
- DSCR
- —
- Eligible?
- —
Personal DTI + credit; lowest rate.
DSCR
20% down · 8.5% · 30yr
- Down + closing
- —
- Monthly P&I
- —
- Monthly cashflow
- —
- DSCR
- —
- Eligible?
- —
No personal income docs; deal must DSCR.
Hard money
10% down · 12.0% · 12mo
- Down + closing
- —
- Monthly P&I
- —
- Monthly cashflow
- —
- DSCR
- —
- Eligible?
- —
Short-term bridge; refi at stabilization.
Rent comps 6 comps
| Address | Beds | Baths | Sqft | Rent | $/sqft | DOM | Units | Dist |
|---|---|---|---|---|---|---|---|---|
| 301 Dahl St Unit A Madison, NC | 2.0 | 2.0 | 960 | $1,295 | $1.35 | 14d | 1 | 0.26mi |
| 109 S Lonesome Rd Madison, NC | 3.0 | 2.0 | 1120 | $1,695 | $1.51 | 23d | 1 | 0.52mi |
| 254 H W Cir Madison, NC | 3.0 | 1.0 | 974 | $1,500 | $1.54 | 23d | 1 | 0.65mi |
| 254 H W Cir Madison, NC | 3.0 | 1.0 | 974 | $1,350 | $1.39 | 14d | 1 | 0.65mi |
| 4501 N Carolina 704 Unit Bdl 1 (2 Bedroom) Madison, NC | 2.0 | 1.0 | 990 | $1,199 | $1.21 | 23d | 1 | 1.25mi |
| 4501 N Carolina 704 Unit Bld1 (1 Bedroom) Madison, NC | 1.0 | 1.0 | 750 | $949 | $1.27 | 23d | 1 | 1.25mi |
Listing history 20 events
-
2026-06-18days on market $110,000 Active 83 DOM
-
2026-06-17days on market $110,000 Active 82 DOM
-
2026-06-16days on market $110,000 Active 81 DOM
-
2026-06-15days on market $110,000 Active 80 DOM
-
2026-06-14days on market $110,000 Active 78 DOM
-
2026-06-13days on market $110,000 Active 77 DOM
-
2026-06-10days on market $110,000 Active 75 DOM
-
2026-06-09days on market $110,000 Active 74 DOM
-
2026-06-08days on market $110,000 Active 73 DOM
-
2026-06-07days on market $110,000 Active 72 DOM
-
2026-06-03days on market $110,000 Active 68 DOM
-
2026-06-02days on market $110,000 Active 67 DOM
-
2026-06-01days on market $110,000 Active 66 DOM
-
2026-05-31days on market $110,000 Active 65 DOM
-
2026-05-31days on market $110,000 Active 64 DOM
-
2026-03-27$110,000 Active
-
2021-05-26price $78,000
-
2021-04-19price $85,000
-
2021-03-26price $99,900
-
2008-09-25soldstatus $23,500
ⓘ Source: listings_history table (triggers on properties + properties_extension) + one-shot
backfill from property_details.listing_events for pre-trigger history.
Tax reassessment forecast NC · Resets to sale price
- Current annual tax
- $835 · $70/mo
- Projected year-2 tax
- $902 · $75/mo
- Expected delta
- +$67/yr (+$6/mo · 8.0%)
ⓘ Screening estimate from a state-policy table — verify with the county assessor before closing.
Climate risk First Street
- Flood 1/10 Low FEMA zone X (unshaded) · 0% chance over 30 yrs
- Wildfire 3/10 Moderate
- Heat 6/10 Major 7 d/yr ≥103°F today · 19 d/yr by 30 yrs out
- Wind 4/10 Moderate 8% chance of damaging wind over 30 yrs
- Air quality 2/10 Low 2 unhealthy d/yr today · 2 by 30 yrs out
Nearby sold comps map
Loading sold comps map…
Walkable amenities ~0.75 mi
Loading nearby amenities…
Taxation est. · year 1
- Rental income
- $16,669
- − Mortgage interest
- −$6,162
- − Property taxes
- −$835
- − Insurance
- −$550
- − Repairs & maintenance
- −$1,333
- − Management
- −$1,333
- − Depreciation
- −$3,200
- Taxable income
- $3,255
- Est. tax owed @ 24.0%
- −$781
- After-tax cash flow
- $4,080/yr
For passive investors: Depreciation is non-cash, so a rental often shows a tax loss while cash-flowing — sheltering income. Rental losses are passive: they offset passive income freely, and up to $25,000/yr can offset ordinary (W-2) income if you actively participate and your MAGI is under $100k (phasing out to $0 by $150k); unused losses carry forward. On sale, claimed depreciation is recaptured at up to 25%, and gains may owe capital-gains tax (a 1031 exchange can defer both). Figures are a year-1 estimate at your 24.0% rate — not tax advice; consult a CPA.
Schools (NCES district)
- District
- Rockingham County Schools
- NCES district ID
- 3703990
- Math proficiency
- 38% ▼ -2.00%
- Reading proficiency
- 40% ▲ 1.00%
- Median HH income
- $38,914
- Composite
- 32.6/100
- National rank
- #5673
- State rank
- #120 of 178 in NC
Livability — Madison
- Score
- 69/100
- State rank
- #158
- US rank
- #8684
Category grades
Schools grade is shown separately in the Schools card above.
Census & demographics
- Census place
- Madison, NC
- Population (ZIP)
- 12,333
Population outlook (Rockingham County) Hauer SSP2
- Today (2025)
- 87,103 people
- By 2030
- 83,763 · -3.8%
- By 2040
- 76,082 · -12.7%
- By 2050
- 68,106 · -21.8%
- By 2075
- 52,531 · -39.7%
- By 2100
- 39,871 · -54.2%
Race, ethnicity, and origin ACS 2023
- Neighborhood character
- Predominantly White (81%)
- Race & ethnicity
- White 81% Black 10% Hispanic / Latino 5% Two or more races 5%
- Hispanic origin (detail)
- Mexican 2%
- Common ancestry
- Serbian 3% Italian 2% Lithuanian 1%
- Foreign-born
- 2% · Canada
- Languages at home
- 94% English-only · Spanish 4% Other Asian/Pacific 1%
Political lean MEDSL · Rockingham
- 2024 margin
- Solid R (+35.9) · D 31.7% · R 67.6%
- 2008→2024 swing
- -19.9pp toward R · 2008: -16.0pp · 2024: -35.9pp
- All cycles
- 2024: R+35.9 2020: R+32.0 2016: R+30.0 2012: R+21.3 2008: R+16.0
Not yet ingested
- Civics
- —
Market trends
- HPI YoY
- ▼ -32.83%
- Current HPI
- 240.0188
- Rent YoY
- —
- Metro
- —
- State GDP YoY
- ▲ 3.28%
- F500 in state
- 26
Industry mix (Fortune 500 HQ in NC)
| Industry | F500 HQs | Revenue |
|---|---|---|
| Financial Services | 2 | $213B |
|
||
| Retail | 2 | $95B |
|
||
| Industrial Conglomerate | 1 | $38B |
|
||
| Metals / Steel | 1 | $35B |
|
||
| Utilities | 1 | $30B |
|
||
| Industrial Machinery | 1 | $19B |
|
||
Price history
+368.1% since first listed5 events — show timeline
- 2026-03-27 Listed $110,000 Triad MLS
- 2021-05-26 Price Changed $78,000 Triad MLS
- 2021-04-19 Price Changed $85,000 Triad MLS
- 2021-03-26 Price Changed $99,900 Triad MLS
- 2008-09-25 Sold (Public Records) $23,500 Public Records
Property tax history
+5.0%/yrLatest (2025): $835 · +0.9% YoY. Source: county tax records.
Cash-flow waterfall
monthlySold comps — $/sqft
last 12 mo · ≤1 miLoading sold comps…