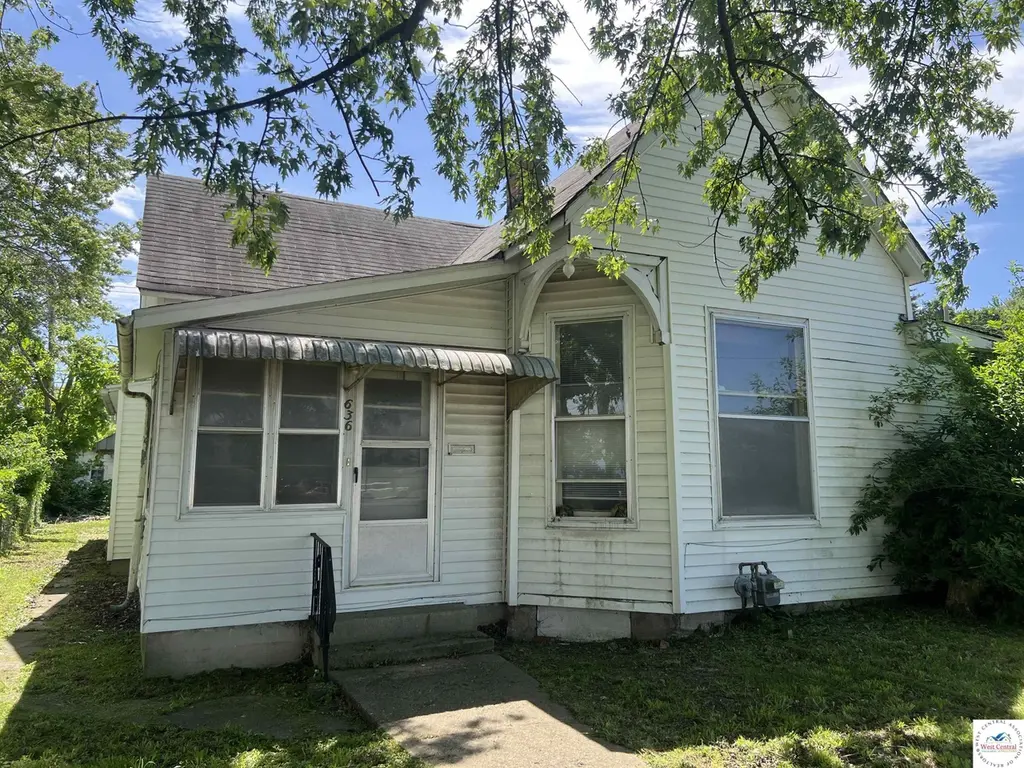
636 E Broadway Blvd · Sedalia, MO
Flood risk 1/10 · Minimal
- FEMA flood zone
- X (unshaded)
- Chance of flooding over 30 yrs
- 0.0%
- Est. flood insurance / yr
- $473 – $860
Fire risk 3/10 · Minor
- Est. fire insurance / yr
- $1,054 – $1,958
Heat risk 4/10 · Minor
- Hot days now (above 106°F)
- 7 days/yr
- Hot days in 30 yrs
- 18 days/yr
Wind risk 2/10 · Minimal
- Chance of severe wind over 30 yrs
- —
Air-quality risk 2/10 · Minimal
- Unhealthy air days now
- 0 days/yr
- Unhealthy air days in 30 yrs
- 1 days/yr
Risk factors via First Street. Map © Google.
Why this score? — see what drove the B- grade
The composite is a weighted blend of 9 inputs, each scored 0–100. Each bar is that input's sub-score; the figure is the points it added to the 100-point composite (weight × sub-score).
- Cash flow +30.0/30.0
- DSCR +10.0/10.0
- 1% rule +8.4/10.0
- ARV discount +7.5/15.0
- Schools +3.9/10.0
- Livability +3.6/5.0
- Rent growth +2.5/5.0
- Condition / age +2.5/5.0
- Appreciation +0.0/10.0
$89,900
🖨 Deal sheet (PDF) 📄 Offer letter ✓ Due diligence
Listing remarks MLS
This home offers 2 living rooms, an eat-in kitchen with dining, and 3 (one non-conforming) bedrooms, plus 2 full bathrooms. WOW! The kitchen offers plenty of cabinet space with a large closet/pantry and all appliances. The large living room features a gas fireplace and hardwood floors. The other living room separates the 2 bedrooms, with the main bedroom having its own full bath. There is another full bath, laundry room and sunroom/mudroom. This home is located close to downtown, The Jr. High, grocery and other nearby amenities. Newer metal roof on part of the house, newer furnace, a shed/garage out back with additional parking spaces and a covered patio.
Key facts
- Functional layout
- 5,612 sq ft lot
- Built 1920
Tags
Property features AI
Exterior
- Parking: No garage; parking is at the rear alley
- Utilities: Public water; Public sewer; Natural gas available; Electric service includes 220 volts
- Home design: Single-family residential property
- Construction: Vinyl-sided exterior; Composition and metal roofing
- Exterior features: Composition and metal roof; Vinyl siding; Lot about 5,612 sq ft (46 x 122)
Interior
- Kitchen: Gas water heater
- Bedrooms: Bedrooms not specified
- Flooring: Carpet
- Bathrooms: 2 full bathrooms
- Heating & cooling: Natural gas heating; Ceiling fans for cooling
- Interior features: Ceiling fans; Gas fireplace in the living room
- Laundry & utility: 220V electrical in laundry
Neighborhood map
What this means for you Summary
Snapshot
- This is a 2-bed/1.5-bath single-family listed at $90k.
Deal economics
- At list price, monthly cash flow is $406 ($5k/yr) — positive.
- The deal already cash-flows at list — no discount required.
- Meets the 1% rule at list price ($1k rent vs $90k).
- Cap rate 11.7% vs local median 4.5% in Sedalia — top-decile yield for the area; either an underpriced asset or a hidden risk that comps aren't pricing in. Stress-test before assuming the spread holds.
Location & tenants
- Location reads 71/100 on livability (#107 in MO) — a middle-class / working-renter tenant base. Strengths: cost of living A+, housing A+, health & safety A+; Watch: amenities D, crime F, commute F.
- Sedalia 200 (town): math 47% / reading 46% proficiency, ranked #89 of 324 in MO (top 28%) — families likely to look elsewhere, expect single-tenant / working-renter base with shorter leases.
- Zoned schools: Smith-Cotton High School (math 46% / reading 58%, grade D+, #92 of 521 statewide, top 20%, 1,474 students, 59% FRL) — zoned schools at 59% FRL track the district average.
- Market conditions: 220 active listings in the ZIP; 1 comparable units currently listed for rent nearby; 109 units permitted in Pettis County in 2024 (46 in 5+ unit buildings).
Forward outlook
- Local home prices are declining (-3.0%/yr); year-one equity from $622 of loan paydown is wiped out by about $3k of value loss. Plan a longer hold.
- Pettis County population projected to shrink 7% by 2050 — rents likely to lag national; underwrite the cash flow, not the appreciation.
- At projected returns (-3.0% appreciation + 3.0% rent growth), your $25k cash investment doubles in ~7 years — after that, you're playing with house money.
Negotiation context
- Only 5 days on market — expect competitive offers; lowballing is unlikely to land.
- 3 sale attempts since 6y ago with the ask held roughly flat each time — persistent listings suggest the price (not the market) is what's stuck; bring a comps-based counter.
Risks & watch-outs
- Watch-outs: built in 1920 — expect roof / HVAC / electrical / plumbing capex.
Questions for the listing agent
- Built in 1920 — when were the roof, HVAC, electrical panel, plumbing, and water heater last replaced?
- Is there a deadline driving the sale (1031 exchange, divorce, estate, relocation)? That informs how much negotiation room exists.
- Crime grade is F in this area — have there been break-ins, vandalism, or insurance claims at this property in the last 3 years? What carrier currently insures it and at what premium?
- What's the average days-on-market for RENTAL listings here right now (not sales)? A rising rental-DOM trend means longer vacancies and softer asking-rent achievability than the comps imply.
- What's the recent tenant-quality profile in this submarket — average credit score on applications, eviction rate, late-payment / NSF rate, and stable-employment percentage? A property-management company in the area should have these aggregated.
- How much new for-sale + rental construction is in the pipeline within 1–3 miles? Heavy new supply typically softens prices + rents 12–24 months out; constrained supply supports both.
Investment metrics
- 1% rule
- 1.34% ✓
- Cap rate
- 11.71%
- Cash-on-cash
- 19.34%
- DSCR
- 1.86
- GRM
- 6.2
CMA / ARV
- ARV (on-the-fly)
- $186,620
- Comps found
- 9
Show comp detail 9 sales within ~0.75 mi
| Address | Dist | Beds/Ba | Sqft | Sold | Price | $/sf | Match |
|---|---|---|---|---|---|---|---|
| 420 S Engineer Ave | 0.44mi | 1/1.0 (-1) | 1,495 (-1%) | 9mo | $110,000 | $74 | 64 |
| 813 E 16th St | 0.48mi | 3/2.0 (+1) | 1,531 (+2%) | 5mo | $189,500 | $124 | 63 |
| 707 E 11th St | 0.19mi | 3/2.0 (+1) | 1,663 (+10%) | 10mo | $215,000 | $129 | 58 |
| 670 E 15th St | 0.41mi | 2/1.0 | 1,345 (-11%) | 11mo | $150,000 | $112 | 52 |
| 1018 S Massachusetts Ave | 0.33mi | 3/2.0 (+1) | 1,350 (-10%) | 20mo | $234,000 | $173 | 44 |
| 1101 E 4th St | 0.44mi | 3/2.0 (+1) | 1,381 (-8%) | 19mo | $167,000 | $121 | 43 |
| 1503 E 11th St | 0.64mi | 3/1.0 (+1) | 1,369 (-9%) | 7mo | $220,000 | $161 | 42 |
| 914 S Osage Ave | 0.48mi | 3/2.0 (+1) | 1,646 (+9%) | 16mo | $239,000 | $145 | 42 |
| 321 W 10th St | 0.58mi | 3/2.0 (+1) | 1,708 (+14%) | 20mo | $157,900 | $92 | 27 |
Match score weights: distance 35% · size 25% · config 20% · recency 20%. Top-matched comps best support the ARV.
Projected returns pro-forma
-3.0% appreciation · 3.0% rent growth · sell at horizon
- IRR
- 11.3%
- Equity multiple
- 1.45×
- Total profit
- $11,243
- Equity at exit
- $13,404
- IRR
- 20.3%
- Equity multiple
- 2.71×
- Total profit
- $42,951
- Equity at exit
- $7,773
Cash invested: $25,172 (down + closing). Projections, not guarantees.
Landlord ↔ Tenant lean methodology
- Overall (STATE)
- 81 Strongly Landlord-Friendly
- State Missouri
- 81 Strongly Landlord-Friendly · R+10
- County
- — inherits STATE
- City
- — inherits STATE
ZIP-level market 65301
- Home prices YoY
- -21.8%
- Active inventory
- 220
- Price-to-rent
- 6.2×
Monthly cashflow live
- Estimated rent
- $1,207 medium interval (Pro) →
- Mortgage (P&I)
- −$471
- Tax from tax record
- −$39 /mo · $467/yr
- Insurance
- −$37
- HOA
- −$0
- Vacancy / Maint / Mgmt
- −$253
- Net cashflow
- $406
Break-even live
Sensitivity live
| Price | -10% $457 | -5% $431 | +0% $406 | +5% $380 | +10% $355 |
|---|---|---|---|---|---|
| Rent | -10% $310 | -5% $358 | +0% $406 | +5% $453 | +10% $501 |
| Rate | -1.0pp $451 | -0.5pp $429 | base $406 | +0.5pp $382 | +1.0pp $359 |
UW: 25.0% down · 7.5% · 30yr · 1.5% tax · 5.0% vac · 8.0% maint · 8.0% mgmt
Financing live
Cash to close
- Down payment
- $22,475
- Closing costs
- $2,697
- Reserves months
- —
- Total cash needed
- —
Loan-product check · same deal, 3 products live
Conventional
25% down · 7.5% · 30yr
- Down + closing
- —
- Monthly P&I
- —
- Monthly cashflow
- —
- DSCR
- —
- Eligible?
- —
Personal DTI + credit; lowest rate.
DSCR
20% down · 8.5% · 30yr
- Down + closing
- —
- Monthly P&I
- —
- Monthly cashflow
- —
- DSCR
- —
- Eligible?
- —
No personal income docs; deal must DSCR.
Hard money
10% down · 12.0% · 12mo
- Down + closing
- —
- Monthly P&I
- —
- Monthly cashflow
- —
- DSCR
- —
- Eligible?
- —
Short-term bridge; refi at stabilization.
Rent comps 1 comps
| Address | Beds | Baths | Sqft | Rent | $/sqft | DOM | Units | Dist |
|---|---|---|---|---|---|---|---|---|
| 1350 E 24th St Sedalia, MO | 3.0 | 2.5 | 1500 | $1,670 | $1.11 | 45d | 1 | 1.15mi |
Listing history 5 events
-
2026-06-21days on market $89,900 Active 5 DOM
-
2026-06-19days on market $89,900 Active 3 DOM
-
2026-06-18days on market $89,900 Active 2 DOM
-
2026-06-17remarks 699-char remark
-
2026-06-17$89,900 Active 1 DOM
ⓘ Source: listings_history table (triggers on properties + properties_extension) + one-shot
backfill from property_details.listing_events for pre-trigger history.
Tax reassessment forecast MO · Resets to sale price
- Current annual tax
- $467 · $39/mo
- Projected year-2 tax
- $872 · $73/mo
- Expected delta
- +$405/yr (+$34/mo · 86.6%)
ⓘ Screening estimate from a state-policy table — verify with the county assessor before closing.
Climate risk First Street
- Flood 1/10 Low FEMA zone X (unshaded) · 0% chance over 30 yrs
- Wildfire 3/10 Moderate
- Heat 4/10 Moderate 7 d/yr ≥106°F today · 18 d/yr by 30 yrs out
- Wind 2/10 Low
- Air quality 2/10 Low 0 unhealthy d/yr today · 1 by 30 yrs out
Nearby sold comps map
Loading sold comps map…
Walkable amenities ~0.75 mi
Loading nearby amenities…
Taxation est. · year 1
- Rental income
- $14,484
- − Mortgage interest
- −$5,036
- − Property taxes
- −$467
- − Insurance
- −$450
- − Repairs & maintenance
- −$1,159
- − Management
- −$1,159
- − Depreciation
- −$2,615
- Taxable income
- $3,599
- Est. tax owed @ 24.0%
- −$864
- After-tax cash flow
- $4,004/yr
For passive investors: Depreciation is non-cash, so a rental often shows a tax loss while cash-flowing — sheltering income. Rental losses are passive: they offset passive income freely, and up to $25,000/yr can offset ordinary (W-2) income if you actively participate and your MAGI is under $100k (phasing out to $0 by $150k); unused losses carry forward. On sale, claimed depreciation is recaptured at up to 25%, and gains may owe capital-gains tax (a 1031 exchange can defer both). Figures are a year-1 estimate at your 24.0% rate — not tax advice; consult a CPA.
Schools (NCES district)
- District
- Sedalia 200
- NCES district ID
- 2927830
- Math proficiency
- 47% ▼ -1.00%
- Reading proficiency
- 46% ▼ -3.00%
- Median HH income
- $37,452
- Composite
- 38.7/100
- National rank
- #4141
- State rank
- #89 of 324 in MO
Livability — Sedalia
- Score
- 71/100
- State rank
- #107
- US rank
- #6990
Category grades
Schools grade is shown separately in the Schools card above.
Census & demographics
- Census place
- Sedalia, MO
- County
- Pettis County · 35,091 people
- City population
- 35,091
- Metro
- Sedalia, MO
- Population (ZIP)
- 35,091
- Household income
- $58,064
- Rent vs Own
- Severe rent burden
- 1021.0
Population outlook (Pettis County) Hauer SSP2
- Today (2025)
- 41,992 people
- By 2030
- 41,584 · -1.0%
- By 2040
- 40,483 · -3.6%
- By 2050
- 39,049 · -7.0%
- By 2075
- 35,413 · -15.7%
- By 2100
- 30,870 · -26.5%
Race, ethnicity, and origin ACS 2023
- Neighborhood character
- Predominantly White (81%)
- Race & ethnicity
- White 81% Hispanic / Latino 10% Two or more races 7% Black 3%
- Hispanic origin (detail)
- Mexican 8%
- Common ancestry
- Subsaharan African 3% Lithuanian 2% Italian 1%
- Foreign-born
- 7% · Canada
- Languages at home
- 87% English-only · Spanish 7% Russian/Polish/Slavic 4% German/W. Germanic 1%
Political lean MEDSL · Pettis
- 2024 margin
- Solid R (+48.8) · D 24.9% · R 73.7% · Other 1.4%
- 2008→2024 swing
- -26.3pp toward R · 2008: -22.4pp · 2024: -48.8pp
- All cycles
- 2024: R+48.8 2020: R+47.5 2016: R+46.9 2012: R+28.8 2008: R+22.4
Not yet ingested
- Civics
- —
Market trends
- HPI YoY
- ▼ -81.80%
- Current HPI
- 292.8224
- Rent YoY
- —
- Metro
- Sedalia, MO
- State GDP YoY
- ▲ 1.84%
- F500 in state
- 20
Industry mix (Fortune 500 HQ in MO)
| Industry | F500 HQs | Revenue |
|---|---|---|
| Healthcare | 1 | $163B |
|
||
| Insurance | 1 | $21B |
|
||
| Industrial Technology | 1 | $17B |
|
||
| Retail | 1 | $16B |
|
||
| Industrial Distribution | 1 | $10B |
|
||
| Utilities | 1 | $9B |
|
||
Price history
+109.6% since first listed8 events — show timeline
- 2026-06-16 Listed $89,900 WCAR
- 2023-07-19 Sold (Public Records) — Public Records
- 2023-07-18 Sold (MLS) — WCAR
- 2023-06-07 Listed $77,500 WCAR
- 2020-07-01 Sold (MLS) — Heartland MLS as Distributed by MLS Grid
- 2020-03-03 Listed $42,900 Heartland MLS as Distributed by MLS Grid
- 1994-08-01 Sold (Public Records) — Public Records
- 1987-08-12 Sold (Public Records) — Public Records
Property tax history
+2.7%/yrLatest (2025): $467 · +35.1% YoY. Source: county tax records.
Cash-flow waterfall
monthlySold comps — $/sqft
last 12 mo · ≤1 miLoading sold comps…