 Duplex
1610 Nevada St · Toledo, OH
Flood risk 1/10 · Minimal
- FEMA flood zone
- X (unshaded)
- Chance of flooding over 30 yrs
- 0.0%
- Est. flood insurance / yr
- $507 – $1,088
Fire risk 1/10 · Minimal
- Est. fire insurance / yr
- $713 – $1,323
Heat risk 3/10 · Minor
- Hot days now (above 100°F)
- 7 days/yr
- Hot days in 30 yrs
- 16 days/yr
Wind risk 2/10 · Minimal
- Chance of severe wind over 30 yrs
- —
Air-quality risk 2/10 · Minimal
- Unhealthy air days now
- 1 days/yr
- Unhealthy air days in 30 yrs
- 2 days/yr
Risk factors via First Street. Map © Google.
Why this score? — see what drove the B- grade
The composite is a weighted blend of 9 inputs, each scored 0–100. Each bar is that input's sub-score; the figure is the points it added to the 100-point composite (weight × sub-score).
- Cash flow +30.0/30.0
- 1% rule +10.0/10.0
- DSCR +10.0/10.0
- ARV discount +7.1/15.0
- Rent growth +3.8/5.0
- Livability +3.3/5.0
- Condition / age +2.5/5.0
- Schools +1.6/10.0
- Appreciation +0.0/10.0
$75,000
🖨 Deal sheet 📄 Offer letter ✓ Due diligence
Multi-family units
County records classify this as Multi-Family (2-4 Unit). Listing-text estimate: 2 units. confirmed
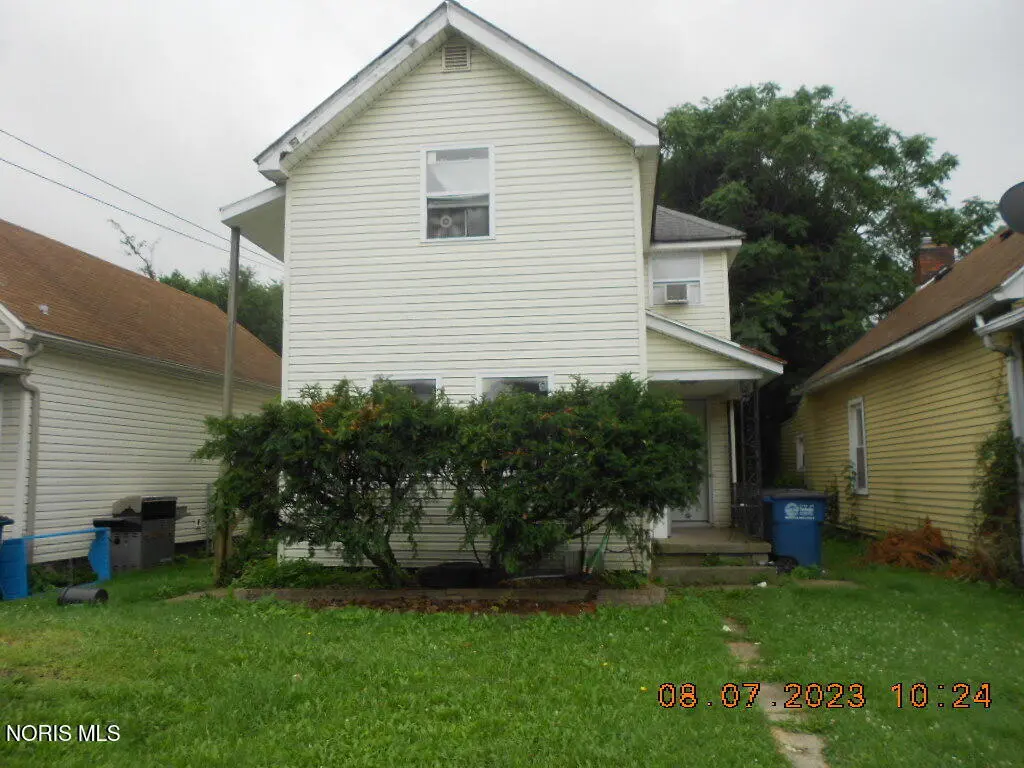
Listing remarks MLS
Nice 2 unit duplex each with 2 bedrooms, 1 bath, and individual washer/dryer hookup. Upper unit has gas forced air heat, and the lower unit has baseboard heat. Both units are rented at $560 a month. Tenants pay for electric and gas. Nice property for your investment portfolio. Off street parking in rear of the property.
Key facts
- Two unit duplex
- Off street parking
- Baseboard heat
Tags
Property features AI
Finance
- Other: Zoning: 10-RD6
- Financial info: Two-unit building with one unit leased and one unit vacant; Tenants pay cable TV, electricity, gas, and internet; Owner pays common area and exterior maintenance, grounds care, pest control, repairs, sewer, trash collection, water, insurance, management, snow removal, taxes, and lawn care
- HOA & community:
Exterior
- Parking: 2 parking spaces; Alley access; Accessible parking; Unpaved parking
- Security:
- Utilities: Public water; Sanitary sewer; Electricity available and connected; Natural gas available and connected; Cable connected; WiFi available; Circuit breaker electrical
- Home design: Residential income duplex; Two-story; Two levels
- Construction: Vinyl siding; Block foundation; Shingle roof; Built as a duplex
- Exterior features: Front porch; Chain link fencing
Interior
- Kitchen: Gas oven; Gas range connection; Refrigerator; Water heater
- Bedrooms:
- Flooring: Carpet; Linoleum; Wood
- Bathrooms:
- Heating & cooling: Baseboard heating; Forced air heating
- Interior features: Other; Interior entry partial unfinished basement
- Laundry & utility: Washer hookup in unit; Electric dryer hookup in unit
Neighborhood map
What this means for you Summary
Snapshot
- This is a 2 × 2-bed/1-bath units multifamily listed at $75k.
Deal economics
- At list price, monthly cash flow is $998 ($12k/yr) — positive. Per door: $499/mo.
- The deal already cash-flows at list — no discount required.
- Meets the 1% rule at list price ($2k rent vs $75k).
- Recommended offer: $74k (1.5% below list) — sets the bar for market timing.
- Cap rate 22.3% vs local median 7.6% in Toledo — top-decile yield for the area; either an underpriced asset or a hidden risk that comps aren't pricing in. Stress-test before assuming the spread holds.
Location & tenants
- Location reads 66/100 on livability (#645 in OH) — a middle-class / working-renter tenant base. Strengths: cost of living A+, housing A+, health & safety A+; Watch: amenities C-, crime F, commute F.
- Toledo City (urban): math 15% / reading 24% proficiency, ranked #634 of 656 in OH (top 97%) — low school quality limits family demand, transient renter base, plan for 1-2y turnover; 72% free/reduced lunch — lower-income household profile, screen leases tightly.
- Zoned schools: Raymer Elementary School (math 14% / reading 16%, grade F, #1,377 of 1,584 statewide, top 87%, 424 students, 0% FRL); Waite High School (math 12% / reading 24%, grade F, #687 of 781 statewide, top 88%, 997 students, 0% FRL) — zoned schools average 0% FRL vs 72% district-wide (72 pts lower); this property's tenant base skews higher-income than the district average.
- Market conditions: Rents rising fast (+5.4%/yr); 117 active listings in the ZIP; 8 comparable units currently listed for rent nearby; rentals at typical pace (median 21d on market — plan ~3-4 weeks tenant-placement turnaround); lower-income renter base — watch delinquency; 415 units permitted in Lucas County in 2024 (122 in 5+ unit buildings).
- At $1,920/mo this rent would consume 59% of the median local household income ($39k/yr) (locally 1257% of renters already pay >50% of income on rent) — very limited rent-growth headroom before tenants either downsize or default.
Forward outlook
- Local home prices are declining (-3.0%/yr); year-one equity from $519 of loan paydown is wiped out by about $2k of value loss. Plan a longer hold.
- Lucas County population projected at -16% by 2050 — secular population decline; favor cash flow + early exit over multi-decade hold.
- At projected returns (-3.0% appreciation + 5.4% rent growth), your $21k cash investment doubles in ~2 years — after that, you're playing with house money.
Negotiation context
- It's been on market 16 days — a 2% lower offer ($74k) is reasonable based on typical stale-listing flexibility.
- 3 sale attempts since 9y ago with the ask held roughly flat each time — persistent listings suggest the price (not the market) is what's stuck; bring a comps-based counter.
- Current owner paid $46k; list at $75k implies a 63% gain — meaningful room to come down on a strong offer.
Risks & watch-outs
- Watch-outs: built in 1892 — expect roof / HVAC / electrical / plumbing capex.
Questions for the listing agent
- Can we see the unit-by-unit rent roll, current vacancy, and any below-market leases? What's the average tenancy length?
- What capital expenditures (roof, boiler, parking lot, exteriors) have been made in the last 5 years, and what's planned in the next 2?
- Built in 1892 — when were the roof, HVAC, electrical panel, plumbing, and water heater last replaced?
- Is there a deadline driving the sale (1031 exchange, divorce, estate, relocation)? That informs how much negotiation room exists.
- Schools are D-rated, which usually means shorter tenancies and higher turnover. Who's the typical renter profile here, and what's been the actual vacancy rate?
- Crime grade is F in this area — have there been break-ins, vandalism, or insurance claims at this property in the last 3 years? What carrier currently insures it and at what premium?
- What's the average days-on-market for RENTAL listings here right now (not sales)? A rising rental-DOM trend means longer vacancies and softer asking-rent achievability than the comps imply.
- What's the recent tenant-quality profile in this submarket — average credit score on applications, eviction rate, late-payment / NSF rate, and stable-employment percentage? A property-management company in the area should have these aggregated.
- How much new apartment / multifamily construction is in the pipeline within 1–3 miles? Heavy new supply (>2% of stock underway) typically softens rents 12–24 months out; light construction supports rent growth.
Investment metrics
- 1% rule
- 2.56% ✓
- Cap rate
- 22.26%
- Cash-on-cash
- 57.02%
- DSCR
- 3.54
- GRM
- 3.3
CMA / ARV
- ARV (on-the-fly)
- $74,328
- Comps found
- 5
Show comp detail 5 sales within ~0.75 mi
| Address | Dist | Beds/Ba | Sqft | Sold | Price | $/sf | Match |
|---|---|---|---|---|---|---|---|
| 1326 Idaho St | 0.20mi | 4/2.0 | 1,854 (-5%) | 24mo | $70,000 | $38 | 62 |
| 425 Arden Pl | 0.70mi | 4/2.0 | 1,936 (-1%) | 13mo | $60,000 | $31 | 55 |
| 1030 E Broadway St | 0.72mi | 4/2.0 | 2,095 (+7%) | 12mo | $105,000 | $50 | 44 |
| 912 E Broadway St | 0.58mi | 4/2.0 | 2,160 (+10%) | 14mo | $67,500 | $31 | 44 |
| 621 Nevada St | 0.63mi | 5/2.0 (+1) | 1,736 (-11%) | 11mo | $104,900 | $60 | 38 |
Match score weights: distance 35% · size 25% · config 20% · recency 20%. Top-matched comps best support the ARV.
Projected returns pro-forma
-3.0% appreciation · 5.37% rent growth · sell at horizon
- IRR
- 58.2%
- Equity multiple
- 3.67×
- Total profit
- $56,120
- Equity at exit
- $11,183
- IRR
- 63.8%
- Equity multiple
- 8.19×
- Total profit
- $151,015
- Equity at exit
- $6,485
Cash invested: $21,000 (down + closing). Projections, not guarantees.
Landlord ↔ Tenant lean methodology
- Overall (STATE)
- 73 Landlord-Friendly
- State Ohio
- 73 Landlord-Friendly · R+6
- County
- — inherits STATE
- City
- — inherits STATE
ZIP-level market 43605
- Home prices YoY
- -25.6%
- Rents YoY
- 5.4%
- Active inventory
- 117
- Price-to-rent
- 6.5×
Monthly cashflow live
- Estimated rent
- $1,920 high interval (Pro) →
- Mortgage (P&I)
- −$393
- Tax from tax record
- −$94 /mo · $1,132/yr
- Insurance
- −$31
- HOA
- −$0
- Vacancy / Maint / Mgmt
- −$403
- Net cashflow
- $998
Break-even live
2-unit breakdown (identical units grouped — click to expand)
| Units | Beds | Baths | Est. rent |
|---|---|---|---|
| 2× units | 2 | 1 | $1,920 |
| #1 | 2 | 1 | $960 |
| #2 | 2 | 1 | $960 |
| Total (2 units) | $1,920 | ||
UW: 25.0% down · 7.5% · 30yr · 1.5% tax · 5.0% vac · 8.0% maint · 8.0% mgmt
Financing live
Cash to close
- Down payment
- $18,750
- Closing costs
- $2,250
- Reserves months
- —
- Total cash needed
- —
Loan-product check · same deal, 3 products live
Conventional
25% down · 7.5% · 30yr
- Down + closing
- —
- Monthly P&I
- —
- Monthly cashflow
- —
- DSCR
- —
- Eligible?
- —
Personal DTI + credit; lowest rate.
DSCR
20% down · 8.5% · 30yr
- Down + closing
- —
- Monthly P&I
- —
- Monthly cashflow
- —
- DSCR
- —
- Eligible?
- —
No personal income docs; deal must DSCR.
Hard money
10% down · 12.0% · 12mo
- Down + closing
- —
- Monthly P&I
- —
- Monthly cashflow
- —
- DSCR
- —
- Eligible?
- —
Short-term bridge; refi at stabilization.
Rent comps 8 comps
| Address | Beds | Baths | Sqft | Rent | $/sqft | DOM | Units | Dist |
|---|---|---|---|---|---|---|---|---|
| 1505 Navarre Ave Toledo, OH | 3.0 | 1.0 | 1331 | $1,145 | $0.86 | 43d | 1 | 0.25mi |
| 2129 Nevada St Toledo, OH | 3.0 | 1.0 | 1352 | $1,200 | $0.89 | 14d | 1 | 0.51mi |
| 245 Plymouth St Toledo, OH | 3.0 | 1.0 | 1600 | $1,125 | $0.70 | 14d | 1 | 0.52mi |
| 29 Garfield Pl Toledo, OH | 4.0 | 2.0 | 1300 | $1,250 | $0.96 | 14d | 1 | 0.65mi |
| 414 Platt St Unit ST-3 Toledo, OH | 3.0 | 1.0 | 1500 | $1,150 | $0.77 | 23d | 1 | 0.74mi |
| 606 Earl St Toledo, OH | 3.0 | 1.5 | 1700 | $1,150 | $0.68 | 21d | 1 | 0.84mi |
| 1306 Mott Ave Toledo, OH | 3.0 | 1.5 | 1282 | $1,149 | $0.90 | 43d | 1 | 0.85mi |
| 20 Greenwood Ave Toledo, OH | 3.0 | 1.0 | 1496 | $1,150 | $0.77 | 14d | 1 | 1.17mi |
Listing history 12 events
-
2026-06-18days on market $75,000 Active 16 DOM
-
2026-06-17days on market $75,000 Active 15 DOM
-
2026-06-16days on market $75,000 Active 14 DOM
-
2026-06-15days on market $75,000 Active 13 DOM
-
2026-06-14days on market $75,000 Active 11 DOM
-
2026-06-10days on market $75,000 Active 8 DOM
-
2026-06-09days on market $75,000 Active 7 DOM
-
2026-06-08days on market $75,000 Active 6 DOM
-
2026-06-07days on market $75,000 Active 5 DOM
-
2026-06-05days on market $75,000 Active 2 DOM
-
2026-06-03remarks 360-char remark
-
2026-06-03$75,000 Active 1 DOM
ⓘ Source: listings_history table (triggers on properties + properties_extension) + one-shot
backfill from property_details.listing_events for pre-trigger history.
Tax reassessment forecast OH · Partial reset (capped growth)
- Current annual tax
- $1,132 · $94/mo
- Projected year-2 tax
- $1,151 · $96/mo
- Expected delta
- +$19/yr (+$2/mo · 1.7%)
ⓘ Screening estimate from a state-policy table — verify with the county assessor before closing.
Climate risk First Street
- Flood 1/10 Low FEMA zone X (unshaded) · 0% chance over 30 yrs
- Wildfire 1/10 Low
- Heat 3/10 Moderate 7 d/yr ≥100°F today · 16 d/yr by 30 yrs out
- Wind 2/10 Low
- Air quality 2/10 Low 1 unhealthy d/yr today · 2 by 30 yrs out
Nearby sold comps map
Loading sold comps map…
Walkable amenities ~0.75 mi
Loading nearby amenities…
Taxation est. · year 1
- Rental income
- $23,040
- − Mortgage interest
- −$4,201
- − Property taxes
- −$1,132
- − Insurance
- −$375
- − Repairs & maintenance
- −$1,843
- − Management
- −$1,843
- − Depreciation
- −$2,182
- Taxable income
- $11,464
- Est. tax owed @ 24.0%
- −$2,751
- After-tax cash flow
- $9,224/yr
For passive investors: Depreciation is non-cash, so a rental often shows a tax loss while cash-flowing — sheltering income. Rental losses are passive: they offset passive income freely, and up to $25,000/yr can offset ordinary (W-2) income if you actively participate and your MAGI is under $100k (phasing out to $0 by $150k); unused losses carry forward. On sale, claimed depreciation is recaptured at up to 25%, and gains may owe capital-gains tax (a 1031 exchange can defer both). Figures are a year-1 estimate at your 24.0% rate — not tax advice; consult a CPA.
Schools (NCES district)
- District
- Toledo City
- NCES district ID
- 3904490
- Math proficiency
- 15% ▼ -16.00%
- Reading proficiency
- 24% ▼ -13.00%
- Median HH income
- $32,137
- Composite
- 15.76/100
- National rank
- #9276
- State rank
- #634 of 656 in OH
Livability — Toledo
- Score
- 66/100
- State rank
- #645
- US rank
- #11442
Category grades
Schools grade is shown separately in the Schools card above.
Census & demographics
- Census place
- Toledo, OH
- County
- Lucas County · 380,724 people
- City population
- 280,811
- Metro
- Toledo, OH
- Population (ZIP)
- 24,441
- Household income
- $39,118
- Rent vs Own
- Severe rent burden
- 1257.0
Population outlook (Lucas County) Hauer SSP2
- Today (2025)
- 420,751 people
- By 2030
- 410,187 · -2.5%
- By 2040
- 384,019 · -8.7%
- By 2050
- 355,125 · -15.6%
- By 2075
- 291,683 · -30.7%
- By 2100
- 233,670 · -44.5%
Race, ethnicity, and origin ACS 2023
- Neighborhood character
- Diverse neighborhood (Simpson 0.61)
- Race & ethnicity
- White 57% Hispanic / Latino 21% Black 14% Two or more races 14%
- Hispanic origin (detail)
- Mexican 17% Puerto Rican 2%
- Common ancestry
- Romanian 3% Lithuanian 2% Portuguese 1%
- Foreign-born
- 3% · Canada
- Languages at home
- 91% English-only · Spanish 7% Arabic 1%
Political lean MEDSL · Lucas
- 2024 margin
- D (+12.6) · D 55.8% · R 43.2%
- 2008→2024 swing
- -18.9pp toward R · 2008: 31.4pp · 2024: 12.6pp
- All cycles
- 2024: D+12.6 2020: D+16.8 2016: D+17.4 2012: D+30.4 2008: D+31.4
Not yet ingested
- Civics
- —
Market trends
- HPI YoY
- ▼ -47.85%
- Current HPI
- 138.6894
- Rent YoY
- ▲ 5.37%
- Metro
- Toledo, OH
- State GDP YoY
- ▲ 1.98%
- F500 in state
- 48
Industry mix (Fortune 500 HQ in OH)
| Industry | F500 HQs | Revenue |
|---|---|---|
| Insurance | 3 | $145B |
|
||
| Industrial Machinery | 3 | $49B |
|
||
| Financial Services | 3 | $24B |
|
||
| Consumer Goods | 2 | $93B |
|
||
| Aerospace / Defense | 2 | $47B |
|
||
| Utilities | 2 | $33B |
|
||
Price history
+341.2% since first listed11 events — show timeline
- 2026-06-01 Listed $75,000 NORIS
- 2025-10-14 Price Changed $46,000 NORIS
- 2025-10-14 Price Changed $14,000 NORIS
- 2023-09-25 Sold (Public Records) $46,000 Public Records
- 2023-09-22 Sold (MLS) $46,000 NORIS
- 2023-08-16 Pending — NORIS
- 2023-08-10 Listed $50,000 NORIS
- 2018-02-28 Sold (Public Records) $14,000 Public Records
- 2018-02-26 Sold (MLS) $14,000 NORIS
- 2017-08-14 Listed $23,900 NORIS
- 1995-02-15 Sold (Public Records) $17,000 Public Records
Property tax history
-0.2%/yrLatest (2025): $1,132 · +1.1% YoY. Source: county tax records.
Cash-flow waterfall
monthlySold comps — $/sqft
last 12 mo · ≤1 miLoading sold comps…