21001 Plummer #75 · Los Angeles, CA
Flood risk 2/10 · Minimal
- FEMA flood zone
- X (unshaded)
- Chance of flooding over 30 yrs
- 0.07%
- Est. flood insurance / yr
- $507 – $1,088
Fire risk 3/10 · Minor
- Est. fire insurance / yr
- $659 – $1,223
Heat risk 5/10 · Moderate
- Hot days now (above 100°F)
- 7 days/yr
- Hot days in 30 yrs
- 19 days/yr
Wind risk 1/10 · Minimal
- Chance of severe wind over 30 yrs
- —
Air-quality risk 4/10 · Minor
- Unhealthy air days now
- 5 days/yr
- Unhealthy air days in 30 yrs
- 7 days/yr
Risk factors via First Street. Map © Google.
Why this score? — see what drove the C+ grade
The composite is a weighted blend of 9 inputs, each scored 0–100. Each bar is that input's sub-score; the figure is the points it added to the 100-point composite (weight × sub-score).
- Cash flow +29.3/30.0
- DSCR +10.0/10.0
- 1% rule +8.2/10.0
- Schools +3.6/10.0
- Rent growth +3.4/5.0
- Livability +3.4/5.0
- ARV discount +3.3/15.0
- Condition / age +2.5/5.0
- Appreciation +0.0/10.0
$190,000
🖨 Deal sheet 📄 Offer letter ✓ Due diligence
Listing remarks MLS
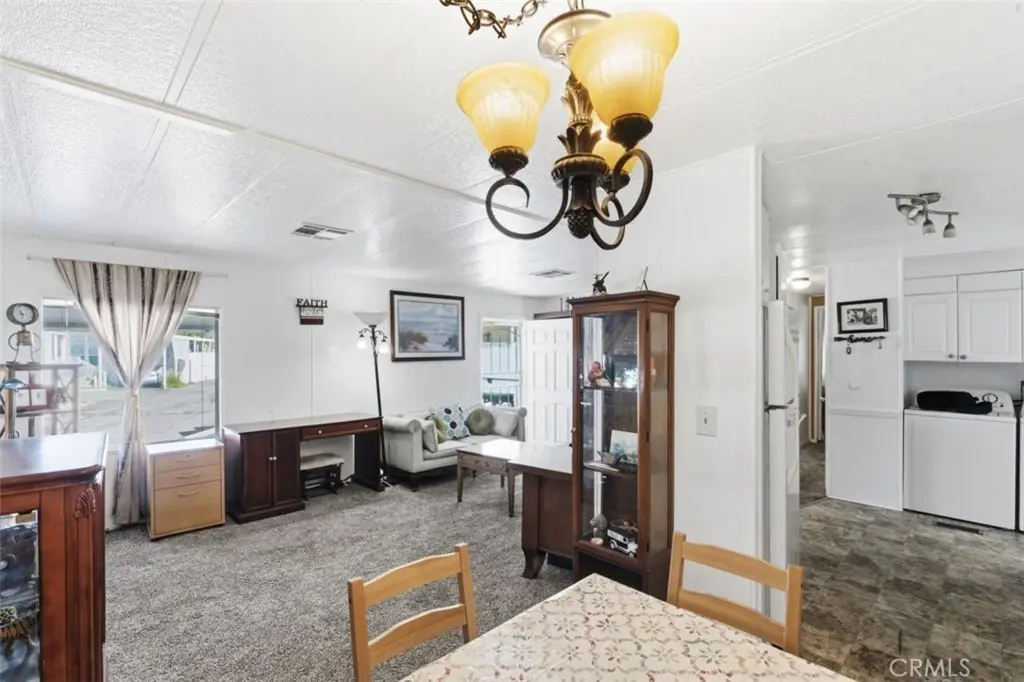
Well-maintained home in a desirable Chatsworth community featuring a functional floor plan with bright living spaces and abundant natural light. The kitchen offers ample cabinetry and workspace, while the bedrooms provide comfortable accommodations. Additional highlights include in-unit storage, designated parking, and a private outdoor area. Located within a 55+ community offering landscaped grounds and recreational amenities (buyer to verify). Conveniently situated near shopping, dining, parks, and major transportation routes.
Key facts
- Ample cabinetry
- In-unit storage
- Landscaped grounds
Tags
Neighborhood map
What this means for you Summary
Snapshot
- This is a 2-bed/2.0-bath manufactured listed at $190k.
Deal economics
- At list price, monthly cash flow is $670 ($8k/yr) — positive.
- The deal already cash-flows at list — no discount required.
- Meets the 1% rule at list price ($3k rent vs $190k).
- Recommended offer: $179k (6.0% below list) — sets the bar for market timing.
- Cap rate 10.5% vs local median 2.1% in Los Angeles — top-decile yield for the area; either an underpriced asset or a hidden risk that comps aren't pricing in. Stress-test before assuming the spread holds.
Location & tenants
- Location reads 68/100 on livability (#273 in CA) — a middle-class / working-renter tenant base. Strengths: amenities A+, commute A+, employment B; Watch: health & safety C-, schools D+, crime F.
- Los Angeles Unified (urban): math 29% / reading 54% proficiency, ranked #223 of 517 in CA (top 43%) — families likely to look elsewhere, expect single-tenant / working-renter base with shorter leases; 67% free/reduced lunch — lower-income household profile, screen leases tightly.
- Market conditions: Rents rising (+3.4%/yr); 192 active listings in the ZIP; 40 comparable units currently listed for rent nearby; rentals at typical pace (median 17d on market — plan ~3-4 weeks tenant-placement turnaround); high-income renter base; 19,697 units permitted in Los Angeles County in 2024 (9,426 in 5+ unit buildings).
Forward outlook
- Local home prices are declining (-3.0%/yr); year-one equity from $1k of loan paydown is wiped out by about $6k of value loss. Plan a longer hold.
- Los Angeles County population projected at +9% by 2050 — modest demand growth; plan on rents tracking national, not racing it.
- At projected returns (-3.0% appreciation + 3.4% rent growth), your $53k cash investment doubles in ~8 years — after that, you're playing with house money.
Negotiation context
- It's been on market 70 days — a 6% lower offer ($179k) is reasonable based on typical stale-listing flexibility.
- 4 sale attempts since 22y ago with the ask held roughly flat each time — persistent listings suggest the price (not the market) is what's stuck; bring a comps-based counter.
- Current owner paid $109k; list at $190k implies a 74% gain — meaningful room to come down on a strong offer.
Risks & watch-outs
- Climate carrying-cost: extreme-heat days projected 7→19/yr by 2055 (HVAC capex compounding) — expect insurance premiums to compound above CPI over the hold.
Questions for the listing agent
- It's been on market 70 days. Have you received any prior offers? Is the seller open to a 6% concession, seller financing, or rate buy-down credit?
- Built in 1972 — when were the roof, HVAC, electrical panel, plumbing, and water heater last replaced?
- Why hasn't it sold? Are there any deal-killer items the seller is aware of (foundation, flood, title, zoning, code violations)?
- Is there a deadline driving the sale (1031 exchange, divorce, estate, relocation)? That informs how much negotiation room exists.
- Schools are D-rated, which usually means shorter tenancies and higher turnover. Who's the typical renter profile here, and what's been the actual vacancy rate?
- Crime grade is F in this area — have there been break-ins, vandalism, or insurance claims at this property in the last 3 years? What carrier currently insures it and at what premium?
- What's the average days-on-market for RENTAL listings here right now (not sales)? A rising rental-DOM trend means longer vacancies and softer asking-rent achievability than the comps imply.
- What's the recent tenant-quality profile in this submarket — average credit score on applications, eviction rate, late-payment / NSF rate, and stable-employment percentage? A property-management company in the area should have these aggregated.
- How much new for-sale + rental construction is in the pipeline within 1–3 miles? Heavy new supply typically softens prices + rents 12–24 months out; constrained supply supports both.
Investment metrics
- 1% rule
- 1.32% ✓
- Cap rate
- 10.53%
- Cash-on-cash
- 15.12%
- DSCR
- 1.67
- GRM
- 6.3
CMA / ARV
- ARV (median comp)
- $173,669
- List price
- $190,000
- Delta
- 9.40%
- Verdict
- FAIR
- Comps
- 10 within 1.0 mi
Show comp detail 3 sales within ~0.75 mi
| Address | Dist | Beds/Ba | Sqft | Sold | Price | $/sf | Match |
|---|---|---|---|---|---|---|---|
| 21001 Plummer St #12 | 0.00mi | 2/2.0 | 838 (+5%) | 8mo | $180,000 | $215 | 86 |
| 21001 Plummer St #72 | 0.06mi | 2/1.0 | 800 (0%) | 9mo | $127,000 | $159 | 86 |
| 21001 Plummer St #45 | 0.06mi | 1/1.0 (-1) | 846 (+6%) | 18mo | $140,000 | $165 | 64 |
Match score weights: distance 35% · size 25% · config 20% · recency 20%. Top-matched comps best support the ARV.
Projected returns pro-forma
-3.0% appreciation · 3.41% rent growth · sell at horizon
- IRR
- 6.2%
- Equity multiple
- 1.24×
- Total profit
- $12,977
- Equity at exit
- $28,330
- IRR
- 16.0%
- Equity multiple
- 2.33×
- Total profit
- $70,725
- Equity at exit
- $16,428
Cash invested: $53,200 (down + closing). Projections, not guarantees.
Landlord ↔ Tenant lean methodology
- Overall (CITY)
- 0 Strongly Tenant-Friendly
- State California
- 18 Strongly Tenant-Friendly · D+13
- County
- — inherits STATE
- City Los Angeles
- 0 Strongly Tenant-Friendly · D+22
ZIP-level market 91311
- Rents YoY
- 3.4%
- Active inventory
- 192
- Price-to-rent
- 6.3×
Monthly cashflow live
- Estimated rent
- $2,510 high interval (Pro) →
- Mortgage (P&I)
- −$996
- Tax est. 1.5%
- −$238 /mo · $2,850/yr
- Insurance
- −$79
- HOA
- −$0
- Vacancy / Maint / Mgmt
- −$527
- Net cashflow
- $670
Break-even live
UW: 25.0% down · 7.5% · 30yr · 1.5% tax · 5.0% vac · 8.0% maint · 8.0% mgmt
Financing live
Cash to close
- Down payment
- $47,500
- Closing costs
- $5,700
- Reserves months
- —
- Total cash needed
- —
Loan-product check · same deal, 3 products live
Conventional
25% down · 7.5% · 30yr
- Down + closing
- —
- Monthly P&I
- —
- Monthly cashflow
- —
- DSCR
- —
- Eligible?
- —
Personal DTI + credit; lowest rate.
DSCR
20% down · 8.5% · 30yr
- Down + closing
- —
- Monthly P&I
- —
- Monthly cashflow
- —
- DSCR
- —
- Eligible?
- —
No personal income docs; deal must DSCR.
Hard money
10% down · 12.0% · 12mo
- Down + closing
- —
- Monthly P&I
- —
- Monthly cashflow
- —
- DSCR
- —
- Eligible?
- —
Short-term bridge; refi at stabilization.
Rent comps 40 comps
| Address | Beds | Baths | Sqft | Rent | $/sqft | DOM | Units | Dist |
|---|---|---|---|---|---|---|---|---|
| 9901 Independence Ave Unit D Chatsworth, CA | 2.0 | 2.0 | 1096 | $3,400 | $3.10 | 43d | 1 | 0.43mi |
| 9920 De Soto Ave Chatsworth, CA | 2.0 | 1.0 | 898 | $2,295 | $2.56 | 24d | 3 | 0.49mi |
| 20341 Itasca St Unit B Chatsworth, CA | 2.0 | 1.0 | 800 | $2,900 | $3.62 | 43d | 1 | 0.82mi |
| 21721 Septo St Chatsworth, CA | 1.0 | 1.0 | 755 | $1,775 | $2.35 | 15d | 2 | 0.83mi |
| 10200 De Soto Ave Chatsworth, CA | 1.0–2.0 | 1.0–2.0 | 925 | $2,400 | $2.59 | 15d | 4 | 0.84mi |
| 21744 Septo St Unit 219 Chatsworth, CA | 1.0 | 1.0 | 770 | $2,000 | $2.60 | 24d | 1 | 0.84mi |
| 10017 Mason Ave Unit A Chatsworth, CA | 2.0 | 1.0 | 870 | $2,800 | $3.22 | 24d | 1 | 0.85mi |
| 10216 Eton Ave Unit 110 Chatsworth, CA | 2.0 | 2.5 | 1120 | $2,898 | $2.59 | 24d | 1 | 0.85mi |
| 10247 Variel Ave Chatsworth, CA | 2.0 | 2.0 | 876 | $2,725 | $3.11 | 3d | 2 | 0.88mi |
| 21018 Gresham St Canoga Park, CA | 2.0 | 2.0 | 825 | $2,395 | $2.90 | 22d | 1 | 0.95mi |
| 10201 Remmet Ave Chatsworth, CA | 2.0 | 2.0 | 1005 | $2,395 | $2.38 | 24d | 1 | 0.97mi |
| 10201 Remmet Ave Unit 203 Chatsworth, CA | 2.0 | 2.0 | 1005 | $2,395 | $2.38 | 22d | 1 | 0.97mi |
| 9733 Topanga Canyon Blvd Chatsworth, CA | 2.0–3.0 | 2.0 | 1204 | $2,935 | $2.44 | 2d | 4 | 0.97mi |
| 8761 De Soto Ave Canoga Park, CA | 1.0–3.0 | 1.5–2.5 | 1025 | $2,920 | $2.85 | 2d | 8 | 0.98mi |
| 9101 Topanga Canyon Blvd Chatsworth, CA | 2.0 | 2.0 | 1022 | $2,620 | $2.56 | 7d | 1 | 1.00mi |
| 8930 Topanga Canyon Blvd Canoga Park, CA | 2.0 | 1.0 | 850 | $2,465 | $2.90 | 1d | 1 | 1.02mi |
| 8726 Independence Ave Unit 219I Canoga Park, CA | 1.0 | 1.0 | 650 | $2,050 | $3.15 | 43d | 1 | 1.02mi |
| 8731 De Soto Ave Apt 109 Canoga Park, CA | 1.0 | 1.0 | 800 | $1,795 | $2.24 | 7d | 1 | 1.03mi |
| 10227 Mason Ave Chatsworth, CA | 3.0 | 2.0 | 1060 | $3,195 | $3.01 | 7d | 1 | 1.03mi |
| 9035 Topanga Canyon Blvd West Hills, CA | 1.0 | 1.0 | 600 | $2,146 | $3.58 | 7d | 1 | 1.04mi |
| 8700 De Soto Ave Canoga Park, CA | 1.0–2.0 | 1.0–2.0 | 775 | $2,695 | $3.48 | 1d | 2 | 1.06mi |
| 20909 Parthenia St Canoga Park, CA | 1.0–2.0 | 1.0–1.5 | 745 | $2,438 | $3.27 | 1d | 6 | 1.07mi |
| 21031 Parthenia St Canoga Park, CA | 1.0–2.0 | 1.0–2.0 | 905 | $2,584 | $2.86 | 2d | 9 | 1.07mi |
| 8719 Variel Ave Canoga Park, CA | 1.0–3.0 | 1.0–2.0 | 948 | $2,532 | $2.67 | 7d | 3 | 1.08mi |
| 9225 Topanga Canyon Blvd Chatsworth, CA | 1.0 | 1.0 | 623 | $1,984 | $3.18 | 1d | 5 | 1.11mi |
| 20930 Parthenia St Canoga Park, CA | 1.0 | 1.0 | 637 | $1,975 | $3.10 | 43d | 2 | 1.11mi |
| 21000 Parthenia St #17 Canoga Park, CA | 1.0 | 1.0 | 700 | $1,650 | $2.36 | 43d | 1 | 1.11mi |
| 21040 Parthenia St #29 Canoga Park, CA | 2.0 | 2.5 | 1065 | $2,700 | $2.54 | 43d | 1 | 1.11mi |
| 8609 De Soto Ave Canoga Park, CA | 1.0 | 1.0 | 623 | $1,890 | $3.03 | 1d | 1 | 1.12mi |
| 9413 Farralone Ave Chatsworth, CA | 2.0 | 2.0 | 680 | $2,550 | $3.75 | 43d | 1 | 1.14mi |
| 21350 Parthenia St Unit 108 Canoga Park, CA | 2.0 | 2.0 | 1000 | $2,495 | $2.50 | 16d | 1 | 1.16mi |
| 9019 Farralone Ave Chatsworth, CA | 1.0 | 1.0 | 575 | $2,300 | $4.00 | 20d | 1 | 1.17mi |
| 8805 Delco Ave Winnetka, CA | 2.0 | 1.0 | 750 | $2,650 | $3.53 | 7d | 1 | 1.18mi |
| 21000 Bryant St #6 Canoga Park, CA | 2.0 | 2.0 | 992 | $2,600 | $2.62 | 24d | 1 | 1.19mi |
| 20431 Acre St Winnetka, CA | 1.0 | 1.0 | 800 | $2,300 | $2.88 | 24d | 1 | 1.19mi |
| 8750 Topanga Canyon Blvd Unit 6 Canoga Park, CA | 2.0 | 2.0 | 900 | $2,195 | $2.44 | 16d | 1 | 1.19mi |
| 20954 Bryant St Unit 17 Canoga Park, CA | 1.0 | 1.0 | 600 | $1,595 | $2.66 | 43d | 1 | 1.20mi |
| 8561 De Soto Ave Canoga Park, CA | 1.0 | 1.0 | 750 | $1,950 | $2.60 | 7d | 4 | 1.20mi |
| 10537 Variel Ave Chatsworth, CA | 2.0 | 2.0 | 900 | $2,995 | $3.33 | 2d | 1 | 1.24mi |
| 8601 International Ave Canoga Park, CA | 2.0–3.0 | 2.0 | 980 | $2,300 | $2.35 | 24d | 2 | 1.27mi |
Listing history 25 events
-
2026-06-18days on market $190,000 Active 70 DOM
-
2026-06-17days on market $190,000 Active 69 DOM
-
2026-06-16days on market $190,000 Active 68 DOM
-
2026-06-15days on market $190,000 Active 67 DOM
-
2026-06-13days on market $190,000 Active 65 DOM
-
2026-06-09days on market $190,000 Active 61 DOM
-
2026-06-08days on market $190,000 Active 60 DOM
-
2026-06-07days on market $190,000 Active 59 DOM
-
2026-06-04days on market $190,000 Active 56 DOM
-
2026-06-03days on market $190,000 Active 55 DOM
-
2026-06-02days on market $190,000 Active 54 DOM
-
2026-06-01days on market $190,000 Active 53 DOM
-
2026-05-31days on market $190,000 Active 52 DOM
-
2026-04-09$190,000 Active 534-char remark
Show marketing remark (534 chars)
Well-maintained home in a desirable Chatsworth community featuring a functional floor plan with bright living spaces and abundant natural light. The kitchen offers ample cabinetry and workspace, while the bedrooms provide comfortable accommodations. Additional highlights include in-unit storage, designated parking, and a private outdoor area. Located within a 55+ community offering landscaped grounds and recreational amenities (buyer to verify). Conveniently situated near shopping, dining, parks, and major transportation routes.
-
2023-08-17soldstatus $109,000 Closed Sale 497-char remark
Show marketing remark (497 chars)
SENIOR PARK 55 AND OLDER COMMUNITY. WITH ONE OF THE LOWEST SPACE RENT IN THE CITY OF CHATSWORTH. RECENTLY REMODELED: ALL NEW PAINT THRU OUT INTERIOR OF THE HOME AND NEW CARPET. HOME HAS 2 BR, 2BATHS, DINING AREA, AND AN EXPANDED AREA THAT MAY BE USED FOR AN OFFICE, SITTING ROOM, OR POSSIBLY ANOTHER ROOM, WITH SEPARATE ENTRY. THE PARK OFFERS A COMMUNITY POOL & JACUZZI, A SPACIOUS RECREATION RO0M WITH WORKOUT EQUIPMENT, A POOL TABLE, A PING PONG TABLE, FULL KITCHEN, FOR USE AND ENJOYMENT.
-
2023-08-10historical Active Under Contract 497-char remark
Show marketing remark (497 chars)
SENIOR PARK 55 AND OLDER COMMUNITY. WITH ONE OF THE LOWEST SPACE RENT IN THE CITY OF CHATSWORTH. RECENTLY REMODELED: ALL NEW PAINT THRU OUT INTERIOR OF THE HOME AND NEW CARPET. HOME HAS 2 BR, 2BATHS, DINING AREA, AND AN EXPANDED AREA THAT MAY BE USED FOR AN OFFICE, SITTING ROOM, OR POSSIBLY ANOTHER ROOM, WITH SEPARATE ENTRY. THE PARK OFFERS A COMMUNITY POOL & JACUZZI, A SPACIOUS RECREATION RO0M WITH WORKOUT EQUIPMENT, A POOL TABLE, A PING PONG TABLE, FULL KITCHEN, FOR USE AND ENJOYMENT.
-
2023-07-20status Pending Sale 497-char remark
Show marketing remark (497 chars)
SENIOR PARK 55 AND OLDER COMMUNITY. WITH ONE OF THE LOWEST SPACE RENT IN THE CITY OF CHATSWORTH. RECENTLY REMODELED: ALL NEW PAINT THRU OUT INTERIOR OF THE HOME AND NEW CARPET. HOME HAS 2 BR, 2BATHS, DINING AREA, AND AN EXPANDED AREA THAT MAY BE USED FOR AN OFFICE, SITTING ROOM, OR POSSIBLY ANOTHER ROOM, WITH SEPARATE ENTRY. THE PARK OFFERS A COMMUNITY POOL & JACUZZI, A SPACIOUS RECREATION RO0M WITH WORKOUT EQUIPMENT, A POOL TABLE, A PING PONG TABLE, FULL KITCHEN, FOR USE AND ENJOYMENT.
-
2023-06-19historical Active Under Contract 497-char remark
Show marketing remark (497 chars)
SENIOR PARK 55 AND OLDER COMMUNITY. WITH ONE OF THE LOWEST SPACE RENT IN THE CITY OF CHATSWORTH. RECENTLY REMODELED: ALL NEW PAINT THRU OUT INTERIOR OF THE HOME AND NEW CARPET. HOME HAS 2 BR, 2BATHS, DINING AREA, AND AN EXPANDED AREA THAT MAY BE USED FOR AN OFFICE, SITTING ROOM, OR POSSIBLY ANOTHER ROOM, WITH SEPARATE ENTRY. THE PARK OFFERS A COMMUNITY POOL & JACUZZI, A SPACIOUS RECREATION RO0M WITH WORKOUT EQUIPMENT, A POOL TABLE, A PING PONG TABLE, FULL KITCHEN, FOR USE AND ENJOYMENT.
-
2023-04-14price $109,000 497-char remark
Show marketing remark (497 chars)
SENIOR PARK 55 AND OLDER COMMUNITY. WITH ONE OF THE LOWEST SPACE RENT IN THE CITY OF CHATSWORTH. RECENTLY REMODELED: ALL NEW PAINT THRU OUT INTERIOR OF THE HOME AND NEW CARPET. HOME HAS 2 BR, 2BATHS, DINING AREA, AND AN EXPANDED AREA THAT MAY BE USED FOR AN OFFICE, SITTING ROOM, OR POSSIBLY ANOTHER ROOM, WITH SEPARATE ENTRY. THE PARK OFFERS A COMMUNITY POOL & JACUZZI, A SPACIOUS RECREATION RO0M WITH WORKOUT EQUIPMENT, A POOL TABLE, A PING PONG TABLE, FULL KITCHEN, FOR USE AND ENJOYMENT.
-
2023-03-26$130,000 Active 497-char remark
Show marketing remark (497 chars)
SENIOR PARK 55 AND OLDER COMMUNITY. WITH ONE OF THE LOWEST SPACE RENT IN THE CITY OF CHATSWORTH. RECENTLY REMODELED: ALL NEW PAINT THRU OUT INTERIOR OF THE HOME AND NEW CARPET. HOME HAS 2 BR, 2BATHS, DINING AREA, AND AN EXPANDED AREA THAT MAY BE USED FOR AN OFFICE, SITTING ROOM, OR POSSIBLY ANOTHER ROOM, WITH SEPARATE ENTRY. THE PARK OFFERS A COMMUNITY POOL & JACUZZI, A SPACIOUS RECREATION RO0M WITH WORKOUT EQUIPMENT, A POOL TABLE, A PING PONG TABLE, FULL KITCHEN, FOR USE AND ENJOYMENT.
-
2014-12-17soldstatus $43,500 Closed
-
2014-11-10status Pending
-
2014-09-28$47,500 Active
-
2005-01-26historical
-
2004-02-01
ⓘ Source: listings_history table (triggers on properties + properties_extension) + one-shot
backfill from property_details.listing_events for pre-trigger history.
Climate risk First Street
- Flood 2/10 Low FEMA zone X (unshaded) · 7% chance over 30 yrs
- Wildfire 3/10 Moderate
- Heat 5/10 Major 7 d/yr ≥100°F today · 19 d/yr by 30 yrs out
- Wind 1/10 Low
- Air quality 4/10 Moderate 5 unhealthy d/yr today · 7 by 30 yrs out
Nearby sold comps map
Loading sold comps map…
Walkable amenities ~0.75 mi
Loading nearby amenities…
Taxation est. · year 1
- Rental income
- $30,126
- − Mortgage interest
- −$10,643
- − Property taxes
- −$2,850
- − Insurance
- −$950
- − Repairs & maintenance
- −$2,410
- − Management
- −$2,410
- − Depreciation
- −$5,527
- Taxable income
- $5,336
- Est. tax owed @ 24.0%
- −$1,281
- After-tax cash flow
- $6,762/yr
For passive investors: Depreciation is non-cash, so a rental often shows a tax loss while cash-flowing — sheltering income. Rental losses are passive: they offset passive income freely, and up to $25,000/yr can offset ordinary (W-2) income if you actively participate and your MAGI is under $100k (phasing out to $0 by $150k); unused losses carry forward. On sale, claimed depreciation is recaptured at up to 25%, and gains may owe capital-gains tax (a 1031 exchange can defer both). Figures are a year-1 estimate at your 24.0% rate — not tax advice; consult a CPA.
Schools (NCES district)
- District
- Los Angeles Unified
- NCES district ID
- 0622710
- Math proficiency
- 29% ▼ -4.00%
- Reading proficiency
- 54% ▲ 10.00%
- Median HH income
- $50,403
- Composite
- 35.67/100
- National rank
- #4875
- State rank
- #223 of 517 in CA
Livability — Los Angeles
- Score
- 68/100
- State rank
- #273
- US rank
- #9237
Category grades
Schools grade is shown separately in the Schools card above.
Census & demographics
- Census place
- Los Angeles, CA
- County
- Los Angeles County · 9,444,647 people
- City population
- 3,838,149
- Metro
- Los Angeles-Long Beach-Anaheim, CA
- Population (ZIP)
- 40,898
- Household income
- $119,386
- Rent vs Own
- Severe rent burden
- 1205.0
Population outlook (Los Angeles County) Hauer SSP2
- Today (2025)
- 10,940,515 people
- By 2030
- 11,256,481 · +2.9%
- By 2040
- 11,729,929 · +7.2%
- By 2050
- 11,948,407 · +9.2%
- By 2075
- 11,818,114 · +8.0%
- By 2100
- 10,842,928 · -0.9%
Race, ethnicity, and origin ACS 2023
- Neighborhood character
- Highly diverse neighborhood (Simpson 0.71)
- Race & ethnicity
- White 41% Hispanic / Latino 29% Asian 18% Two or more races 15% Black 7%
- Hispanic origin (detail)
- Mexican 17%
- Common ancestry
- Scotch-Irish 2% Romanian 2% Italian 1%
- Foreign-born
- 29% · Canada, South Korea, Vietnam
- Languages at home
- 58% English-only · Spanish 19% Other Indo-European 8% Tagalog/Filipino 4%
Political lean MEDSL · Los Angeles
- 2024 margin
- Solid D (+32.9) · D 64.8% · R 31.9% · Other 3.3%
- 2008→2024 swing
- -7.4pp toward R · 2008: 40.4pp · 2024: 32.9pp
- All cycles
- 2024: D+32.9 2020: D+44.2 2016: D+48.0 2012: D+40.0 2008: D+40.4
Not yet ingested
- Civics
- —
Market trends
- HPI YoY
- ▼ -777.33%
- Current HPI
- 348.8389
- Rent YoY
- ▲ 3.41%
- Metro
- Los Angeles-Long Beach-Anaheim, CA
- State GDP YoY
- ▲ 3.21%
- F500 in state
- 116
Industry mix (Fortune 500 HQ in CA)
| Industry | F500 HQs | Revenue |
|---|---|---|
| Technology | 27 | $1,492B |
|
||
| Financial Services | 3 | $174B |
|
||
| Retail | 3 | $44B |
|
||
| Insurance | 3 | $26B |
|
||
| Media / Entertainment | 2 | $115B |
|
||
| Pharmaceuticals / Biotech | 2 | $62B |
|
||
Price history
+300.0% since first listed12 events — show timeline
- 2026-04-09 Listed $190,000 CRMLS
- 2023-08-17 Sold (MLS) $109,000 CRMLS
- 2023-08-10 Contingent — CRMLS
- 2023-07-20 Pending — CRMLS
- 2023-06-19 Contingent — CRMLS
- 2023-04-14 Price Changed $109,000 CRMLS
- 2023-03-26 Listed $130,000 CRMLS
- 2014-12-17 Sold (MLS) $43,500 TheMLS
- 2014-11-10 Pending — TheMLS
- 2014-09-28 Listed $47,500 TheMLS
- 2005-01-26 Delisted — TheMLS
- 2004-02-01 Listed — TheMLS
Property tax history
+4.5%/yrLatest (2025): $317 · +4.5% YoY. Source: county tax records.
Cash-flow waterfall
monthlySold comps — $/sqft
last 12 mo · ≤1 miLoading sold comps…