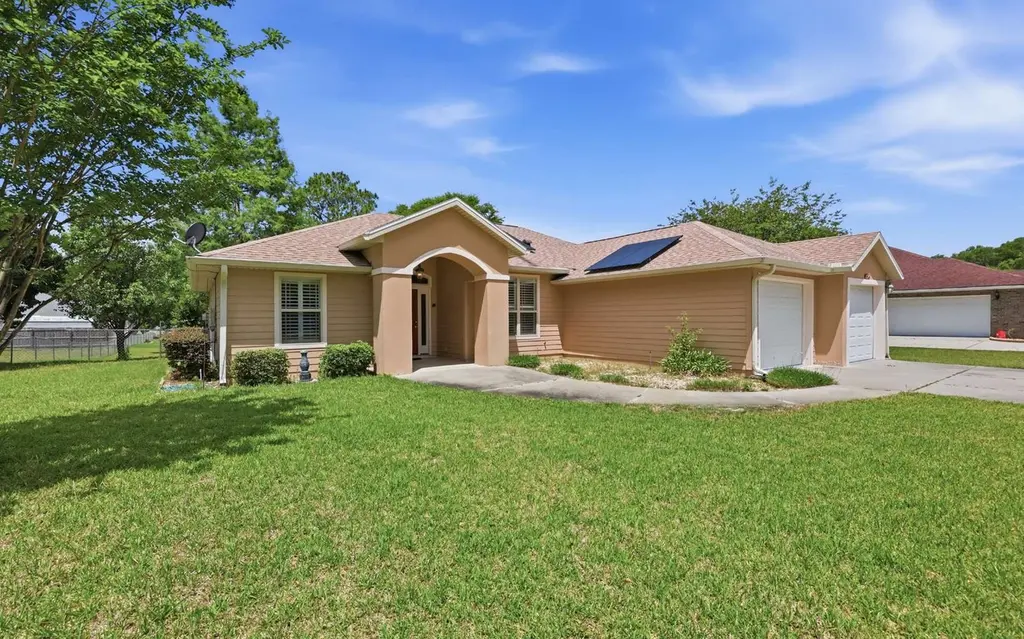
604 SW Phillips Cir · Lake City, FL
Flood risk 1/10 · Minimal
- FEMA flood zone
- X (unshaded)
- Chance of flooding over 30 yrs
- 0.0%
- Est. flood insurance / yr
- $507 – $1,088
Fire risk 5/10 · Moderate
- Est. fire insurance / yr
- $947 – $1,759
Heat risk 8/10 · Major
- Hot days now (above 107°F)
- 7 days/yr
- Hot days in 30 yrs
- 21 days/yr
Wind risk 9/10 · Severe
- Chance of severe wind over 30 yrs
- 99.0%
Air-quality risk 5/10 · Moderate
- Unhealthy air days now
- 9 days/yr
- Unhealthy air days in 30 yrs
- 10 days/yr
Risk factors via First Street. Map © Google.
Why this score? — see what drove the D grade
The composite is a weighted blend of 9 inputs, each scored 0–100. Each bar is that input's sub-score; the figure is the points it added to the 100-point composite (weight × sub-score).
- Appreciation +10.0/10.0
- ARV discount +8.7/15.0
- Cash flow +7.7/30.0
- Schools +4.5/10.0
- Livability +3.7/5.0
- Rent growth +2.5/5.0
- Condition / age +2.5/5.0
- DSCR +1.8/10.0
- 1% rule +1.2/10.0
$299,999
🖨 Deal sheet (PDF) 📄 Offer letter ✓ Due diligence
Listing remarks
Welcome to this well maintained 3-bed, 2-bath split plan home in the desirable Turkey Run subdivision, offering a blend of comfort, efficiency, and outdoor enjoyment. Turkey Run is a one entrance/exit development of 1/2 acre lots that is convenient to US 90 and I-75 but maintains that country feel. Installed in 2022 along with a new roof, the owner-owned full solar panel system provides long-term savings and peace of mind. Imagine months of electric bills with a credit balance due. Inside, you’ll find a large living space perfect for gatherings, along with a cozy breakfast niche overlooking the spacious backyard. Step outside to a screened-in back porch ideal for year-round relaxation
Key facts
- Well for irrigation
- 0.5 acre lot
- 2 garage spots
Tags
Property features AI
Exterior
- Parking: 2-car garage
- Utilities: Cable available
- Home design: Single-story residential home; Frame construction; Slab foundation; Zoned RSF-2
- Construction: Frame construction; Shingle roof; Slab foundation
- Exterior features: Half-acre lot (approx. 0.5 acre); Shingle roof
Interior
- Kitchen: Dishwasher; Electric cooktop; Refrigerator; Microwave; Disposal
- Flooring: Carpet
- Bathrooms: 2 full bathrooms
- Heating & cooling: Central heating (electric); Central air; Ceiling fan(s)
- Interior features: Insulated windows; Covered, screened patio/porch; Chain link fence; Shed(s) on the property
- Laundry & utility: Washer; Dryer
Neighborhood map
What this means for you Summary
Snapshot
- This is a 3-bed/2.0-bath single-family listed at $300k.
Deal economics
- At list price, monthly cash flow is $-346 ($-4k/yr) — negative.
- To cash-flow at today's rent, offer at most $239k (20.4% below list).
- To meet the 1% rule (rent ≥ 1% of price), the offer needs to be $187k (37.7% below list).
- Recommended offer: $187k (37.7% below list) — sets the bar for 1% rule.
- Cap rate 4.9% vs local median 3.8% in Lake City — top-decile yield for the area; either an underpriced asset or a hidden risk that comps aren't pricing in. Stress-test before assuming the spread holds.
Location & tenants
- Location reads 73/100 on livability (#304 in FL) — a middle-class / working-renter tenant base. Strengths: cost of living A+, housing A+, health & safety A+; Watch: amenities C-, commute F, employment F.
- Columbia (town): math 53% / reading 54% proficiency, ranked #25 of 73 in FL (top 34%) — acceptable for families but not a draw, mixed tenant base, ~2y average lease.
- Zoned schools: Westside Elementary School (math 78% / reading 74%, grade A, #198 of 2,144 statewide, top 10%, 696 students, 50% FRL); Columbia High School (math 28% / reading 45%, grade F, #351 of 667 statewide, top 54%, 1,737 students, 50% FRL).
- Market conditions: 206 active listings in the ZIP; 178 units permitted in Columbia County in 2024 (0 in 5+ unit buildings).
Forward outlook
- In year one you build about $32k of equity ($2k loan paydown + $30k appreciation (10.0% local appreciation)).
- Columbia County population projected to shrink 7% by 2050 — rents likely to lag national; underwrite the cash flow, not the appreciation.
- By year 2, paydown + projected appreciation supports a ~$52k cash-out refi (75% LTV) — recoverable capital for the next deal without selling this one.
Negotiation context
- It's been on market 45 days — a 3% lower offer ($291k) is reasonable based on typical stale-listing flexibility.
- Current owner paid $48k; list at $300k implies a 525% gain — meaningful room to come down on a strong offer.
Risks & watch-outs
- Climate carrying-cost: severe wind risk, 99% chance of damaging wind over 30y; moderate wildfire risk; extreme-heat days projected 7→21/yr by 2055 (HVAC capex compounding) — expect insurance premiums to compound above CPI over the hold.
Questions for the listing agent
- What do current leases actually rent for vs. the listed asking? Can we see a recent rent roll and the last 12 months of T-12 income?
- It's been on market 45 days. Have you received any prior offers? Is the seller open to a 38% concession, seller financing, or rate buy-down credit?
- Is there a deadline driving the sale (1031 exchange, divorce, estate, relocation)? That informs how much negotiation room exists.
- Schools are B-rated — typically a magnet for longer-tenancy family renters. What's the average tenant stay here, and is there a school-zone premium baked into asking?
- The area grade is low — what's the realistic commute time and amenity access for the typical tenant pool here? Any planned neighborhood developments (good or bad) we should know about?
- What's the average days-on-market for RENTAL listings here right now (not sales)? A rising rental-DOM trend means longer vacancies and softer asking-rent achievability than the comps imply.
- What's the recent tenant-quality profile in this submarket — average credit score on applications, eviction rate, late-payment / NSF rate, and stable-employment percentage? A property-management company in the area should have these aggregated.
- How much new for-sale + rental construction is in the pipeline within 1–3 miles? Heavy new supply typically softens prices + rents 12–24 months out; constrained supply supports both.
Investment metrics
- 1% rule
- 0.62% ✗
- Cap rate
- 4.91%
- Cash-on-cash
- -4.94%
- DSCR
- 0.78
- GRM
- 13.4
CMA / ARV
- ARV (on-the-fly)
- $307,911
- Comps found
- 11
Show comp detail 11 sales within ~0.75 mi
| Address | Dist | Beds/Ba | Sqft | Sold | Price | $/sf | Match |
|---|---|---|---|---|---|---|---|
| 287 SW Phillips Cir | 0.11mi | 3/2.0 | 1,608 (+3%) | 17mo | $305,000 | $190 | 76 |
| 1256 SW County Road 252b | 0.13mi | 3/2.0 | 1,400 (-10%) | 4mo | $265,000 | $189 | 74 |
| 180 SW Ethel Gln | 0.10mi | 3/2.0 | 1,740 (+11%) | 6mo | $342,000 | $197 | 72 |
| 116 SW Lucile Ct | 0.59mi | 3/2.0 | 1,592 (+2%) | 11mo | $325,000 | $204 | 60 |
| 138 SW Pilots Way | 0.72mi | 3/2.0 | 1,483 (-5%) | 3mo | $283,000 | $191 | 55 |
| 127 SW Sunset Way | 0.72mi | 3/2.0 | 1,458 (-7%) | 2mo | $287,500 | $197 | 54 |
| 281 SW Silver Palm Dr | 0.52mi | 4/2.0 (+1) | 1,711 (+10%) | 3mo | $362,000 | $212 | 53 |
| 151 SW Silver Palm Dr | 0.40mi | 4/2.0 (+1) | 1,760 (+13%) | 4mo | $354,150 | $201 | 52 |
| 311 SW Silver Palm Dr | 0.55mi | 4/2.0 (+1) | 1,635 (+5%) | 12mo | $368,000 | $225 | 52 |
| 554 SW Mayfair Ln | 0.46mi | 3/2.0 | 1,786 (+14%) | 6mo | $270,000 | $151 | 49 |
| 359 SW Silver Palm Dr | 0.59mi | 4/2.0 (+1) | 1,760 (+13%) | 12mo | $382,400 | $217 | 37 |
Match score weights: distance 35% · size 25% · config 20% · recency 20%. Top-matched comps best support the ARV.
Projected returns pro-forma
10.0% appreciation · 3.0% rent growth · sell at horizon
- IRR
- 20.8%
- Equity multiple
- 2.68×
- Total profit
- $141,224
- Equity at exit
- $270,263
- IRR
- 18.8%
- Equity multiple
- 6.15×
- Total profit
- $432,960
- Equity at exit
- $582,832
Cash invested: $84,000 (down + closing). Projections, not guarantees.
Landlord ↔ Tenant lean methodology
- Overall (STATE)
- 87 Strongly Landlord-Friendly
- State Florida
- 87 Strongly Landlord-Friendly · R+3
- County
- — inherits STATE
- City
- — inherits STATE
ZIP-level market 32024
- Home prices YoY
- 7.6%
- Active inventory
- 206
- Price-to-rent
- 13.4×
Monthly cashflow live
- Estimated rent
- $1,869 medium interval (Pro) →
- Mortgage (P&I)
- −$1,573
- Tax from tax record
- −$124 /mo · $1,487/yr
- Insurance
- −$125
- HOA
- −$0
- Vacancy / Maint / Mgmt
- −$392
- Net cashflow
- $-346
Break-even live
Sensitivity live
| Price | -10% $-176 | -5% $-261 | +0% $-346 | +5% $-431 | +10% $-516 |
|---|---|---|---|---|---|
| Rent | -10% $-494 | -5% $-420 | +0% $-346 | +5% $-272 | +10% $-198 |
| Rate | -1.0pp $-195 | -0.5pp $-270 | base $-346 | +0.5pp $-424 | +1.0pp $-503 |
UW: 25.0% down · 7.5% · 30yr · 1.5% tax · 5.0% vac · 8.0% maint · 8.0% mgmt
Financing live
Cash to close
- Down payment
- $75,000
- Closing costs
- $9,000
- Reserves months
- —
- Total cash needed
- —
Loan-product check · same deal, 3 products live
Conventional
25% down · 7.5% · 30yr
- Down + closing
- —
- Monthly P&I
- —
- Monthly cashflow
- —
- DSCR
- —
- Eligible?
- —
Personal DTI + credit; lowest rate.
DSCR
20% down · 8.5% · 30yr
- Down + closing
- —
- Monthly P&I
- —
- Monthly cashflow
- —
- DSCR
- —
- Eligible?
- —
No personal income docs; deal must DSCR.
Hard money
10% down · 12.0% · 12mo
- Down + closing
- —
- Monthly P&I
- —
- Monthly cashflow
- —
- DSCR
- —
- Eligible?
- —
Short-term bridge; refi at stabilization.
Listing history 21 events
-
2026-06-22days on market $299,999 Active 45 DOM
-
2026-06-21days on market $299,999 Active 44 DOM
-
2026-06-19days on market $299,999 Active 42 DOM
-
2026-06-18price $299,999 Active 41 DOM
-
2026-06-18days on market $315,000 Active 41 DOM
-
2026-06-17days on market $315,000 Active 40 DOM
-
2026-06-16days on market $315,000 Active 39 DOM
-
2026-06-15days on market $315,000 Active 38 DOM
-
2026-06-14days on market $315,000 Active 36 DOM
-
2026-06-12days on market $315,000 Active 35 DOM
-
2026-06-09days on market $315,000 Active 32 DOM
-
2026-06-08days on market $315,000 Active 31 DOM
-
2026-06-07days on market $315,000 Active 30 DOM
-
2026-06-05days on market $315,000 Active 27 DOM
-
2026-06-03days on market $315,000 Active 26 DOM
-
2026-06-02days on market $315,000 Active 25 DOM
-
2026-06-01days on market $315,000 Active 24 DOM
-
2026-05-31days on market $315,000 Active 23 DOM
-
2026-05-30days on market $315,000 Active 22 DOM
-
2026-05-08$315,000 Active
-
2005-01-03soldstatus $48,000
ⓘ Source: listings_history table (triggers on properties + properties_extension) + one-shot
backfill from property_details.listing_events for pre-trigger history.
Tax reassessment forecast FL · Resets to sale price
- Current annual tax
- $1,487 · $124/mo
- Projected year-2 tax
- $2,490 · $207/mo
- Expected delta
- +$1,003/yr (+$84/mo · 67.4%)
ⓘ Screening estimate from a state-policy table — verify with the county assessor before closing.
Climate risk First Street
- Flood 1/10 Low FEMA zone X (unshaded) · 0% chance over 30 yrs
- Wildfire 5/10 Major
- Heat 8/10 Severe 7 d/yr ≥107°F today · 21 d/yr by 30 yrs out
- Wind 9/10 Extreme 99% chance of damaging wind over 30 yrs
- Air quality 5/10 Major 9 unhealthy d/yr today · 10 by 30 yrs out
Nearby sold comps map
Loading sold comps map…
Walkable amenities ~0.75 mi
Loading nearby amenities…
Taxation est. · year 1
- Rental income
- $22,422
- − Mortgage interest
- −$16,805
- − Property taxes
- −$1,487
- − Insurance
- −$1,500
- − Repairs & maintenance
- −$1,794
- − Management
- −$1,794
- − Depreciation
- −$8,727
- Taxable loss
- −$9,684
- Est. tax savings @ 24.0%
- +$2,324
- After-tax cash flow
- $-1,828/yr
For passive investors: Depreciation is non-cash, so a rental often shows a tax loss while cash-flowing — sheltering income. Rental losses are passive: they offset passive income freely, and up to $25,000/yr can offset ordinary (W-2) income if you actively participate and your MAGI is under $100k (phasing out to $0 by $150k); unused losses carry forward. On sale, claimed depreciation is recaptured at up to 25%, and gains may owe capital-gains tax (a 1031 exchange can defer both). Figures are a year-1 estimate at your 24.0% rate — not tax advice; consult a CPA.
Schools (NCES district)
- District
- Columbia
- NCES district ID
- 1200360
- Math proficiency
- 53% ▼ -10.00%
- Reading proficiency
- 54% ▼ -3.00%
- Median HH income
- $40,053
- Composite
- 44.74/100
- National rank
- #2750
- State rank
- #25 of 73 in FL
Livability — Lake City
- Score
- 73/100
- State rank
- #304
- US rank
- #5154
Category grades
Schools grade is shown separately in the Schools card above.
Census & demographics
- City population
- 40,507
- Population (ZIP)
- 20,644
Population outlook (Columbia County) Hauer SSP2
- Today (2025)
- 68,129 people
- By 2030
- 67,501 · -0.9%
- By 2040
- 65,465 · -3.9%
- By 2050
- 63,058 · -7.4%
- By 2075
- 56,291 · -17.4%
- By 2100
- 45,243 · -33.6%
Race, ethnicity, and origin ACS 2023
- Neighborhood character
- Predominantly White (78%)
- Race & ethnicity
- White 78% Hispanic / Latino 10% Two or more races 7% Black 6% Asian 2%
- Hispanic origin (detail)
- Mexican 2% Puerto Rican 3%
- Common ancestry
- Italian 2% Portuguese 1% Lithuanian 1%
- Foreign-born
- 5% · Canada, Jamaica
- Languages at home
- 91% English-only · Spanish 8% Vietnamese 1%
Political lean MEDSL · Columbia
- 2024 margin
- Solid R (+50.2) · D 24.6% · R 74.7%
- 2008→2024 swing
- -16.4pp toward R · 2008: -33.8pp · 2024: -50.2pp
- All cycles
- 2024: R+50.2 2020: R+45.2 2016: R+44.5 2012: R+36.7 2008: R+33.8
Not yet ingested
- Civics
- —
Market trends
- HPI YoY
- ▲ 19.05%
- Current HPI
- 269.4659
- Rent YoY
- —
- Metro
- —
- State GDP YoY
- ▲ 3.28%
- F500 in state
- 36
Industry mix (Fortune 500 HQ in FL)
| Industry | F500 HQs | Revenue |
|---|---|---|
| Industrial Technology | 2 | $29B |
|
||
| Insurance | 2 | $17B |
|
||
| Retail | 1 | $60B |
|
||
| Technology Distribution | 1 | $58B |
|
||
| Homebuilding | 1 | $35B |
|
||
| Technology Manufacturing | 1 | $35B |
|
||
Price history
+556.2% since first listed2 events — show timeline
- 2026-05-08 Listed $315,000 NFMLS
- 2005-01-03 Sold (Public Records) $48,000 Public Records
Property tax history
-0.4%/yrLatest (2025): $1,487 · +0.4% YoY. Source: county tax records.
Cash-flow waterfall
monthlySold comps — $/sqft
last 12 mo · ≤1 miLoading sold comps…